Iran (Islamic Republic of Iran) Automobile Market Size 2025-2029
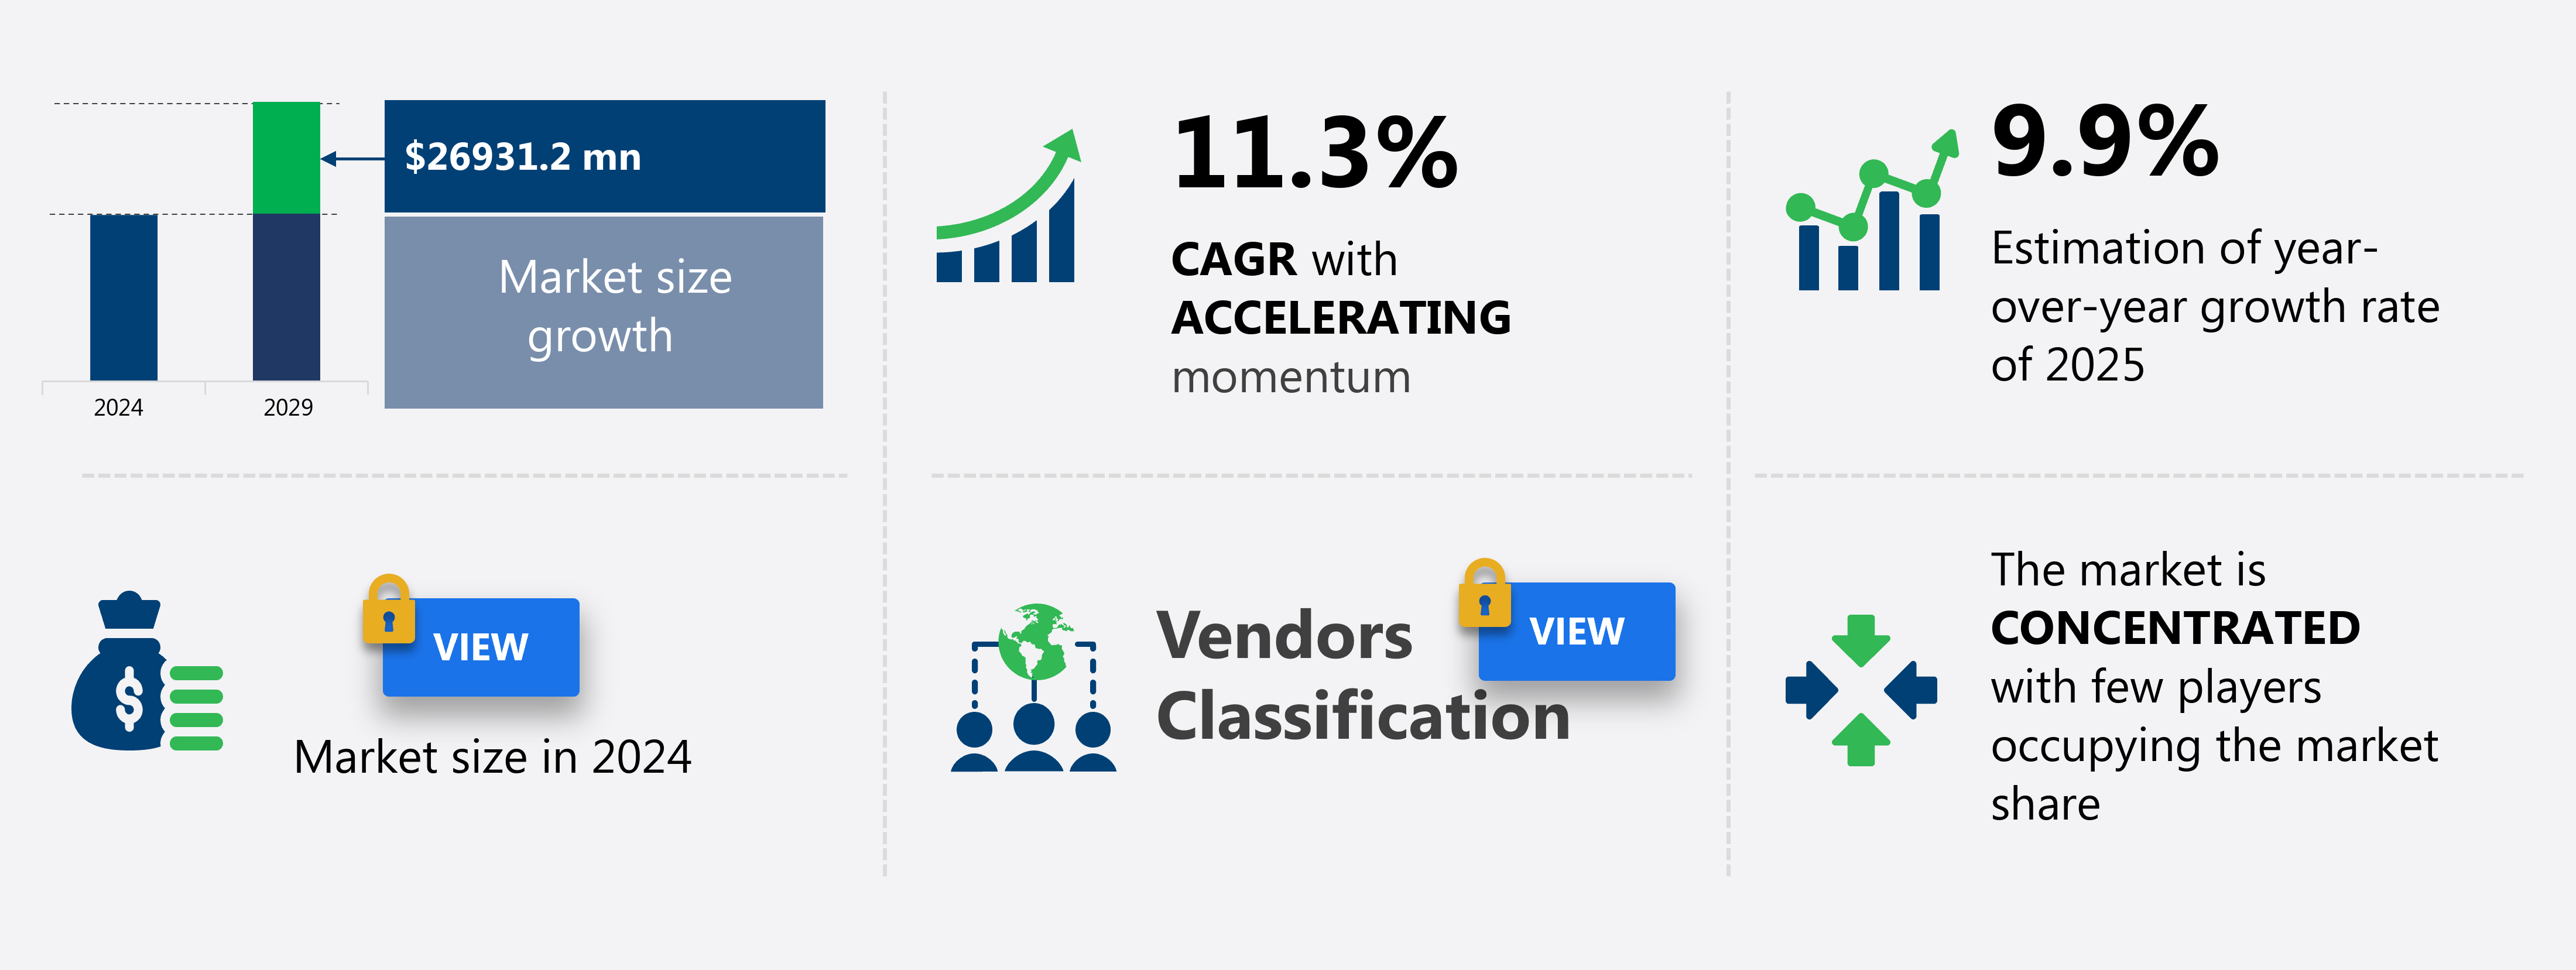
The Iran (Islamic Republic of Iran) automobile market size is forecast to increase by USD 26.93 billion at a CAGR of 11.3% between 2024 and 2029.
- The automobile market is experiencing significant growth driven by key trends, including the increasing adoption of advanced technologies in vehicle manufacturing. Another notable trend is the increasing demand for electric vehicles, as consumers become more environmentally conscious and governments implement stricter emissions regulations. In addition, in the packaging sector, there is a growing preference for eco-friendly and recyclable options, such as those derived from graphite and thermoplastic. However, the market faces challenges such as the rising cost of raw materials, particularly in regions like Iran, which can impact the affordability of automobiles for consumers. To stay competitive, automakers must continually innovate and find ways to reduce production costs while maintaining quality and safety standards. The automobile market is poised for continued growth, but companies must navigate these trends and challenges to succeed.
What will be the Size of the Market During the Forecast Period?
- The automobile market is experiencing significant dynamics and trends that impact the demand for various materials used In the manufacturing industry. Supply chain disruptions and construction activities have led to an increased focus on local sourcing and the use of alternative materials. Moreover, the automobile industry is embracing green alternatives, with a focus on recycling and the use of materials with superior mechanical properties, water resistance, fire resistance, and thermal conductivity. These include lightweight insulation products, such as those used in walls and roofs, made from polystyrene beads or other advanced materials.
- Moreover, the residential and non-residential construction sectors are also undergoing a transformation, with a shift towards energy efficiency and sustainability. Innovations in insulation, including thermo-acoustic insulation and formwork, are being adopted to reduce maintenance costs and enhance the value of construction projects. In Vancouver's vibrant real estate market, areas such as Vancouver Granville, Keith Drive, and the False Creek Flats are witnessing an increase in housing renovation and new construction projects. The use of advanced insulation materials is a key consideration for builders and developers to meet the growing demand for eco-friendly and energy-efficient structures. Overall, the automobile market is evolving to meet the demands of a changing world, with a focus on sustainability, recyclability, and cost-effectiveness.
How is this market segmented and which is the largest segment?
The market research report provides comprehensive data (region-wise segment analysis), with forecasts and estimates in "USD billion" for the period 2025-2029, as well as historical data from 2019-2023 for the following segments.
- Vehicle Type
- Passenger vehicles
- Commercial vehicles
- Type
- Conventional
- EV
- Class Type
- Economy
- Premium
- Geography
- Iran (Islamic Republic of Iran)
By Vehicle Type Insights
- The passenger vehicles segment is estimated to witness significant growth during the forecast period.
The automobile market in Iran is influenced by economic factors, including GDP growth, inflation rates, and consumer purchasing power. Iran's lower gasoline prices make it an attractive market for passenger vehicles, particularly diesel-based models due to their fuel efficiency and higher torque. However, stricter emission regulations and negative public perception pose challenges for this sector. Iran's domestic manufacturers, such as Iran Khodro and SAIPA, have played a significant role In the Iranian automobile industry. As global energy trends shift towards renewable sources, the demand for energy-efficient vehicles may increase, potentially impacting the Iranian automobile market. Iran's economic stability and growth continue to influence consumer behavior and investment in new vehicles.

Get a glance at the market report of share of various segments Request Free Sample
Market Dynamics
Our Iran (Islamic Republic of Iran) Automobile Market researchers analyzed the data with 2024 as the base year, along with the key drivers, trends, and challenges. A holistic analysis of drivers will help companies refine their marketing strategies to gain a competitive advantage.
What are the key market drivers leading to the rise in adoption of Iran (Islamic Republic of Iran) Automobile Market?
Growing technological advancements in automobile industry is the key driver of the market.
- The automobile market is experiencing significant changes due to various factors, including supply chain disruptions and construction activities. These elements have affected the production and distribution of automobiles, leading to increased demand for alternative solutions. The packaging sector is responding by exploring green alternatives, such as recycling and using lightweight insulation products made from graphite, thermoplastic, and polystyrene beads. These materials offer improved mechanical properties, water resistance, and thermal insulation, making them ideal for use in rigid food service containers, appliance housings, envelope windows, automobile body panels, and wind turbine parts. As the world moves towards energy efficiency and NetZero Energy, the protective packaging market is also evolving, with a focus on manufacturing automation and improved molding techniques.
- Moreover, smart packaging in Europe is driving innovation in this area, providing solutions for residential and commercial applications. The trend towards electric vehicles and autonomous driving technology is also impacting the automobile market, with a focus on safety features and real-time traffic management. In Iran, domestic production capabilities are being enhanced, and technological advancements are being incorporated to develop vehicles with improved features and performance. autonomous vehicles are being equipped with advanced sensor technologies, including lidar, radar, and cameras, to monitor the vehicle's surroundings and improve safety. This technology enables vehicles to communicate with one another, reducing the likelihood of accidents caused by human error and improving overall traffic management.
What are the market trends shaping the Iran (Islamic Republic of Iran) Automobile Market?
Rise in demand for electric vehicles is the upcoming trend In the market.
- The automobile market In the US is experiencing significant shifts due to various factors influencing the supply chain, particularly In the areas of construction activities, packaging sector, and automotive manufacturing. Supply chain disruptions, such as those caused by the pandemic, have led to increased demand for alternative materials and manufacturing processes. In the packaging sector, there is a growing trend towards green alternatives, including recycled materials and thermoplastic polystyrene beads for lightweight insulation products. These energy-efficient solutions are being adopted in various industries, including rigid food service, appliance housings, envelope windows, and automobile body panels. Additionally, the construction industry is seeing an increase In the use of graphite for thermal insulation and IR light reflection, improving mechanical properties and water resistance.
- Furthermore, in the automotive industry, these advancements are leading to the production of lighter, more efficient vehicles, including wind turbine parts and smart packaging for disposable cups. The protective packaging market is also benefiting from manufacturing automation, which is improving molding processes and reducing waste. Overall, these trends are driving innovation and sustainability In the US automobile market, with a focus on net-zero energy solutions and energy efficiency. British Columbia, for instance, is leading the way with its commitment to becoming a net-zero energy province by 2050. Smart Packaging Europe and other industry initiatives are also promoting the use of energy-efficient and sustainable packaging solutions in residential and commercial applications.
What challenges does Iran (Islamic Republic of Iran) Automobile Market face during the growth?
Rising raw material cost for automobiles in Iran is a key challenge affecting the market growth.
- The automobile market is currently experiencing escalating production costs due to the impact of geopolitical tensions and supply chain disruptions on the prices of essential materials such as steel, aluminum, and lithium. These factors, coupled with the growing demand for electric vehicles, have led to increased raw material prices and potential consumer price hikes. The construction of automobile body panels and structural components relies heavily on steel, making its price fluctuations a significant influence on manufacturing expenses. The ongoing pandemic continues to create bottlenecks in various stages of the supply chain, from mining operations to logistics, making it more challenging and costly to source raw materials.
- Moreover, the packaging sector, including applications In the rigid food service industry, appliance housings, envelope windows, and automobile body panels, is also affected by these challenges. The use of lightweight insulation products, such as those made from graphite, thermal insulation, IR light, and mechanical properties, as well as water resistance and thermoplastic materials like polystyrene beads, is gaining popularity as energy-efficient alternatives. The construction industry in British Columbia, Canada, and the residential and commercial sectors in Europe are embracing NetZero Energy initiatives, further driving demand for these materials. Manufacturing automation and improved molding processes are also being adopted to mitigate the effects of these challenges.
Exclusive Customer Landscape
The market forecasting report includes the adoption lifecycle of the market, covering from the innovator's stage to the laggard's stage. It focuses on adoption rates in different regions based on penetration. Furthermore, the market report also includes key purchase criteria and drivers of price sensitivity to help companies evaluate and develop their market growth analysis strategies.
_customer_landscape_abstract_2023_geo_v1.jpg)
Customer Landscape
Key Companies & Market Insights
Companies are implementing various strategies, such as strategic alliances, market forecast, partnerships, mergers and acquisitions, geographical expansion, and product/service launches, to enhance their presence In the market.
Brilliance China Automotive Holdings Ltd. - The company offers automobiles such as the Brilliance V3 crossover SUV, Brilliance H330, Brilliance H320 and H220 sedan.
The market research and growth report includes detailed analyses of the competitive landscape of the market and information about key companies, including:
- Hyundai Motor Co.
- Kerman Motor Co
- KIA CORP.
- Nissan Motor Co. Ltd.
- Renault SAS
- Toyota Motor Corp.
- Volkswagen AG
Qualitative and quantitative analysis of companies has been conducted to help clients understand the wider business environment as well as the strengths and weaknesses of key market players. Data is qualitatively analyzed to categorize companies as pure play, category-focused, industry-focused, and diversified; it is quantitatively analyzed to categorize companies as dominant, leading, strong, tentative, and weak.
Research Analyst Overview
The automobile market is a dynamic and intricate ecosystem that is influenced by various factors, including supply chain disruptions and construction activities. These elements can significantly impact the production and distribution of automobiles and their components. One of the most notable challenges faced by the automobile industry is the disruption of supply chains. Construction activities, such as roadwork and infrastructure projects, can cause delays In the transportation of raw materials and finished goods. This can lead to increased production costs and longer lead times for manufacturers. Another critical aspect of the automobile market is the shift towards sustainability and eco-friendly alternatives.
Moreover, the packaging sector is a significant contributor to the waste stream In the automobile industry. Therefore, there is a growing demand for green alternatives to traditional materials used in automobile manufacturing, such as graphite and thermoplastic. Graphite, a versatile material, is increasingly being used In thermal insulation and IR light absorption applications due to its excellent mechanical properties and high thermal conductivity. Thermoplastic, a type of plastic that can be melted and reformed multiple times, is another material gaining popularity due to its energy efficiency and recyclability. Moreover, the use of polystyrene beads as insulation material in automobile body panels, appliance housings, envelope windows, and wind turbine parts is being replaced by lightweight insulation products.
Furthermore, these new products offer improved energy efficiency and better water resistance, making them a preferred choice for manufacturers striving to reduce their carbon footprint. The automobile industry is also witnessing a trend towards net-zero energy and smart packaging. In British Columbia, for instance, there are initiatives to promote the use of renewable energy sources in manufacturing processes. Similarly, in Europe, smart packaging is gaining traction In the residential and commercial sectors, with companies like Pregis leading the way in protective packaging market innovation. The protective packaging market, which includes disposable cups and improved molding techniques, is undergoing significant changes due to manufacturing automation.
In addition, automation is enabling manufacturers to produce high-quality packaging at a lower cost and with greater consistency. Therefore, the automobile market is a complex and ever-evolving industry that is influenced by various factors, including supply chain disruptions, sustainability, and innovation. Manufacturers must stay abreast of these trends to remain competitive and meet the evolving needs of consumers. The use of advanced materials like graphite and thermoplastic, the shift towards net-zero energy and smart packaging, and manufacturing automation are some of the key trends shaping the future of the automobile industry.
The automobile market in the Islamic Republic of Iran is witnessing a significant shift towards the production of energy-efficient vehicles, with a focus on lightweight construction using advanced materials. This trend is particularly noticeable in the residential construction sector, where the use of lightweight building blocks, such as autoclaved aerated concrete (AAC), has gained popularity. These blocks offer several advantages, including high insulation properties, improved acoustic performance, and reduced board thickness for external walls, floors, and roof systems. In the food service industry, Iranian manufacturers are also embracing lightweight insulation products to keep temperatures consistent and reduce energy consumption. These insulation products are made from renewable resources and are highly efficient, making them a popular choice for rigid food service applications. Iran's automobile industry is also exploring the use of tub and shower products made from recycled materials, further reducing the environmental impact of manufacturing processes. The European packaging market is taking notice of these innovations, with many companies looking to Iran for sustainable and cost-effective solutions. Overall, the automobile market in Iran is leading the way in the use of lightweight materials and energy-efficient technologies, setting a positive example for the region and beyond.
|
Market Scope |
|
|
Report Coverage |
Details |
|
Page number |
139 |
|
Base year |
2024 |
|
Historic period |
2019-2023 |
|
Forecast period |
2025-2029 |
|
Growth momentum & CAGR |
Accelerate at a CAGR of 11.3% |
|
Market growth 2025-2029 |
USD 26.93 billion |
|
Market structure |
Concentrated |
|
YoY growth 2024-2025(%) |
9.9 |
|
Competitive landscape |
Leading Companies, Market Positioning of Companies, Competitive Strategies, and Industry Risks |
What are the Key Data Covered in this Market Research and Growth Report?
- CAGR of the market during the forecast period
- Detailed information on factors that will drive the market growth and forecasting between 2025 and 2029
- Precise estimation of the size of the market and its contribution of the market in focus to the parent market
- Accurate predictions about upcoming market growth and trends and changes in consumer behaviour
- Growth of the market across Iran (Islamic Republic of Iran)
- Thorough analysis of the market's competitive landscape and detailed information about companies
- Comprehensive analysis of factors that will challenge the growth of market companies
We can help! Our analysts can customize this market research report to meet your requirements. Get in touch
 RIA -
RIA - 
