Isostearic Acid Market Analysis Europe, APAC, North America, Middle East and Africa, South America - US, China, Japan, Germany, UK - Size and Forecast 2024-2028

Isostearic Acid Market Analysis Europe, APAC, North America, Middle East and Africa, South America - US, China, Japan, Germany, UK - Size and Forecast 2024-2028

Published: Nov 2023 162 Pages SKU: IRTNTR76815

Market Overview at a Glance

$120.28 Mn
Market Opportunity
7.06%
CAGR
6.29
YoY growth 2023-2024(%)

Isostearic Acid Market Size 2024-2028 

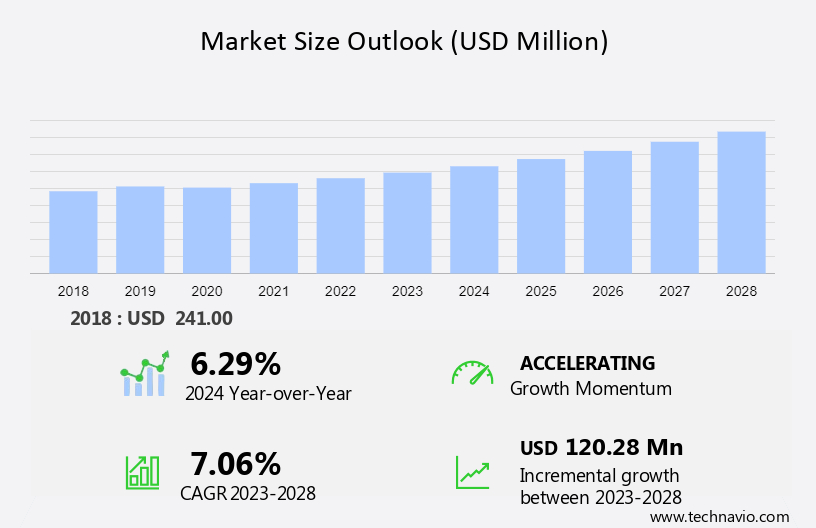
The isostearic acid market size is forecast to increase by USD 120.28 million at a CAGR of 7.06% between 2023 and 2028. Isostearic acid, a type of chemical ester, is gaining significant traction in various industries, particularly in the cosmetics and personal care sector. The increasing use of isostearic acid derivatives such as Isostearyl Isostearate and Isopropyl Isostearate in hair care and skincare products is driving the market growth. Additionally, the rising demand for bio-based products aligns with the production of isostearic acid from renewable sources, further boosting market expansion. However, concerns regarding the production and utilization of isostearic acid, including its potential environmental impact and safety concerns, may pose challenges to market growth. The cosmetics industry's reliance on isostearic acid in sin-protection creams, lipsticks, and other skin care applications underscores its importance as a key ingredient.

Isostearic Acid Market Size

 Request Free Sample

Isostearic acid is a type of saturated fatty acid that is gaining popularity in various industries due to its unique properties. This organic compound is a colorless, odorless solid with a melting point of 68-70°C. It is derived from sustainable raw materials, primarily oilseeds such as rapeseed oil, soybean oil, safflower oil, sunflower oil, palm oil, and beef tallow. The cosmetics industry is a significant consumer of isostearic acid. It is used in the production of chemical esters, including isostearyl isostearate and isopropyl isostearate. These esters are essential ingredients in various cosmetic products, such as hair care, skincare, sun-protection creams, and lipsticks.

Additionally, they provide excellent emollient properties, making them ideal for formulating creams and lotions. In the industrial sector, isostearic acid is used in the production of industrial cleaners and coatings. It acts as a thickener and emulsifier in these applications, enhancing the performance and stability of the final product. A stainless steel reactor, operated under controlled water pressure, is used to produce isostearic acid on a large scale. These companies have established a strong foothold in the market due to their commitment to innovation and sustainability.

In addition, isostearic acid is a versatile compound that offers numerous benefits. Its unique properties make it an ideal choice for various applications, from cosmetics to industrial cleaning and coatings. As the global population expands, the demand for sustainable raw materials is increasing, making isostearic acid a valuable commodity in the chemical industry. In conclusion, isostearic acid is a vital organic compound with a wide range of applications in various industries. Its use in cosmetics, industrial cleaners, and coatings is growing due to its excellent emollient properties and sustainability.

Market Segmentation

The market research report provides comprehensive data (region-wise segment analysis), with forecasts and estimates in "USD million" for the period 2024-2028, as well as historical data from 2018-2022 for the following segments.

  • Application
    • Chemical esters
    • Cosmetics
    • Lubricants and grease
    • Others
  • End-user
    • Personal care
    • Home care
    • Food and beverages
    • Others
  • Geography
    • Europe
      • Germany
      • UK
    • APAC
      • China
      • Japan
    • North America
      • US
    • Middle East and Africa
    • South America

By Application Insights

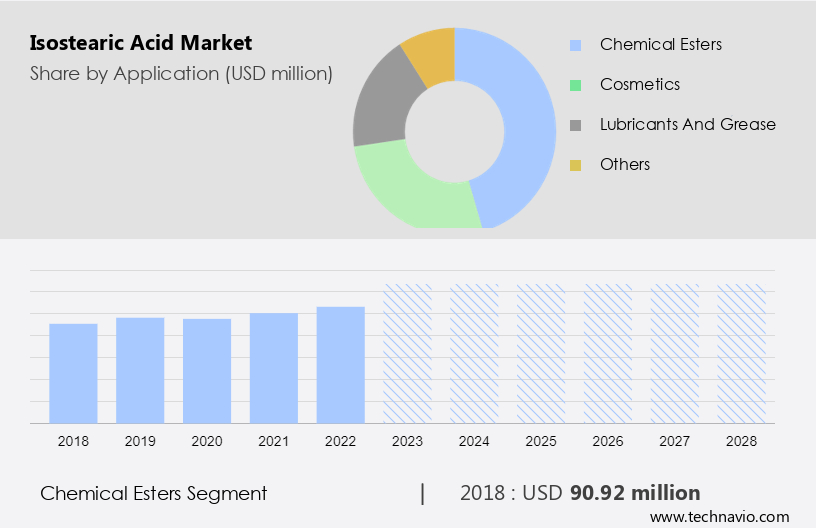
The chemical esters segment is estimated to witness significant growth during the forecast period. Isostearic acid plays a significant role in the cosmetics industry, particularly in the production of cosmetic esters. These esters are essential components of various personal care and cosmetic products, serving functions such as emollients, moisturizers, and texture enhancers in skincare and haircare formulations. The population expansion and the rise in middle-class disposable income have fueled the demand for high-quality cosmetics, leading to an increased use of isostearic acid esters. Isostearic acid-based esters are known for their ability to provide a soft, smooth, and non-greasy feel to the skin. They are effective in enhancing the texture and appearance of cosmetic and skincare products.

Furthermore, these esters act as solvents for various active ingredients and chemicals, ensuring their even distribution and stability within the formulations. In addition, isostearic acid esters offer advantages such as quick absorption rates, low residual amount, and enhanced dispersion. They function as pigment adhesion promoters and plasticizers, making them indispensable in various cosmetic applications. Polyhydric alcohols are often used in combination with isostearic acid esters to improve their performance and versatility. In conclusion, the demand for isostearic acid esters in the cosmetics industry is driven by their unique properties and the increasing consumer preference for high-quality personal care products.

Isostearic Acid Market Size

Get a glance at the market share of various segments Request Free Sample

The chemical esters segment was valued at USD 90.92 million in 2018 and showed a gradual increase during the forecast period.

Regional Insights

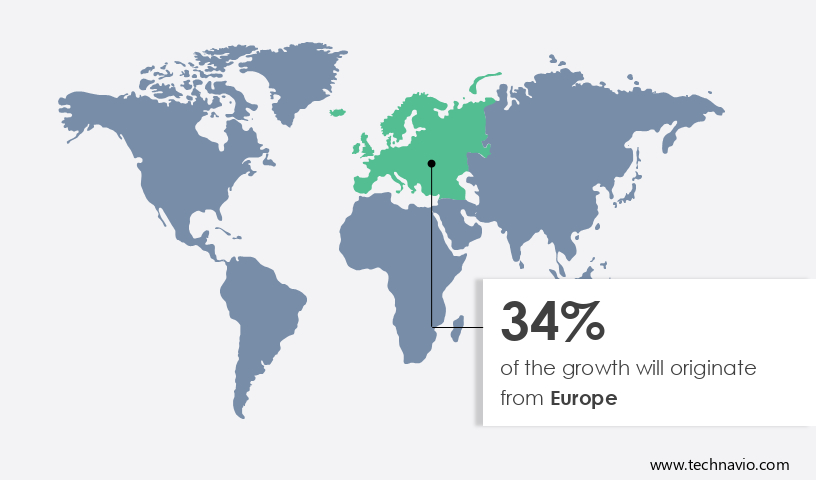
Europe is estimated to contribute 34% to the growth of the global market during the forecast period. Technavio's analysts have elaborately explained the regional trends and drivers that shape the market during the forecast period.

Isostearic Acid Market Share by Geography

For more insights on the market share of various regions Request Free Sample

Isostearic acid is a valuable commodity in various industries, particularly in Europe, where it finds extensive applications in pigment stabilization, lubricants, and greases. The European market for isostearic acid is projected to expand due to the region's thriving industries, such as cosmetics and personal care. This market growth can be attributed to the emollient properties of isostearic acid, making it a preferred ingredient in skincare products, lipsticks, and hair care formulations. Moreover, the European market's shift towards renewable materials and sustainability is driving the demand for isostearic acid. This acid can be derived from sustainable and renewable sources, making it an attractive alternative to fossil fuel-based materials.

Additionally, the clean beauty movement in Europe, which focuses on the use of eco-friendly ingredients, is further fueling the demand for isostearic acid. Isostearic acid is also widely used in the production of gasoline detergent and monoamide. The automotive industry's increasing focus on reducing emissions and improving fuel efficiency is expected to boost the demand for isostearic acid in the production of gasoline detergent. Additionally, isostearic acid's excellent lubricating properties make it a popular choice in the production of monoamide, which is used in various industrial applications. In conclusion, the European market for isostearic acid is poised for growth due to its diverse applications in various industries, including cosmetics, lubricants, greases, and fuel additives. The region's emphasis on sustainability and renewable materials is further driving the demand for isostearic acid as a viable alternative to fossil fuel-based materials. As a result, the market for isostearic acid in Europe is expected to experience steady growth during the forecast period.

Our researchers analyzed the data with 2023 as the base year, along with the key drivers, trends, and challenges. A holistic analysis of drivers will help companies refine their marketing strategies to gain a competitive advantage.

Market Driver

The increasing use of isostearic acid in cosmetics and personal care products is the key driver of the market. Isostearic acid is a valuable ingredient in various industries, including cosmetics, industrial cleaners, and coatings. In the cosmetics sector, this versatile compound plays a crucial role due to its multiple functions. It acts as an emollient, stabilizing agent, and thickener, making it indispensable in the production of a wide array of personal care products. These include lipsticks, foundations, moisturizers, and sunscreens. The cosmetics industry's focus on enhancing appearance, hygiene, and skincare has driven the demand for isostearic acid. Its ability to improve texture, spreadability, and stability in cosmetic formulations is a significant factor in maintaining product quality and consistency.

Manufacturing processes involve the hydrolysis of oleic acid in a stainless steel reactor, followed by esterification to produce isostearic acid. The global market for isostearic acid is expected to grow steadily, driven by the increasing demand for personal care products and the expanding industrial applications of this versatile compound.

Market Trends

The rising demand for bio-based products is the upcoming trend in the market. Isostearic acid, a type of chemical ester, is derived from natural sources such as vegetable oils as an eco-friendly alternative to petrochemical feedstocks. The chemical industry's focus on green chemistry and sustainability principles has fueled growing interest in bio-based products. Isostearic acid derived from natural sources is favored by companies and consumers who prioritize environmental friendliness.

Also, consumers are increasingly aware of the environmental and health implications of the products they use, making bio-based ingredients like isostearic acid popular choices in cosmetics, personal care products, and other applications. Additionally, the demand for sustainable packaging materials has accelerated the use of bio-based products, with isostearic acid serving as a key component in the production of eco-friendly packaging solutions.

Market Challenge

The concerns associated with production and use of isostearic acid is a key challenge affecting the market growth. Isostearic acid is derived from different sources, such as petrochemicals and vegetable oils, including rapeseed oil, soybean oil, safflower oil, sunflower oil, palm oil, and beef tallow. The selection of feedstock raises environmental concerns. The utilization of fossil fuels for production raises carbon emission issues. On the other hand, large-scale monoculture farming for vegetable oils can lead to deforestation and habitat destruction. The production process of isostearic acid is energy-intensive, which can result in significant greenhouse gas emissions if the energy source is non-renewable. Therefore, reducing energy consumption and transitioning to cleaner energy sources is essential for minimizing environmental impact.

Furthermore, chemical reactions during the production of isostearic acid generate hazardous byproducts and waste, which necessitates proper disposal methods. Adhering to sustainable practices and implementing eco-friendly production methods are crucial considerations for the isostearic acid industry.

Exclusive Customer Landscape

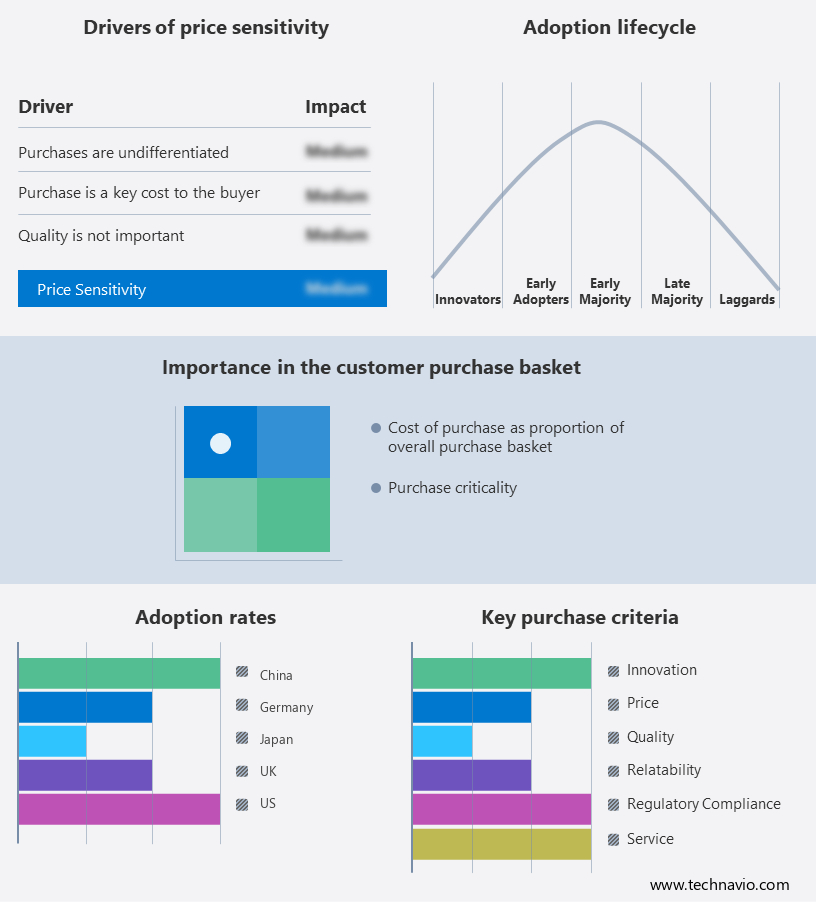
The market forecasting report includes the adoption lifecycle of the market, covering from the innovator's stage to the laggard's stage. It focuses on adoption rates in different regions based on penetration. Furthermore, the report also includes key purchase criteria and drivers of price sensitivity to help companies evaluate and develop their market growth analysis strategies.

Isostearic Acid Market Share by Geography

 Customer Landscape

Key Companies & Market Insights

Companies are implementing various strategies, such as strategic alliances, partnerships, mergers and acquisitions, geographical expansion, and product/service launches, to enhance their presence in the market.

ATAMAN Kimya AS: The company offers products such as 16 Methylheptadecanoic acid, 16 Methylmargaric acid, and Isooctadecanoic acid.

The market research and growth report includes detailed analyses of the competitive landscape of the market and information about key companies, including:

  • AVRIL SCA
  • BASF SE
  • CREMER OLEO GmbH and Co. KG
  • Croda International Plc
  • DL Chemical
  • Emery Oleochemicals Group
  • Kokyu Alcohol Kogyo Co. Ltd.
  • Kuala Lumpur Kepong Berhad
  • Merck KGaA
  • Nippon Fine Chemical Co. Ltd.
  • Nissan Chemical Corp.
  • Santa Cruz Biotechnology Inc.
  • SpecialChem S.A.
  • SysKem Chemie GmbH
  • The Procter and Gamble Co.
  • Thermo Fisher Scientific Inc.
  • Tokyo Chemical Industry Co. Ltd.
  • Vantage Specialty Chemicals
  • Kao Corp.

Qualitative and quantitative analysis of companies has been conducted to help clients understand the wider business environment as well as the strengths and weaknesses of key market players. Data is qualitatively analyzed to categorize companies as pure play, category-focused, industry-focused, and diversified; it is quantitatively analyzed to categorize companies as dominant, leading, strong, tentative, and weak.

Research Analyst Overview

Isostearic acid, a long-chain saturated fatty acid, is a valuable ingredient in various industries, including cosmetics, industrial cleaners, and coatings. Isostearic acid is used in cosmetics for hair care and skincare applications, such as sin-protection creams, lipsticks, and sun protection creams, due to its enhanced dispersion, quick absorption rates, and low residual amount. In industrial cleaners, it functions as a pigment adhesion promoter and ingredient solubilizer, while in coatings, it acts as a plasticizer and emulsifier.

In conclusion, isostearic acid is derived from various oilseeds, including rapeseed oil, soybean oil, safflower oil, sunflower oil, palm oil, and beef tallow. Its branching structure provides dispersing power, pigment stabilization, and lubrication properties. The increasing population expansion and middle-class disposable income have fueled the demand for isostearic acid in various industries. Additionally, its use in confections as an oil-in-water type emulsifier and in synthetic greases as a lubricant further expands its applications. The shift towards renewable materials and the depletion of fossil fuel reserves has also boosted the demand for isostearic acid as a sustainable alternative to monoamide and other fossil fuel-based chemicals in industries such as gasoline detergent.

Market Scope

Report Coverage

Details

Page number

162

Base year

2023

Historic period

2018-2022

Forecast period

2024-2028

Growth momentum & CAGR

Accelerate at a CAGR of 7.06%

Market growth 2024-2028

USD 120.28 million

Market structure

Fragmented

YoY growth 2023-2024(%)

6.29

Regional analysis

Europe, APAC, North America, Middle East and Africa, and South America

Performing market contribution

Europe at 34%

Key countries

US, China, Japan, Germany, and UK

Competitive landscape

Leading Companies, Market Positioning of Companies, Competitive Strategies, and Industry Risks

Key companies profiled

ATAMAN Kimya AS, AVRIL SCA, BASF SE, CREMER OLEO GmbH and Co. KG, Croda International Plc, DL Chemical, Emery Oleochemicals Group, Kokyu Alcohol Kogyo Co. Ltd., Kuala Lumpur Kepong Berhad, Merck KGaA, Nippon Fine Chemical Co. Ltd., Nissan Chemical Corp., Santa Cruz Biotechnology Inc., SpecialChem S.A., SysKem Chemie GmbH, The Procter and Gamble Co., Thermo Fisher Scientific Inc., Tokyo Chemical Industry Co. Ltd., Vantage Specialty Chemicals, and Kao Corp.

Market dynamics

Parent market analysis, market growth inducers and obstacles, market forecast, fast-growing and slow-growing segment analysis, COVID-19 impact and recovery analysis and future consumer dynamics, market condition analysis for the forecast period

Customization purview

If our market report has not included the data that you are looking for, you can reach out to our analysts and get segments customized.

Request Free Sample

What are the Key Data Covered in this Market Research and Growth Report?

  • CAGR of the market during the forecast period
  • Detailed information on factors that will drive the market growth and forecasting between 2024 and 2028
  • Precise estimation of the size of the market  and its contribution of the market in focus to the parent market
  • Accurate predictions about upcoming market growth and trends and changes in consumer behaviour
  • Growth of the market across Europe, APAC, North America, Middle East and Africa, and South America
  • Thorough analysis of the market's competitive landscape and detailed information about companies
  • Comprehensive analysis of factors that will challenge the growth of market companies

We can help! Our analysts can customize this market research report to meet your requirements. Get in touch

1 Executive Summary

  • 1.1 Market overview
    • Exhibit 01: Executive Summary – Chart on Market Overview
    • Exhibit 02: Executive Summary – Data Table on Market Overview
    • Exhibit 03: Executive Summary – Chart on Global Market Characteristics
    • Exhibit 04: Executive Summary – Chart on Market by Geography
    • Exhibit 05: Executive Summary – Chart on Market Segmentation by Application
    • Exhibit 06: Executive Summary – Chart on Market Segmentation by End-user
    • Exhibit 07: Executive Summary – Chart on Incremental Growth
    • Exhibit 08: Executive Summary – Data Table on Incremental Growth
    • Exhibit 09: Executive Summary – Chart on Vendor Market Positioning

2 Market Landscape

  • 2.1 Market ecosystem
    • Exhibit 10: Parent market
    • Exhibit 11: Market Characteristics

3 Market Sizing

  • 3.1 Market definition
    • Exhibit 12: Offerings of vendors included in the market definition
  • 3.2 Market segment analysis
    • Exhibit 13: Market segments
  • 3.3 Market size 2023
    • 3.4 Market outlook: Forecast for 2023-2028
      • Exhibit 14: Chart on Global - Market size and forecast 2023-2028 ($ million)
      • Exhibit 15: Data Table on Global - Market size and forecast 2023-2028 ($ million)
      • Exhibit 16: Chart on Global Market: Year-over-year growth 2023-2028 (%)
      • Exhibit 17: Data Table on Global Market: Year-over-year growth 2023-2028 (%)

    4 Historic Market Size

    • 4.1 Global isostearic acid market 2018 - 2022
      • Exhibit 18: Historic Market Size – Data Table on global isostearic acid market 2018 - 2022 ($ million)
    • 4.2 Application Segment Analysis 2018 - 2022
      • Exhibit 19: Historic Market Size – Application Segment 2018 - 2022 ($ million)
    • 4.3 End-user Segment Analysis 2018 - 2022
      • Exhibit 20: Historic Market Size – End-user Segment 2018 - 2022 ($ million)
    • 4.4 Geography Segment Analysis 2018 - 2022
      • Exhibit 21: Historic Market Size – Geography Segment 2018 - 2022 ($ million)
    • 4.5 Country Segment Analysis 2018 - 2022
      • Exhibit 22: Historic Market Size – Country Segment 2018 - 2022 ($ million)

    5 Five Forces Analysis

    • 5.1 Five forces summary
      • Exhibit 23: Five forces analysis - Comparison between 2023 and 2028
    • 5.2 Bargaining power of buyers
      • Exhibit 24: Chart on Bargaining power of buyers – Impact of key factors 2023 and 2028
    • 5.3 Bargaining power of suppliers
      • Exhibit 25: Bargaining power of suppliers – Impact of key factors in 2023 and 2028
    • 5.4 Threat of new entrants
      • Exhibit 26: Threat of new entrants – Impact of key factors in 2023 and 2028
    • 5.5 Threat of substitutes
      • Exhibit 27: Threat of substitutes – Impact of key factors in 2023 and 2028
    • 5.6 Threat of rivalry
      • Exhibit 28: Threat of rivalry – Impact of key factors in 2023 and 2028
    • 5.7 Market condition
      • Exhibit 29: Chart on Market condition - Five forces 2023 and 2028

    6 Market Segmentation by Application

    • 6.1 Market segments
      • Exhibit 30: Chart on Application - Market share 2023-2028 (%)
      • Exhibit 31: Data Table on Application - Market share 2023-2028 (%)
    • 6.2 Comparison by Application
      • Exhibit 32: Chart on Comparison by Application
      • Exhibit 33: Data Table on Comparison by Application
    • 6.3 Chemical esters - Market size and forecast 2023-2028
      • Exhibit 34: Chart on Chemical esters - Market size and forecast 2023-2028 ($ million)
      • Exhibit 35: Data Table on Chemical esters - Market size and forecast 2023-2028 ($ million)
      • Exhibit 36: Chart on Chemical esters - Year-over-year growth 2023-2028 (%)
      • Exhibit 37: Data Table on Chemical esters - Year-over-year growth 2023-2028 (%)
    • 6.4 Cosmetics - Market size and forecast 2023-2028
      • Exhibit 38: Chart on Cosmetics - Market size and forecast 2023-2028 ($ million)
      • Exhibit 39: Data Table on Cosmetics - Market size and forecast 2023-2028 ($ million)
      • Exhibit 40: Chart on Cosmetics - Year-over-year growth 2023-2028 (%)
      • Exhibit 41: Data Table on Cosmetics - Year-over-year growth 2023-2028 (%)
    • 6.5 Lubricants and grease - Market size and forecast 2023-2028
      • Exhibit 42: Chart on Lubricants and grease - Market size and forecast 2023-2028 ($ million)
      • Exhibit 43: Data Table on Lubricants and grease - Market size and forecast 2023-2028 ($ million)
      • Exhibit 44: Chart on Lubricants and grease - Year-over-year growth 2023-2028 (%)
      • Exhibit 45: Data Table on Lubricants and grease - Year-over-year growth 2023-2028 (%)
    • 6.6 Others - Market size and forecast 2023-2028
      • Exhibit 46: Chart on Others - Market size and forecast 2023-2028 ($ million)
      • Exhibit 47: Data Table on Others - Market size and forecast 2023-2028 ($ million)
      • Exhibit 48: Chart on Others - Year-over-year growth 2023-2028 (%)
      • Exhibit 49: Data Table on Others - Year-over-year growth 2023-2028 (%)
    • 6.7 Market opportunity by Application
      • Exhibit 50: Market opportunity by Application ($ million)
      • Exhibit 51: Data Table on Market opportunity by Application ($ million)

    7 Market Segmentation by End-user

    • 7.1 Market segments
      • Exhibit 52: Chart on End-user - Market share 2023-2028 (%)
      • Exhibit 53: Data Table on End-user - Market share 2023-2028 (%)
    • 7.2 Comparison by End-user
      • Exhibit 54: Chart on Comparison by End-user
      • Exhibit 55: Data Table on Comparison by End-user
    • 7.3 Personal care - Market size and forecast 2023-2028
      • Exhibit 56: Chart on Personal care - Market size and forecast 2023-2028 ($ million)
      • Exhibit 57: Data Table on Personal care - Market size and forecast 2023-2028 ($ million)
      • Exhibit 58: Chart on Personal care - Year-over-year growth 2023-2028 (%)
      • Exhibit 59: Data Table on Personal care - Year-over-year growth 2023-2028 (%)
    • 7.4 Home care - Market size and forecast 2023-2028
      • Exhibit 60: Chart on Home care - Market size and forecast 2023-2028 ($ million)
      • Exhibit 61: Data Table on Home care - Market size and forecast 2023-2028 ($ million)
      • Exhibit 62: Chart on Home care - Year-over-year growth 2023-2028 (%)
      • Exhibit 63: Data Table on Home care - Year-over-year growth 2023-2028 (%)
    • 7.5 Food and beverages - Market size and forecast 2023-2028
      • Exhibit 64: Chart on Food and beverages - Market size and forecast 2023-2028 ($ million)
      • Exhibit 65: Data Table on Food and beverages - Market size and forecast 2023-2028 ($ million)
      • Exhibit 66: Chart on Food and beverages - Year-over-year growth 2023-2028 (%)
      • Exhibit 67: Data Table on Food and beverages - Year-over-year growth 2023-2028 (%)
    • 7.6 Others - Market size and forecast 2023-2028
      • Exhibit 68: Chart on Others - Market size and forecast 2023-2028 ($ million)
      • Exhibit 69: Data Table on Others - Market size and forecast 2023-2028 ($ million)
      • Exhibit 70: Chart on Others - Year-over-year growth 2023-2028 (%)
      • Exhibit 71: Data Table on Others - Year-over-year growth 2023-2028 (%)
    • 7.7 Market opportunity by End-user
      • Exhibit 72: Market opportunity by End-user ($ million)
      • Exhibit 73: Data Table on Market opportunity by End-user ($ million)

    8 Customer Landscape

    • 8.1 Customer landscape overview
      • Exhibit 74: Analysis of price sensitivity, lifecycle, customer purchase basket, adoption rates, and purchase criteria

    9 Geographic Landscape

    • 9.1 Geographic segmentation
      • Exhibit 75: Chart on Market share by geography 2023-2028 (%)
      • Exhibit 76: Data Table on Market share by geography 2023-2028 (%)
    • 9.2 Geographic comparison
      • Exhibit 77: Chart on Geographic comparison
      • Exhibit 78: Data Table on Geographic comparison
    • 9.3 Europe - Market size and forecast 2023-2028
      • Exhibit 79: Chart on Europe - Market size and forecast 2023-2028 ($ million)
      • Exhibit 80: Data Table on Europe - Market size and forecast 2023-2028 ($ million)
      • Exhibit 81: Chart on Europe - Year-over-year growth 2023-2028 (%)
      • Exhibit 82: Data Table on Europe - Year-over-year growth 2023-2028 (%)
    • 9.4 APAC - Market size and forecast 2023-2028
      • Exhibit 83: Chart on APAC - Market size and forecast 2023-2028 ($ million)
      • Exhibit 84: Data Table on APAC - Market size and forecast 2023-2028 ($ million)
      • Exhibit 85: Chart on APAC - Year-over-year growth 2023-2028 (%)
      • Exhibit 86: Data Table on APAC - Year-over-year growth 2023-2028 (%)
    • 9.5 North America - Market size and forecast 2023-2028
      • Exhibit 87: Chart on North America - Market size and forecast 2023-2028 ($ million)
      • Exhibit 88: Data Table on North America - Market size and forecast 2023-2028 ($ million)
      • Exhibit 89: Chart on North America - Year-over-year growth 2023-2028 (%)
      • Exhibit 90: Data Table on North America - Year-over-year growth 2023-2028 (%)
    • 9.6 Middle East and Africa - Market size and forecast 2023-2028
      • Exhibit 91: Chart on Middle East and Africa - Market size and forecast 2023-2028 ($ million)
      • Exhibit 92: Data Table on Middle East and Africa - Market size and forecast 2023-2028 ($ million)
      • Exhibit 93: Chart on Middle East and Africa - Year-over-year growth 2023-2028 (%)
      • Exhibit 94: Data Table on Middle East and Africa - Year-over-year growth 2023-2028 (%)
    • 9.7 South America - Market size and forecast 2023-2028
      • Exhibit 95: Chart on South America - Market size and forecast 2023-2028 ($ million)
      • Exhibit 96: Data Table on South America - Market size and forecast 2023-2028 ($ million)
      • Exhibit 97: Chart on South America - Year-over-year growth 2023-2028 (%)
      • Exhibit 98: Data Table on South America - Year-over-year growth 2023-2028 (%)
    • 9.8 China - Market size and forecast 2023-2028
      • Exhibit 99: Chart on China - Market size and forecast 2023-2028 ($ million)
      • Exhibit 100: Data Table on China - Market size and forecast 2023-2028 ($ million)
      • Exhibit 101: Chart on China - Year-over-year growth 2023-2028 (%)
      • Exhibit 102: Data Table on China - Year-over-year growth 2023-2028 (%)
    • 9.9 Germany - Market size and forecast 2023-2028
      • Exhibit 103: Chart on Germany - Market size and forecast 2023-2028 ($ million)
      • Exhibit 104: Data Table on Germany - Market size and forecast 2023-2028 ($ million)
      • Exhibit 105: Chart on Germany - Year-over-year growth 2023-2028 (%)
      • Exhibit 106: Data Table on Germany - Year-over-year growth 2023-2028 (%)
    • 9.10 UK - Market size and forecast 2023-2028
      • Exhibit 107: Chart on UK - Market size and forecast 2023-2028 ($ million)
      • Exhibit 108: Data Table on UK - Market size and forecast 2023-2028 ($ million)
      • Exhibit 109: Chart on UK - Year-over-year growth 2023-2028 (%)
      • Exhibit 110: Data Table on UK - Year-over-year growth 2023-2028 (%)
    • 9.11 Japan - Market size and forecast 2023-2028
      • Exhibit 111: Chart on Japan - Market size and forecast 2023-2028 ($ million)
      • Exhibit 112: Data Table on Japan - Market size and forecast 2023-2028 ($ million)
      • Exhibit 113: Chart on Japan - Year-over-year growth 2023-2028 (%)
      • Exhibit 114: Data Table on Japan - Year-over-year growth 2023-2028 (%)
    • 9.12 US - Market size and forecast 2023-2028
      • Exhibit 115: Chart on US - Market size and forecast 2023-2028 ($ million)
      • Exhibit 116: Data Table on US - Market size and forecast 2023-2028 ($ million)
      • Exhibit 117: Chart on US - Year-over-year growth 2023-2028 (%)
      • Exhibit 118: Data Table on US - Year-over-year growth 2023-2028 (%)
    • 9.13 Market opportunity by geography
      • Exhibit 119: Market opportunity by geography ($ million)
      • Exhibit 120: Data Tables on Market opportunity by geography ($ million)

    10 Drivers, Challenges, and Trends

    • 10.1 Market drivers
      • 10.2 Market challenges
        • 10.3 Impact of drivers and challenges
          • Exhibit 121: Impact of drivers and challenges in 2023 and 2028
        • 10.4 Market trends

          11 Vendor Landscape

          • 11.1 Overview
            • 11.2 Vendor landscape
              • Exhibit 122: Overview on Criticality of inputs and Factors of differentiation
            • 11.3 Landscape disruption
              • Exhibit 123: Overview on factors of disruption
            • 11.4 Industry risks
              • Exhibit 124: Impact of key risks on business

            12 Vendor Analysis

            • 12.1 Vendors covered
              • Exhibit 125: Vendors covered
            • 12.2 Market positioning of vendors
              • Exhibit 126: Matrix on vendor position and classification
            • 12.3 ATAMAN Kimya AS
              • Exhibit 127: ATAMAN Kimya AS - Overview
              • Exhibit 128: ATAMAN Kimya AS - Product / Service
              • Exhibit 129: ATAMAN Kimya AS - Key offerings
            • 12.4 AVRIL SCA
              • Exhibit 130: AVRIL SCA - Overview
              • Exhibit 131: AVRIL SCA - Product / Service
              • Exhibit 132: AVRIL SCA - Key offerings
            • 12.5 Croda International Plc
              • Exhibit 133: Croda International Plc - Overview
              • Exhibit 134: Croda International Plc - Business segments
              • Exhibit 135: Croda International Plc - Key news
              • Exhibit 136: Croda International Plc - Key offerings
              • Exhibit 137: Croda International Plc - Segment focus
            • 12.6 DL Chemical
              • Exhibit 138: DL Chemical - Overview
              • Exhibit 139: DL Chemical - Product / Service
              • Exhibit 140: DL Chemical - Key offerings
            • 12.7 Emery Oleochemicals Group
              • Exhibit 141: Emery Oleochemicals Group - Overview
              • Exhibit 142: Emery Oleochemicals Group - Product / Service
              • Exhibit 143: Emery Oleochemicals Group - Key news
              • Exhibit 144: Emery Oleochemicals Group - Key offerings
            • 12.8 Kao Corp.
              • Exhibit 145: Kao Corp. - Overview
              • Exhibit 146: Kao Corp. - Business segments
              • Exhibit 147: Kao Corp. - Key offerings
              • Exhibit 148: Kao Corp. - Segment focus
            • 12.9 Kuala Lumpur Kepong Berhad
              • Exhibit 149: Kuala Lumpur Kepong Berhad - Overview
              • Exhibit 150: Kuala Lumpur Kepong Berhad - Business segments
              • Exhibit 151: Kuala Lumpur Kepong Berhad - Key offerings
              • Exhibit 152: Kuala Lumpur Kepong Berhad - Segment focus
            • 12.10 Merck KGaA
              • Exhibit 153: Merck KGaA - Overview
              • Exhibit 154: Merck KGaA - Business segments
              • Exhibit 155: Merck KGaA - Key news
              • Exhibit 156: Merck KGaA - Key offerings
              • Exhibit 157: Merck KGaA - Segment focus
            • 12.11 Nippon Fine Chemical Co. Ltd.
              • Exhibit 158: Nippon Fine Chemical Co. Ltd. - Overview
              • Exhibit 159: Nippon Fine Chemical Co. Ltd. - Business segments
              • Exhibit 160: Nippon Fine Chemical Co. Ltd. - Key offerings
              • Exhibit 161: Nippon Fine Chemical Co. Ltd. - Segment focus
            • 12.12 Nissan Chemical Corp.
              • Exhibit 162: Nissan Chemical Corp. - Overview
              • Exhibit 163: Nissan Chemical Corp. - Business segments
              • Exhibit 164: Nissan Chemical Corp. - Key offerings
              • Exhibit 165: Nissan Chemical Corp. - Segment focus
            • 12.13 Santa Cruz Biotechnology Inc.
              • Exhibit 166: Santa Cruz Biotechnology Inc. - Overview
              • Exhibit 167: Santa Cruz Biotechnology Inc. - Product / Service
              • Exhibit 168: Santa Cruz Biotechnology Inc. - Key offerings
            • 12.14 SpecialChem S.A.
              • Exhibit 169: SpecialChem S.A. - Overview
              • Exhibit 170: SpecialChem S.A. - Product / Service
              • Exhibit 171: SpecialChem S.A. - Key offerings
            • 12.15 The Procter and Gamble Co.
              • Exhibit 172: The Procter and Gamble Co. - Overview
              • Exhibit 173: The Procter and Gamble Co. - Business segments
              • Exhibit 174: The Procter and Gamble Co. - Key news
              • Exhibit 175: The Procter and Gamble Co. - Key offerings
              • Exhibit 176: The Procter and Gamble Co. - Segment focus
            • 12.16 Thermo Fisher Scientific Inc.
              • Exhibit 177: Thermo Fisher Scientific Inc. - Overview
              • Exhibit 178: Thermo Fisher Scientific Inc. - Business segments
              • Exhibit 179: Thermo Fisher Scientific Inc. - Key news
              • Exhibit 180: Thermo Fisher Scientific Inc. - Key offerings
              • Exhibit 181: Thermo Fisher Scientific Inc. - Segment focus
            • 12.17 Tokyo Chemical Industry Co. Ltd.
              • Exhibit 182: Tokyo Chemical Industry Co. Ltd. - Overview
              • Exhibit 183: Tokyo Chemical Industry Co. Ltd. - Product / Service
              • Exhibit 184: Tokyo Chemical Industry Co. Ltd. - Key offerings

            13 Appendix

            • 13.1 Scope of the report
              • 13.2 Inclusions and exclusions checklist
                • Exhibit 185: Inclusions checklist
                • Exhibit 186: Exclusions checklist
              • 13.3 Currency conversion rates for US$
                • Exhibit 187: Currency conversion rates for US$
              • 13.4 Research methodology
                • Exhibit 188: Research methodology
                • Exhibit 189: Validation techniques employed for market sizing
                • Exhibit 190: Information sources
              • 13.5 List of abbreviations
                • Exhibit 191: List of abbreviations

              Research Methodology

              Technavio presents a detailed picture of the market by way of study, synthesis, and summation of data from multiple sources. The analysts have presented the various facets of the market with a particular focus on identifying the key industry influencers. The data thus presented is comprehensive, reliable, and the result of extensive research, both primary and secondary.

              INFORMATION SOURCES

              Primary sources

              • Manufacturers and suppliers
              • Channel partners
              • Industry experts
              • Strategic decision makers

              Secondary sources

              • Industry journals and periodicals
              • Government data
              • Financial reports of key industry players
              • Historical data
              • Press releases

              DATA ANALYSIS

              Data Synthesis

              • Collation of data
              • Estimation of key figures
              • Analysis of derived insights

              Data Validation

              • Triangulation with data models
              • Reference against proprietary databases
              • Corroboration with industry experts

              REPORT WRITING

              Qualitative

              • Market drivers
              • Market challenges
              • Market trends
              • Five forces analysis

              Quantitative

              • Market size and forecast
              • Market segmentation
              • Geographical insights
              • Competitive landscape

              Interested in this report?

              Get your sample now to see our research methodology and insights!

              Download Now

              Frequently Asked Questions

              Isostearic Acid market growth will increase by $ 120.28 mn during 2024-2028.

              The Isostearic Acid market is expected to grow at a CAGR of 7.06% during 2024-2028.

              Isostearic Acid market is segmented by Application( Chemical esters, Cosmetics, Lubricants and grease, Others) End-user( Personal care, Home care, Food and beverages, Others)

              ATAMAN Kimya AS, AVRIL SCA, BASF SE, CREMER OLEO GmbH and Co. KG, Croda International Plc, DL Chemical, Emery Oleochemicals Group, Kokyu Alcohol Kogyo Co. Ltd., Kuala Lumpur Kepong Berhad, Merck KGaA, Nippon Fine Chemical Co. Ltd., Nissan Chemical Corp., Santa Cruz Biotechnology Inc., SpecialChem S.A., SysKem Chemie GmbH, The Procter and Gamble Co., Thermo Fisher Scientific Inc., Tokyo Chemical Industry Co. Ltd., Vantage Specialty Chemicals, Kao Corp. are a few of the key vendors in the Isostearic Acid market.

              Europe will register the highest growth rate of 34% among the other regions. Therefore, the Isostearic Acid market in Europe is expected to garner significant business opportunities for the vendors during the forecast period.

              US, China, Japan, Germany, UK

              • Increasing use of isostearic acid in cosmetics and personal care productsThe cosmetics and personal care industry has witnessed steady growth is the driving factor this market.
              • with consumers increasingly focused on appearance is the driving factor this market.
              • hygiene is the driving factor this market.
              • and skincare. This has boosted the demand for ingredients like isostearic acid that are used in a wide range of products is the driving factor this market.
              • including lipsticks is the driving factor this market.
              • foundations is the driving factor this market.
              • moisturizers is the driving factor this market.
              • and sunscreens. Isostearic acid is valued for its versatility. It can serve multiple functions in cosmetics is the driving factor this market.
              • such as acting as an emollient is the driving factor this market.
              • stabilizing agent is the driving factor this market.
              • and thickener. This flexibility in formulations has made it a popular choice for cosmetic product developers. Isostearic acid is known to improve the texture is the driving factor this market.
              • spreadability is the driving factor this market.
              • and stability of cosmetic products. It can help products maintain their quality and consistency is the driving factor this market.
              • leading to enhanced performance and a better user experience. Moreover is the driving factor this market.
              • in color cosmetics like lipsticks and eyeshadows is the driving factor this market.
              • isostearic acid can aid in color retention is the driving factor this market.
              • ensuring that pigments and dyes remain vibrant and long-lasting. The demand for natural and organic cosmetics has been growing. Isostearic acid is the driving factor this market.
              • when sourced from natural and organic materials is the driving factor this market.
              • fits well with this trend and is used in formulations that cater to eco-conscious consumers. Thus is the driving factor this market.
              • the increasing use of isostearic acid in cosmetics and personal care products has made it a vital ingredient in cosmetic and personal care products is the driving factor this market.
              • which will boost the growth of the global isostearic acid market during the forecast period. is the driving factor this market.

              The Isostearic Acid market vendors should focus on grabbing business opportunities from the Chemical esters segment as it accounted for the largest market share in the base year.
              RIA - Research AI Assistant
              Ask RIA