Southeast Asia IT Spending Market Size 2025-2029
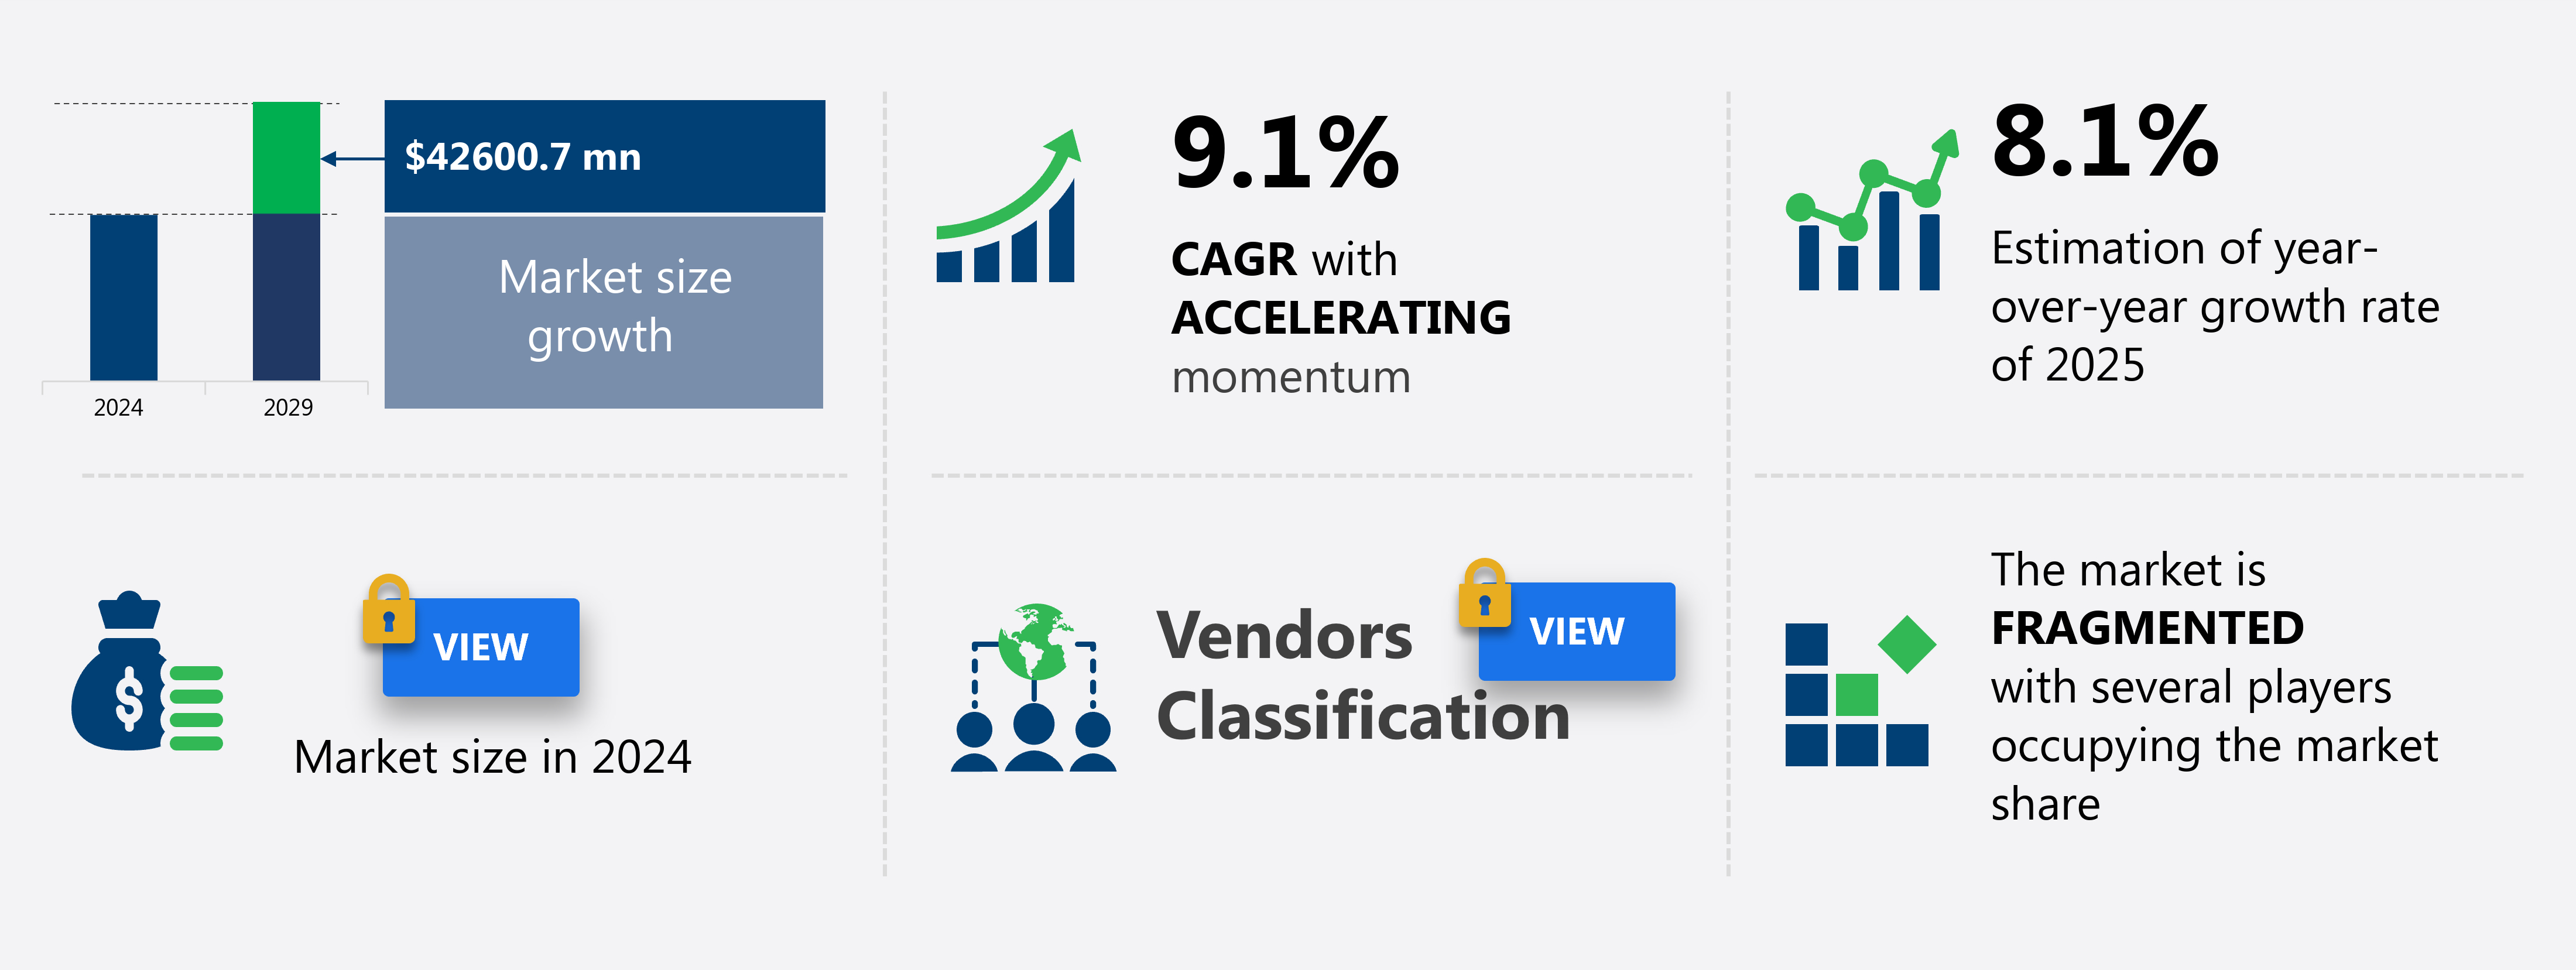
The Southeast Asia IT spending market size is forecast to increase by USD 42.6 billion at a CAGR of 9.1% between 2024 and 2029.
- The IT spending market is experiencing significant growth, driven by several key trends. One of the most notable trends is the increased adoption of mobility solutions in Southeast Asia, as businesses seek to enhance productivity and flexibility. Another trend is the growth of big data and analytics services, as organizations look to gain insights from their data to make informed business decisions. However, the market also faces challenges, such as the lack of skilled talent and the retention of a talented workforce. These issues can hinder market growth and require businesses to invest in training and development programs to address the skills gap.
What will be the Size of the market During the Forecast Period?

Request Free Sample
- The market continues to evolve, driven by digital transformation initiatives and the adoption of emerging technologies such as artificial intelligence (AI) and blockchain. Small and Medium-sized Enterprises (SMEs) are increasingly investing in IT services to enhance their competitiveness and improve operational efficiency. Cybersecurity services remain a priority due to the proliferation of data and the growing threat landscape. The financial sector, in particular, is investing heavily in IT services to comply with regulatory requirements and leverage IT talent for data synthesis and summation. Hardware, services, software, IoT solutions, and IT spending players are responding to diverse data points and enterprise demands for data comprehensiveness and dependability. The market is expected to grow significantly, fueled by the increasing importance of IT in business operations and the ongoing integration of emerging technologies.
How is this market segmented and which is the largest segment?
The market research report provides comprehensive data (region-wise segment analysis), with forecasts and estimates in "USD billion" for the period 2025-2029, as well as historical data from 2019-2023 for the following segments.
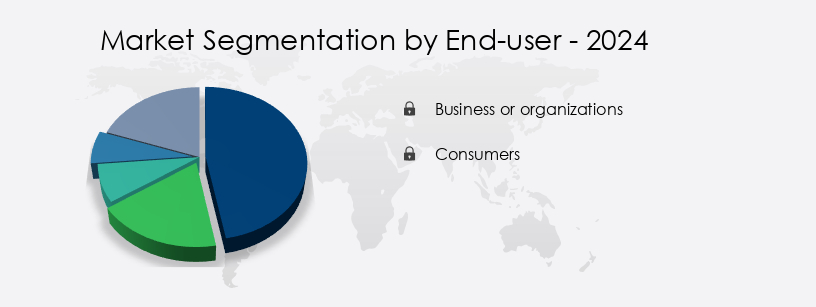
- End-user
- Business or organizations
- Consumers
- Type
- Hardware
- Services
- Software
- Application
- BFSI
- IT and telecom
- Healthcare
- Retail and e-commerce
- Others
- Sector
- Geography
- Southeast Asia
- Singapore
- Malaysia
- Thailand
- Indonesia
- Rest of Southeast Asia
By End-user Insights
- The business or organizations segment is estimated to witness significant growth during the forecast period.
The market is primarily driven by the business sector, encompassing a wide array of entities, including SMEs and large corporations, spanning industries such as healthcare, finance, and retail. A significant factor fueling IT spending within this segment is the ongoing digital transformation, which involves the adoption of advanced technologies to boost operational efficiency, automate processes, and enhance customer engagement. This transition necessitates substantial investments in IT infrastructure, cloud computing, and advanced analytics. Furthermore, cybersecurity concerns have emerged as a critical issue, prompting businesses to allocate more resources toward securing their digital assets and ensuring regulatory compliance. Emerging technologies, including artificial intelligence, blockchain, mobility solutions, and IoT, are also gaining traction, further accelerating market growth.
IT associations and research firms project continued growth in IT spending across various sectors, driven by the proliferation of data, increasing internet users, and the adoption of telecommunication services. company selection methodologies, comprehensive research, and quantitative data analysis are essential for enterprises seeking to make informed technology spending decisions.

Get a glance at the market report of share of various segments Request Free Sample
Market Dynamics
Our market researchers analyzed the data with 2024 as the base year, along with the key drivers, trends, and challenges. A holistic analysis of drivers will help companies refine their marketing strategies to gain a competitive advantage.
What are the key market drivers leading to the rise in the adoption of Southeast Asia It Spending Market?
Increased adoption of mobility solutions in Southeast Asia is the key driver of the market.
- The market plays a pivotal role in facilitating digital transformation across various sectors, including SMEs, financial services, tourism, and hospitality. Emerging technologies, such as artificial intelligence and blockchain, are driving IT spending In these industries. Cybersecurity services are also in high demand due to the increasing threat of cyber attacks. Technology spending on hardware, services, and software is projected to grow significantly In the coming years. B2G, B2B, and B2C enterprises are leveraging IT services for their diverse needs. Outsourcing services, mobility solutions, and IoT solutions are popular choices for enterprises seeking to optimize their operations and enhance customer experience.
- IT associations conduct quantitative and qualitative research to provide dependable and thorough company selection methodologies. The proliferation of data necessitates the need for synthesis and summation tools to make data comprehensiveness a reality. The financial sector, in particular, is investing heavily in IT services to ensure data security and profitability. The tourism and hospitality sectors are also adopting IT services to improve customer engagement and streamline operations. The market facets of IT services are constantly evolving, with mobility and cybersecurity being key areas of focus. Market dynamics, such as the increasing number of internet users and advancements in telecommunication, are accelerating the market's growth.
What are the market trends shaping the Southeast Asia IT Spending Market?
The growth of big data and analytics services is the upcoming trend In the market.
- The market is experiencing significant growth due to the digital transformation sweeping across various industries. Companies are investing in emerging technologies such as artificial intelligence, blockchain, and cybersecurity services to gain a competitive edge. Small and Medium Enterprises (SMEs) are also increasing their technology spending on mobility solutions and the Internet of Things (IoT) to enhance their operations. The financial sector, tourism, and hospitality industries are major contributors to this market, with the need to secure and analyze vast amounts of data. The proliferation of data from mobile devices and the internet has led to a rise in demand for IT talent and comprehensive research.
- company selection methodology is a crucial aspect of IT spending for enterprises, with a focus on data comprehensiveness, dependability, and thoroughness of research. Analytics is a key trend, with predictive analytics helping industries like telecommunications, B2G, B2B, and B2C to gain insights from unstructured data. The market facets include hardware, services, and software, with a synthesis of data through quantitative and qualitative research driving profit and promotions. The market is accelerating, with a focus on mobility solutions, IoT, and cybersecurity services. IT associations play a vital role In the market by providing valuable insights and market intelligence.
What challenges does Southeast Asia It Spending Market face during the growth?
Lack of skilled talent and retention of the talent pool is a key challenge affecting market growth.
- The market faces significant challenges in acquiring and retaining skilled talent, a critical factor for businesses undergoing digital transformation and implementing emerging technologies. Globalization has disrupted talent pipelines, leading to high levels of attrition and potential loss of key competencies. Companies are feeling the pressure to maintain their competitive edge, especially during times of strategic divestitures. Retaining IT talent in outsourcing destinations, such as Malaysia and other Southeast Asian countries, is a formidable task. This challenge could hinder the growth and success of IT spending players In the region.
- Ensuring the dependability and thoroughness of comprehensive research on market facets, including cybersecurity services, the financial sector, artificial intelligence, blockchain, mobility solutions, and IoT solutions, is crucial for enterprises in various industries, such as tourism and hospitality, B2G, B2B, and B2C. Company selection methodology, quantitative and qualitative research, and data comprehensiveness are essential elements of this research to inform strategic technology spending decisions. The IT associations play a vital role in addressing the talent crunch by promoting promotions, market facets, and the synthesis of diverse data points. The market is accelerating, and the market dynamics necessitate a focus on talent acquisition and retention to drive profitability and growth.
Exclusive Customer Landscape
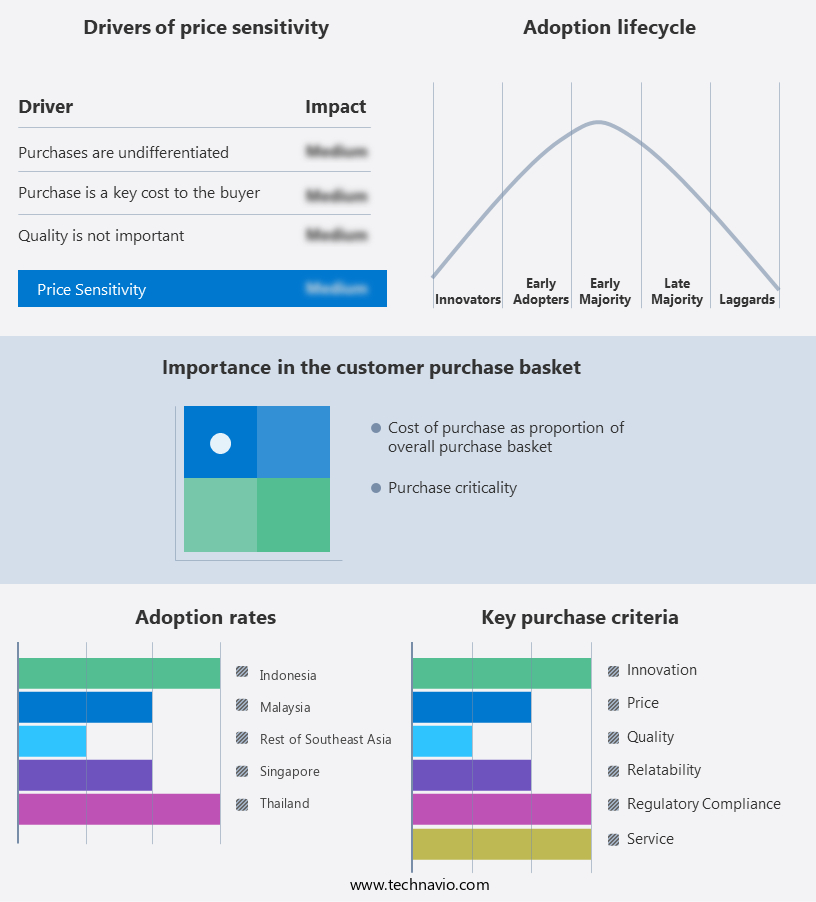
The market forecasting report includes the adoption lifecycle of the market, covering from the innovator's stage to the laggard's stage. It focuses on adoption rates in different regions based on penetration. Furthermore, the market report also includes key purchase criteria and drivers of price sensitivity to help companies evaluate and develop their market growth analysis strategies.

Customer Landscape
Key Companies & Market Insights
Companies are implementing various strategies, such as strategic alliances, market forecast, partnerships, mergers and acquisitions, geographical expansion, and product/service launches, to enhance their presence In the market.
Accenture PLC - The company specializes in IT consulting services, providing expertise in Digital Transformation Consultation and Technology Advisory to help clients make informed technology investment decisions and optimize their IT spending.
The market research and growth report includes detailed analyses of the competitive landscape of the market and information about key companies, including:
- Accenture PLC
- Acer Inc.
- Alphabet Inc.
- Apple Inc.
- ASUSTeK Computer Inc.
- Broadcom Inc.
- Capgemini Services SAS
- Cisco Systems Inc.
- Cognizant Technology Solutions Corp.
- Dell Technologies Inc.
- HCL Technologies Ltd.
- Hewlett Packard Enterprise Co.
- Infosys Ltd.
- International Business Machines Corp.
- Lenovo Group Ltd.
- Microsoft Corp.
- Oracle Corp.
- Samsung Electronics Co. Ltd.
- SAP SE
- Tata Consultancy Services Ltd.
Qualitative and quantitative analysis of companies has been conducted to help clients understand the wider business environment as well as the strengths and weaknesses of key market players. Data is qualitatively analyzed to categorize companies as pure play, category-focused, industry-focused, and diversified; it is quantitatively analyzed to categorize companies as dominant, leading, strong, tentative, and weak.
Research Analyst Overview
The market continues to experience dynamic growth, driven by the increasing adoption of digital transformation across various industries. Emerging technologies, such as artificial intelligence (AI) and blockchain, are revolutionizing business processes and creating new opportunities for IT service providers. Small and Medium Enterprises (SMEs) are also increasingly recognizing the value of IT services, particularly In the areas of cybersecurity and IT talent. The financial sector is a significant contributor to IT services spending, with the need to ensure data security and compliance with regulatory requirements driving demand for IT services. The tourism and hospitality sectors are also investing heavily in IT services to enhance customer experiences and improve operational efficiency.
Moreover, the proliferation of mobile devices and the Internet of Things (IoT) is leading to an increase in technology spending across sectors. The rise of IoT solutions is transforming the tourism and hospitality sectors, with both B2G enterprises and B2B enterprises leveraging technology to enhance customer experiences and streamline operations. Outsourcing services have become an essential component of IT spending, with enterprises seeking to reduce costs and focus on core competencies. IT associations play a crucial role in facilitating company selection methodologies and promoting best practices In the industry. The IT services market is characterized by its diversity and the comprehensive research required to gain a thorough understanding of market dynamics.
Furthermore, Quantitative research provides valuable insights into market size and growth trends, while qualitative research offers in-depth analysis of customer needs and preferences. The accelerating market for mobility solutions and IoT services is driving innovation and competition among IT services players. Enterprises are seeking dependable and thorough research to make informed decisions about technology investments and partnerships. The market is a complex and dynamic landscape, with diverse data points and multiple market facets. Synthesizing and summing up this data requires a comprehensive research approach that considers both the quantitative and qualitative aspects of the market. IT services spending is a critical driver of economic growth, with significant implications for GDP and employment.
|
Market Scope
|
|
Report Coverage
|
Details
|
|
Page number
|
225
|
|
Base year
|
2024
|
|
Historic period
|
2019-2023 |
|
Forecast period
|
2025-2029
|
|
Growth momentum & CAGR
|
Accelerate at a CAGR of 9.1%
|
|
Market Growth 2025-2029
|
USD 42.60 billion
|
|
Market structure
|
Fragmented
|
|
YoY growth 2024-2025(%)
|
8.1
|
|
Key countries
|
Malaysia, Singapore, Thailand, Indonesia, and Rest of Southeast Asia
|
|
Competitive landscape
|
Leading Companies, Market Positioning of Companies, Competitive Strategies, and Industry Risks
|
Request Free Sample
What are the Key Data Covered in this Market Research and Growth Report?
- CAGR of the market during the forecast period
- Detailed information on factors that will drive the market growth and forecasting between 2025 and 2029
- Precise estimation of the size of the market and its contribution of the market in focus to the parent market
- Accurate predictions about upcoming market growth and trends and changes in consumer behaviour
- Growth of the market across Southeast Asia
- Thorough analysis of the market's competitive landscape and detailed information about companies
- Comprehensive analysis of factors that will challenge the growth of market companies
We can help! Our analysts can customize this market research report to meet your requirements. Get in touch
1 Executive Summary
- 1.1 Market overview
- Executive Summary - Chart on Market Overview
- Executive Summary - Data Table on Market Overview
- Executive Summary - Chart on Country Market Characteristics
- Executive Summary - Chart on Market by Geography
- Executive Summary - Chart on Market Segmentation by End-user
- Executive Summary - Chart on Market Segmentation by Type
- Executive Summary - Chart on Market Segmentation by Application
- Executive Summary - Chart on Market Segmentation by Sector
- Executive Summary - Chart on Incremental Growth
- Executive Summary - Data Table on Incremental Growth
- Executive Summary - Chart on Company Market Positioning
2 Technavio Analysis
- 2.1 Analysis of price sensitivity, lifecycle, customer purchase basket, adoption rates, and purchase criteria
- Analysis of price sensitivity, lifecycle, customer purchase basket, adoption rates, and purchase criteria
- 2.2 Criticality of inputs and Factors of differentiation
- Overview on criticality of inputs and factors of differentiation
- 2.3 Factors of disruption
- Overview on factors of disruption
- 2.4 Impact of drivers and challenges
- Impact of drivers and challenges in 2024 and 2029
3 Market Landscape
- 3.1 Market ecosystem
- Parent Market
- Data Table on - Parent Market
- 3.2 Market characteristics
- Market characteristics analysis
4 Market Sizing
- 4.1 Market definition
- Offerings of companies included in the market definition
- 4.2 Market segment analysis
- 4.4 Market outlook: Forecast for 2024-2029
- Chart on Southeast Asia - Market size and forecast 2024-2029 ($ million)
- Data Table on Regional - Market size and forecast 2024-2029 ($ million)
- Chart on Southeast Asia: Year-over-year growth 2024-2029 (%)
- Data Table on Regional - Market size and forecast 2024-2029 ($ million)
5 Historic Market Size
- 5.1 IT Spending Market in Southeast Asia 2019 - 2023
- Historic Market Size - Data Table on IT Spending Market in Southeast Asia 2019 - 2023 ($ million)
- 5.2 End-user segment analysis 2019 - 2023
- Historic Market Size - End-user Segment 2019 - 2023 ($ million)
- 5.3 Type segment analysis 2019 - 2023
- Historic Market Size - Type Segment 2019 - 2023 ($ million)
- 5.4 Application segment analysis 2019 - 2023
- Historic Market Size - Application Segment 2019 - 2023 ($ million)
- 5.5 Sector segment analysis 2019 - 2023
- Historic Market Size - Sector Segment 2019 - 2023 ($ million)
- 5.6 Geography segment analysis 2019 - 2023
- Historic Market Size - Geography Segment 2019 - 2023 ($ million)
6 Qualitative Analysis
- 6.1 Impact of AI on IT spending market in Southeast Asia
7 Five Forces Analysis
- 7.1 Five forces summary
- Five forces analysis - Comparison between 2024 and 2029
- 7.2 Bargaining power of buyers
- Bargaining power of buyers - Impact of key factors 2024 and 2029
- 7.3 Bargaining power of suppliers
- Bargaining power of suppliers - Impact of key factors in 2024 and 2029
- 7.4 Threat of new entrants
- Threat of new entrants - Impact of key factors in 2024 and 2029
- 7.5 Threat of substitutes
- Threat of substitutes - Impact of key factors in 2024 and 2029
- 7.6 Threat of rivalry
- Threat of rivalry - Impact of key factors in 2024 and 2029
- 7.7 Market condition
- Chart on Market condition - Five forces 2024 and 2029
8 Market Segmentation by End-user
- 8.1 Market segments
- Chart on End-user - Market share 2024-2029 (%)
- Data Table on End-user - Market share 2024-2029 (%)
- 8.2 Comparison by End-user
- Chart on Comparison by End-user
- Data Table on Comparison by End-user
- 8.3 Business or organizations - Market size and forecast 2024-2029
- Chart on Business or organizations - Market size and forecast 2024-2029 ($ million)
- Data Table on Business or organizations - Market size and forecast 2024-2029 ($ million)
- Chart on Business or organizations - Year-over-year growth 2024-2029 (%)
- Data Table on Business or organizations - Year-over-year growth 2024-2029 (%)
- 8.4 Consumers - Market size and forecast 2024-2029
- Chart on Consumers - Market size and forecast 2024-2029 ($ million)
- Data Table on Consumers - Market size and forecast 2024-2029 ($ million)
- Chart on Consumers - Year-over-year growth 2024-2029 (%)
- Data Table on Consumers - Year-over-year growth 2024-2029 (%)
- 8.5 Market opportunity by End-user
- Market opportunity by End-user ($ million)
- Data Table on Market opportunity by End-user ($ million)
9 Market Segmentation by Type
- 9.1 Market segments
- Chart on Type - Market share 2024-2029 (%)
- Data Table on Type - Market share 2024-2029 (%)
- 9.2 Comparison by Type
- Chart on Comparison by Type
- Data Table on Comparison by Type
- 9.3 Hardware - Market size and forecast 2024-2029
- Chart on Hardware - Market size and forecast 2024-2029 ($ million)
- Data Table on Hardware - Market size and forecast 2024-2029 ($ million)
- Chart on Hardware - Year-over-year growth 2024-2029 (%)
- Data Table on Hardware - Year-over-year growth 2024-2029 (%)
- 9.4 Services - Market size and forecast 2024-2029
- Chart on Services - Market size and forecast 2024-2029 ($ million)
- Data Table on Services - Market size and forecast 2024-2029 ($ million)
- Chart on Services - Year-over-year growth 2024-2029 (%)
- Data Table on Services - Year-over-year growth 2024-2029 (%)
- 9.5 Software - Market size and forecast 2024-2029
- Chart on Software - Market size and forecast 2024-2029 ($ million)
- Data Table on Software - Market size and forecast 2024-2029 ($ million)
- Chart on Software - Year-over-year growth 2024-2029 (%)
- Data Table on Software - Year-over-year growth 2024-2029 (%)
- 9.6 Market opportunity by Type
- Market opportunity by Type ($ million)
- Data Table on Market opportunity by Type ($ million)
10 Market Segmentation by Application
- 10.1 Market segments
- Chart on Application - Market share 2024-2029 (%)
- Data Table on Application - Market share 2024-2029 (%)
- 10.2 Comparison by Application
- Chart on Comparison by Application
- Data Table on Comparison by Application
- 10.3 BFSI - Market size and forecast 2024-2029
- Chart on BFSI - Market size and forecast 2024-2029 ($ million)
- Data Table on BFSI - Market size and forecast 2024-2029 ($ million)
- Chart on BFSI - Year-over-year growth 2024-2029 (%)
- Data Table on BFSI - Year-over-year growth 2024-2029 (%)
- 10.4 IT and telecom - Market size and forecast 2024-2029
- Chart on IT and telecom - Market size and forecast 2024-2029 ($ million)
- Data Table on IT and telecom - Market size and forecast 2024-2029 ($ million)
- Chart on IT and telecom - Year-over-year growth 2024-2029 (%)
- Data Table on IT and telecom - Year-over-year growth 2024-2029 (%)
- 10.5 Healthcare - Market size and forecast 2024-2029
- Chart on Healthcare - Market size and forecast 2024-2029 ($ million)
- Data Table on Healthcare - Market size and forecast 2024-2029 ($ million)
- Chart on Healthcare - Year-over-year growth 2024-2029 (%)
- Data Table on Healthcare - Year-over-year growth 2024-2029 (%)
- 10.6 Retail and e-commerce - Market size and forecast 2024-2029
- Chart on Retail and e-commerce - Market size and forecast 2024-2029 ($ million)
- Data Table on Retail and e-commerce - Market size and forecast 2024-2029 ($ million)
- Chart on Retail and e-commerce - Year-over-year growth 2024-2029 (%)
- Data Table on Retail and e-commerce - Year-over-year growth 2024-2029 (%)
- 10.7 Others - Market size and forecast 2024-2029
- Chart on Others - Market size and forecast 2024-2029 ($ million)
- Data Table on Others - Market size and forecast 2024-2029 ($ million)
- Chart on Others - Year-over-year growth 2024-2029 (%)
- Data Table on Others - Year-over-year growth 2024-2029 (%)
- 10.8 Market opportunity by Application
- Market opportunity by Application ($ million)
- Data Table on Market opportunity by Application ($ million)
11 Market Segmentation by Sector
- 11.1 Market segments
- Chart on Sector - Market share 2024-2029 (%)
- Data Table on Sector - Market share 2024-2029 (%)
- 11.2 Comparison by Sector
- Chart on Comparison by Sector
- Data Table on Comparison by Sector
- 11.3 Large enterprises - Market size and forecast 2024-2029
- Chart on Large enterprises - Market size and forecast 2024-2029 ($ million)
- Data Table on Large enterprises - Market size and forecast 2024-2029 ($ million)
- Chart on Large enterprises - Year-over-year growth 2024-2029 (%)
- Data Table on Large enterprises - Year-over-year growth 2024-2029 (%)
- 11.4 SMEs - Market size and forecast 2024-2029
- Chart on SMEs - Market size and forecast 2024-2029 ($ million)
- Data Table on SMEs - Market size and forecast 2024-2029 ($ million)
- Chart on SMEs - Year-over-year growth 2024-2029 (%)
- Data Table on SMEs - Year-over-year growth 2024-2029 (%)
- 11.5 Market opportunity by Sector
- Market opportunity by Sector ($ million)
- Data Table on Market opportunity by Sector ($ million)
12 Customer Landscape
- 12.1 Customer landscape overview
- Analysis of price sensitivity, lifecycle, customer purchase basket, adoption rates, and purchase criteria
13 Geographic Landscape
- 13.1 Geographic segmentation
- Chart on Market share by geography - 2024-2029 (%)
- Data Table on Market share by geography - 2024-2029 (%)
- 13.2 Geographic comparison
- Chart on Geographic comparison
- Data Table on Geographic comparison
- 13.3 Malaysia - Market size and forecast 2024-2029
- Chart on Malaysia - Market size and forecast 2024-2029 ($ million)
- Data Table on Malaysia - Market size and forecast 2024-2029 ($ million)
- Chart on Malaysia - Year-over-year growth 2024-2029 (%)
- Data Table on Malaysia - Year-over-year growth 2024-2029 (%)
- 13.4 Singapore - Market size and forecast 2024-2029
- Chart on Singapore - Market size and forecast 2024-2029 ($ million)
- Data Table on Singapore - Market size and forecast 2024-2029 ($ million)
- Chart on Singapore - Year-over-year growth 2024-2029 (%)
- Data Table on Singapore - Year-over-year growth 2024-2029 (%)
- 13.5 Thailand - Market size and forecast 2024-2029
- Chart on Thailand - Market size and forecast 2024-2029 ($ million)
- Data Table on Thailand - Market size and forecast 2024-2029 ($ million)
- Chart on Thailand - Year-over-year growth 2024-2029 (%)
- Data Table on Thailand - Year-over-year growth 2024-2029 (%)
- 13.6 Indonesia - Market size and forecast 2024-2029
- Chart on Indonesia - Market size and forecast 2024-2029 ($ million)
- Data Table on Indonesia - Market size and forecast 2024-2029 ($ million)
- Chart on Indonesia - Year-over-year growth 2024-2029 (%)
- Data Table on Indonesia - Year-over-year growth 2024-2029 (%)
- 13.7 Rest of Southeast Asia - Market size and forecast 2024-2029
- Chart on Rest of Southeast Asia - Market size and forecast 2024-2029 ($ million)
- Data Table on Rest of Southeast Asia - Market size and forecast 2024-2029 ($ million)
- Chart on Rest of Southeast Asia - Year-over-year growth 2024-2029 (%)
- Data Table on Rest of Southeast Asia - Year-over-year growth 2024-2029 (%)
- 13.8 Market opportunity by geography
- Market opportunity by geography ($ million)
- Data Table on Market opportunity by geography ($ million)
14 Drivers, Challenges, and Opportunity/Restraints
- 14.3 Impact of drivers and challenges
- Impact of drivers and challenges in 2024 and 2029
- 14.4 Market opportunities/restraints
15 Competitive Landscape
- 15.2 Competitive Landscape
- Overview on criticality of inputs and factors of differentiation
- 15.3 Landscape disruption
- Overview on factors of disruption
- 15.4 Industry risks
- Impact of key risks on business
16 Competitive Analysis
- 16.2 Company ranking index
- 16.3 Market positioning of companies
- Matrix on companies position and classification
- 16.4 Accenture PLC
- Accenture PLC - Overview
- Accenture PLC - Business segments
- Accenture PLC - Key news
- Accenture PLC - Key offerings
- Accenture PLC - Segment focus
- SWOT
- 16.5 Acer Inc.
- Acer Inc. - Overview
- Acer Inc. - Business segments
- Acer Inc. - Key news
- Acer Inc. - Key offerings
- Acer Inc. - Segment focus
- SWOT
- 16.6 Alphabet Inc.
- Alphabet Inc. - Overview
- Alphabet Inc. - Business segments
- Alphabet Inc. - Key offerings
- Alphabet Inc. - Segment focus
- SWOT
- 16.7 Apple Inc.
- Apple Inc. - Overview
- Apple Inc. - Business segments
- Apple Inc. - Key news
- Apple Inc. - Key offerings
- Apple Inc. - Segment focus
- SWOT
- 16.8 ASUSTeK Computer Inc.
- ASUSTeK Computer Inc. - Overview
- ASUSTeK Computer Inc. - Product / Service
- ASUSTeK Computer Inc. - Key news
- ASUSTeK Computer Inc. - Key offerings
- SWOT
- 16.9 Broadcom Inc.
- Broadcom Inc. - Overview
- Broadcom Inc. - Business segments
- Broadcom Inc. - Key news
- Broadcom Inc. - Key offerings
- Broadcom Inc. - Segment focus
- SWOT
- 16.10 Capgemini Services SAS
- Capgemini Services SAS - Overview
- Capgemini Services SAS - Business segments
- Capgemini Services SAS - Key news
- Capgemini Services SAS - Key offerings
- Capgemini Services SAS - Segment focus
- SWOT
- 16.11 Cisco Systems Inc.
- Cisco Systems Inc. - Overview
- Cisco Systems Inc. - Business segments
- Cisco Systems Inc. - Key news
- Cisco Systems Inc. - Key offerings
- Cisco Systems Inc. - Segment focus
- SWOT
- 16.12 Dell Technologies Inc.
- Dell Technologies Inc. - Overview
- Dell Technologies Inc. - Business segments
- Dell Technologies Inc. - Key news
- Dell Technologies Inc. - Key offerings
- Dell Technologies Inc. - Segment focus
- SWOT
- 16.13 Hewlett Packard Enterprise Co.
- Hewlett Packard Enterprise Co. - Overview
- Hewlett Packard Enterprise Co. - Business segments
- Hewlett Packard Enterprise Co. - Key news
- Hewlett Packard Enterprise Co. - Key offerings
- Hewlett Packard Enterprise Co. - Segment focus
- SWOT
- 16.14 International Business Machines Corp.
- International Business Machines Corp. - Overview
- International Business Machines Corp. - Business segments
- International Business Machines Corp. - Key news
- International Business Machines Corp. - Key offerings
- International Business Machines Corp. - Segment focus
- SWOT
- 16.15 Microsoft Corp.
- Microsoft Corp. - Overview
- Microsoft Corp. - Business segments
- Microsoft Corp. - Key news
- Microsoft Corp. - Key offerings
- Microsoft Corp. - Segment focus
- SWOT
- 16.16 Oracle Corp.
- Oracle Corp. - Overview
- Oracle Corp. - Business segments
- Oracle Corp. - Key news
- Oracle Corp. - Key offerings
- Oracle Corp. - Segment focus
- SWOT
- 16.17 Samsung Electronics Co. Ltd.
- Samsung Electronics Co. Ltd. - Overview
- Samsung Electronics Co. Ltd. - Business segments
- Samsung Electronics Co. Ltd. - Key news
- Samsung Electronics Co. Ltd. - Key offerings
- Samsung Electronics Co. Ltd. - Segment focus
- SWOT
- 16.18 SAP SE
- SAP SE - Overview
- SAP SE - Business segments
- SAP SE - Key news
- SAP SE - Key offerings
- SAP SE - Segment focus
- SWOT
17 Appendix
- 17.2 Inclusions and exclusions checklist
- Inclusions checklist
- Exclusions checklist
- 17.3 Currency conversion rates for US$
- Currency conversion rates for US$
- 17.4 Research methodology
- 17.7 Validation techniques employed for market sizing
- Validation techniques employed for market sizing
- 17.9 360 degree market analysis
- 360 degree market analysis
- 17.10 List of abbreviations