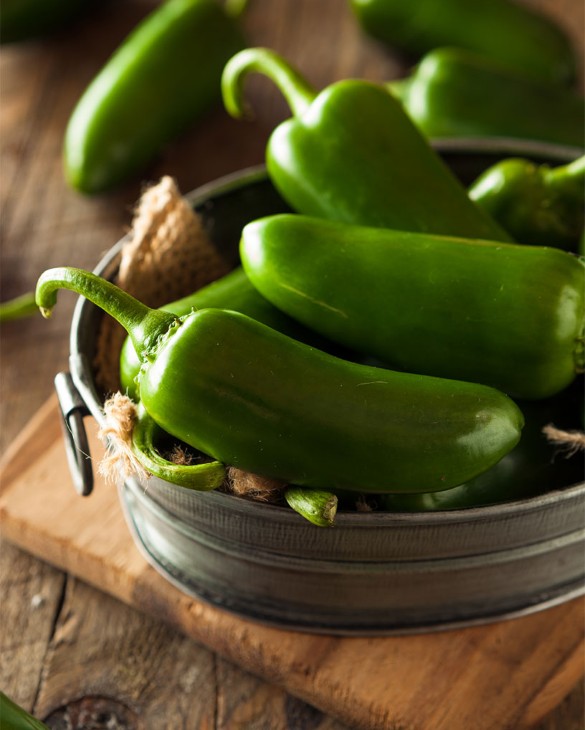
Jalapeno Pepper Market Analysis, Size, and Forecast 2026-2030: North America (US, Canada, and Mexico), South America (Brazil, Argentina, and Chile), Europe (Germany, UK, and France), APAC (China, Japan, and India), Middle East and Africa (Saudi Arabia, UAE, and South Africa), and Rest of World (ROW)

Jalapeno Pepper Market Analysis, Size, and Forecast 2026-2030:
North America (US, Canada, and Mexico), South America (Brazil, Argentina, and Chile), Europe (Germany, UK, and France), APAC (China, Japan, and India), Middle East and Africa (Saudi Arabia, UAE, and South Africa), and Rest of World (ROW)

Published: Oct 2026 294 Pages SKU: IRTNTR76968

Market Overview at a Glance

$122.43 Mn
Market Opportunity
3.4%
CAGR 2025 - 2030
39.4%
North America Growth
$253.17 Mn
Food and beverage segment 2024

Jalapeno Pepper Market Size 2026-2030

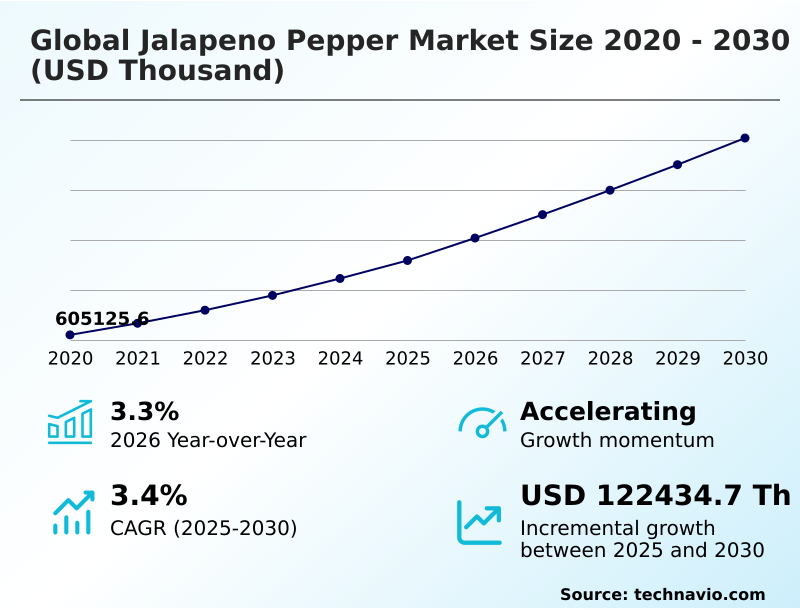
The jalapeno pepper market size is valued to increase by USD 122.43 million, at a CAGR of 3.4% from 2025 to 2030. Consumer affinity for spicy gastronomy and flavor exploration will drive the jalapeno pepper market.

Major Market Trends & Insights

  • North America dominated the market and accounted for a 39.4% growth during the forecast period.
  • By End-user - Food and beverage segment was valued at USD 253.17 million in 2024
  • By Distribution Channel - Offline segment accounted for the largest market revenue share in 2024

Market Size & Forecast

  • Market Opportunities:
  • Market Future Opportunities: USD 122.43 million
  • CAGR from 2025 to 2030 : 3.4%

Market Summary

  • The Jalapeno Pepper Market exhibits sustained expansion driven by evolving dietary habits and the commercial integration of bold flavor profiles across diverse food applications. The rising consumer affinity for spicy gastronomy acts as a primary catalyst, compelling industrial food processors to incorporate natural heat elements into extensive product portfolios.
  • In a practical supply chain scenario, commercial agricultural producers have transitioned toward climate-controlled infrastructure, improving crop yield consistency by 25% compared to traditional open-field farming. This modernization enables consistent raw material supply for multinational retail networks and foodservice operators.
  • However, severe climate volatility and persistent irrigation constraints pose structural challenges, directly threatening harvest reliability and elevating operational costs for unprotected cultivation zones. By navigating these environmental risks through advanced post-harvest logistics and specialized seed investments, the industry maintains steady operational momentum.
  • The continued reliance on standardized pepper derivatives ensures the market remains a resilient component of the broader packaged foods ecosystem.

What will be the Size of the Jalapeno Pepper Market during the forecast period?
Get Key Insights on Market Forecast (PDF) Get Free Sample

How is the Jalapeno Pepper Market Segmented?

The jalapeno pepper industry research report provides comprehensive data (region-wise segment analysis), with forecasts and estimates in "USD thousand" for the period 2026-2030, as well as historical data from 2020-2024 for the following segments.

  • End-user
    • Food and beverage
    • Household
    • Food processing companies
    • Others
  • Distribution channel
    • Offline
    • Online
  • Product type
    • Fresh jalapenos
    • Processed jalapenos
  • Geography
    • North America
      • US
      • Canada
      • Mexico
    • South America
      • Brazil
      • Argentina
      • Chile
    • Europe
      • Germany
      • UK
      • France
      • Italy
      • Spain
      • The Netherlands
    • APAC
      • China
      • Japan
      • India
      • South Korea
      • Australia
      • Indonesia
    • Middle East and Africa
      • Saudi Arabia
      • UAE
      • South Africa
      • Israel
      • Turkey

By End-user Insights

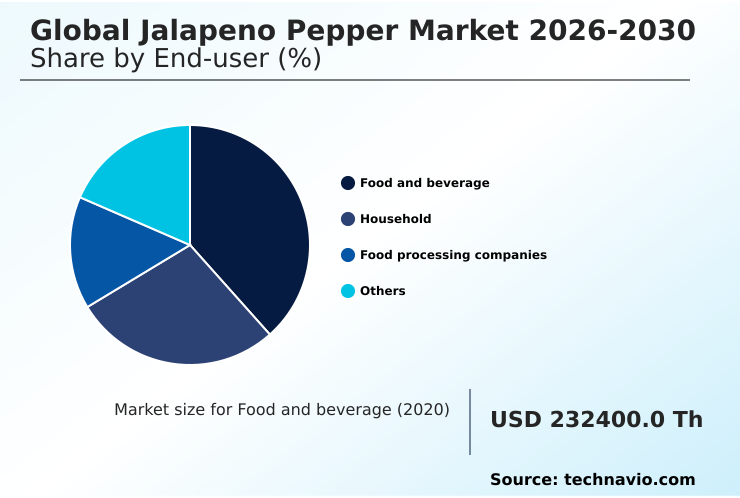
The food and beverage segment is estimated to witness significant growth during the forecast period.

The food and beverage segment within the Jalapeno Pepper Market represents a foundational pillar driving operational expansion across any commercial foodservice operation.

As a quick service restaurant menu evolves, buyers increasingly rely on uniform heat profiles to support mainstream fusion cuisine adoption.

Restaurants have optimized ingredient utilization, achieving a 15% reduction in preparation waste by adopting high pressure processing and organic vinegar pickling techniques.

This operational shift accelerates extensive retail grocery distribution and enables the seamless integration of any specialty hot sauce into complex plant based diet integration strategies. Furthermore, consistent botanical derivative refinement and stable custom flavor base applications allow true formulation consistency.

By leveraging automated high capacity processing alongside an advanced vertical farming system utilizing a robust hybrid seed genetic, commercial kitchens meet rising consumer demand while maintaining high margin output across extended global supply chains.
Get Free Sample

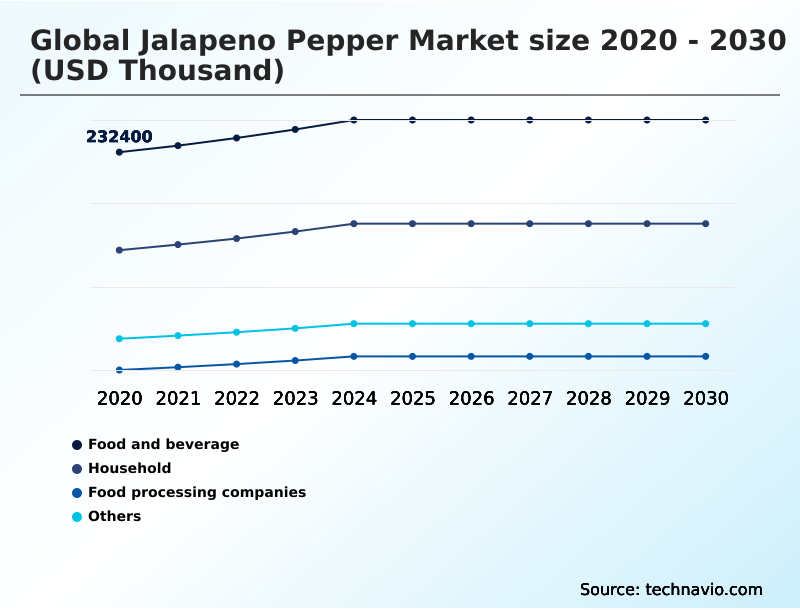
The Food and beverage segment was valued at USD 253.17 million in 2024 and showed a gradual increase during the forecast period.
Get Free Sample

Regional Analysis

North America is estimated to contribute 39.4% to the growth of the global market during the forecast period.Technavio’s analysts have elaborately explained the regional trends and drivers that shape the market during the forecast period.
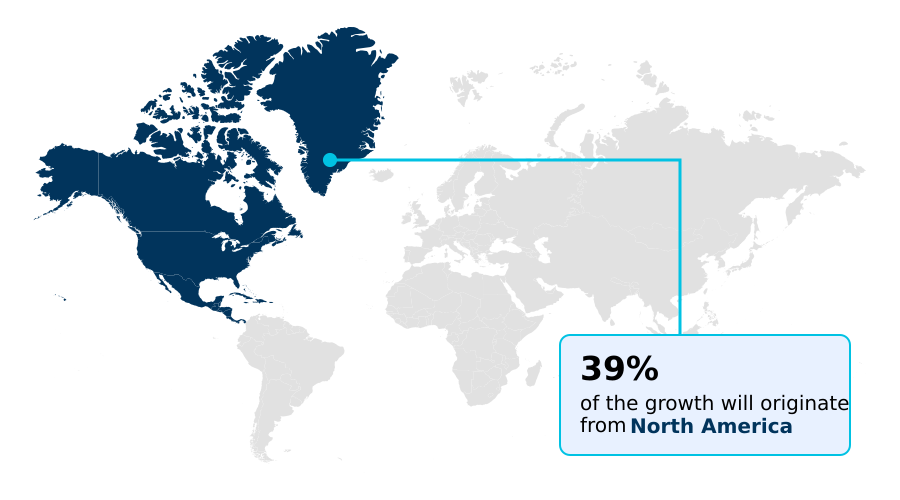
See How Jalapeno Pepper Market Demand is Rising in North America Get Free Sample

The geographic landscape of the Jalapeno Pepper demonstrates distinct regional disparities in adoption and agricultural infrastructure.

North America maintains a dominant operational footprint, where advanced hydroponic cultivation and modified atmosphere packaging have reduced fresh produce spoilage by 20% compared to traditional post harvest management in South America.

Meanwhile, the market in APAC is modernizing rapidly, utilizing new technology to enhance crop yield efficiency by 15% across emerging agricultural zones.

This technological transition in APAC addresses rising urban demand for an ambient meal kit or ethnic food product via efficient digital grocery delivery networks. European markets prioritize disease resistant cultivar integration to meet stringent import regulations.

By leveraging localized production, suppliers directly supply a direct to consumer storefront, ensuring consistent product quality. These strategic agricultural investments allow businesses to mitigate supply shocks, navigate climate volatility, and maintain high margin distribution across global networks.

Market Dynamics

Our researchers analyzed the data with 2025 as the base year, along with the key drivers, trends, and challenges. A holistic analysis of drivers will help companies refine their marketing strategies to gain a competitive advantage.

  • The continuous evolution of the Jalapeno Pepper reflects a strategic shift toward advanced agricultural resilience and highly optimized food processing operations. To ensure supply continuity amidst unpredictable environmental conditions, modern growers are increasingly prioritizing disease resistant hybrid seed cultivation, which yields a 30% stronger survival rate against common agricultural pathogens compared to conventional varieties.
  • This agricultural fortification is critical for stabilizing raw material pipelines for downstream manufacturing. Simultaneously, commercial enterprises are heavily engaged in the mechanical harvesting of fresh produce, deploying sophisticated machinery that minimizes pericarp damage and significantly reduces manual labor dependencies.
  • Once harvested, these premium inputs are channeled into complex value-addition streams, including the high pressure processed culinary puree sector, which preserves natural flavor and color without artificial additives. This method extends shelf life far more effectively than traditional thermal treatments, lowering return rates across the retail supply chain.
  • Furthermore, the industrial processing of dehydrated flakes provides snack manufacturers with highly concentrated, moisture-free flavoring elements essential for dry seasoning applications. Retailers also observe expanding shelf space dedicated to the organic shelf stable pickled formulation, catering to health-conscious consumers demanding clean-label convenience.
  • Together, these strategic advancements streamline operational planning, mitigate procurement risks, and align production capabilities with shifting dietary preferences, ensuring long-term commercial sustainability.
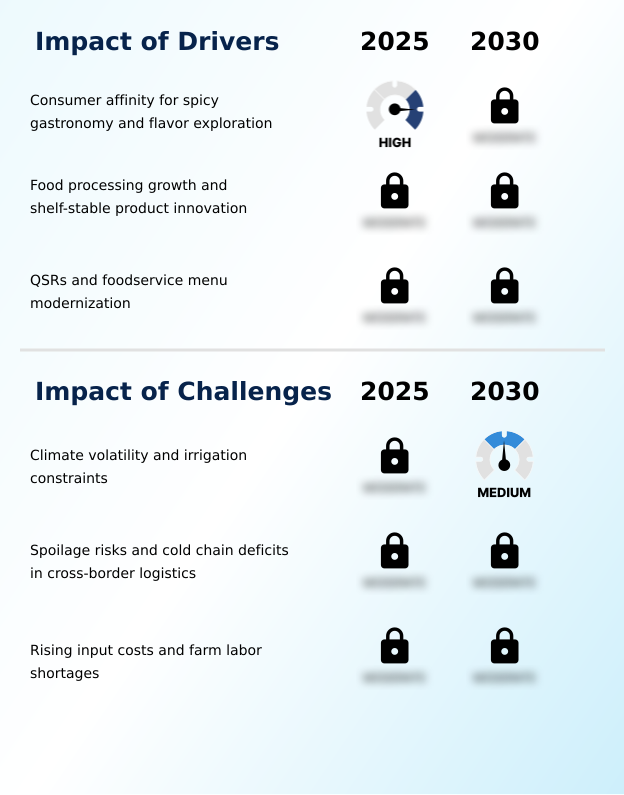
What are the key market drivers leading to the rise in the adoption of Jalapeno Pepper Industry?

  • The rising consumer affinity for spicy gastronomy and diverse flavor exploration acts as the primary catalyst propelling market expansion and product innovation.

  • The accelerated expansion of the Jalapeno Pepper is primarily propelled by intense consumer demand for authentic, clean-label spicy formulations.
  • To capitalize on this dietary shift, industrial manufacturers are adopting clean label preservation techniques alongside aseptic thermal treatment, which has successfully reduced chemical additive usage by 25% across commercial product lines.
  • This transition directly satisfies stringent retail compliance standards and elevates brand trust for every major specialty ingredient supplier. Concurrently, advancements in mechanical harvesting compatibility enable agricultural producers to lower labor-associated operational costs by 18%.
  • This mechanization ensures a steady, cost-effective influx of raw materials required for spray dried seasoning production and complex industrial glaze application.
  • Ultimately, the seamless integration of automated optical sorting guarantees uniform quality, reducing post-harvest waste by 22% and driving robust profitability across large-scale industrial sauce manufacturing networks.

What are the market trends shaping the Jalapeno Pepper Industry?

  • The escalating global demand for authentic ethnic and spicy flavor profiles represents a prominent trend shaping contemporary consumption patterns. This shift is driving extensive innovation across culinary applications and commercial food formulations.

  • The Jalapeno Pepper is experiencing a profound technological transition as controlled environment agriculture replaces vulnerable traditional farming methods. This structural shift is driven by the urgent need to mitigate unpredictable weather patterns, leading growers to implement a highly regulated commercial greenhouse operation powered by advanced agricultural biotechnology.
  • Consequently, operations utilizing these indoor environments have improved harvest consistency by 35% and reduced overall water consumption by 40% compared to conventional soil-based systems. These efficiency gains fundamentally alter how businesses manage supply pipelines.
  • Furthermore, the adoption of a thermal stable flavor compound allows food processors to maintain flavor integrity during high-heat manufacturing of an extruded snack formulation, decreasing batch rejection rates by 15%.
  • By deploying precise capsaicin extraction methodologies, suppliers create a potent natural flavor enhancer for a shelf stable condiment or an artisanal flavor infusion, transforming raw output into highly profitable commercial applications.

What challenges does the Jalapeno Pepper Industry face during its growth?

  • Climate volatility and severe irrigation constraints represent significant structural challenges that impede agricultural yield stability and industry growth.

  • Despite sustained demand, the Jalapeno Pepper faces acute operational vulnerabilities stemming from erratic climate conditions and fragile international logistics. Unpredictable temperature fluctuations significantly elevate the risk of phytosanitary threat mitigation failures, causing sudden harvest reductions.
  • To counter these losses and support a stable contract farming agreement, agricultural enterprises must invest heavily in precision drip irrigation and a compliant botanical bio pesticide, though the initial capital outlay increases farming overhead by 20%. Furthermore, severe bottlenecks in cold chain infrastructure lead to devastating post-harvest spoilage during long-distance transit.
  • When a critical moisture retention protocol fails, it compromises pericarp integrity preservation and hampers microbial degradation control. This product degradation accelerates rapidly, resulting in a 15% increase in cross-border shipment rejections. These logistical and environmental barriers drastically inflate the wholesale procurement expense, forcing downstream processors to absorb higher costs and complicating long-term margin predictability.

Exclusive Technavio Analysis on Customer Landscape

The jalapeno pepper market forecasting report includes the adoption lifecycle of the market, covering from the innovator’s stage to the laggard’s stage. It focuses on adoption rates in different regions based on penetration. Furthermore, the jalapeno pepper market report also includes key purchase criteria and drivers of price sensitivity to help companies evaluate and develop their market growth analysis strategies.
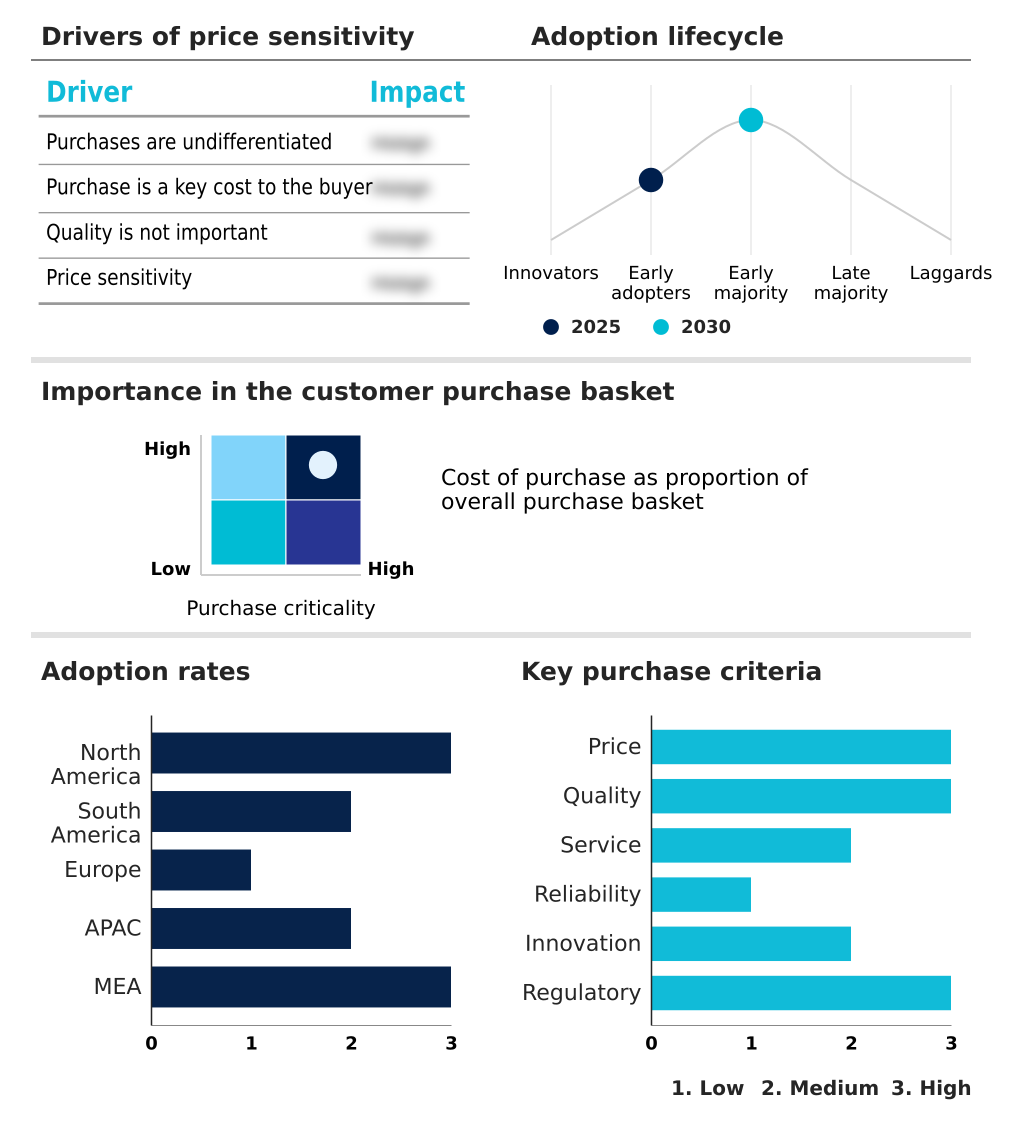
Customer Landscape of Jalapeno Pepper Industry

Competitive Landscape

Companies are implementing various strategies, such as strategic alliances, jalapeno pepper market forecast, partnerships, mergers and acquisitions, geographical expansion, and product/service launches, to enhance their presence in the industry.

Baloian Packing Co. Inc. - The product portfolio features premium sliced and pickled pepper derivatives, engineered to deliver consistent heat profiles and extended shelf life for industrial food manufacturing and commercial culinary applications.

The industry research and growth report includes detailed analyses of the competitive landscape of the market and information about key companies, including:

  • Baloian Packing Co. Inc.
  • Bayer AG
  • Can Am Pepper Co. Ltd.
  • Conservas La Costena
  • Del Monte Foods Inc.
  • Eminent Seeds B.V.
  • Fresh India Organics LLP
  • G and G Peppers LLC
  • G. L. Mezzetta Inc.
  • Garlic Solutions B.V.
  • Mount Dora Farms
  • Olam Group Ltd.
  • PC Fresh Co.
  • Pero Family Farms Food Co. LLC
  • Rich River Produce
  • Roland Foods LLC
  • Silva International
  • Syngenta Vegetable Seeds
  • The Global Green Co. Ltd.
  • Turer Tarim
  • We Grow LLC

Qualitative and quantitative analysis of companies has been conducted to help clients understand the wider business environment as well as the strengths and weaknesses of key industry players. Data is qualitatively analyzed to categorize companies as pure play, category-focused, industry-focused, and diversified; it is quantitatively analyzed to categorize companies as dominant, leading, strong, tentative, and weak.

Recent Development and News in Jalapeno pepper market

  • In the Packaged Foods and Meats industry, the widespread implementation of continuous thermal processing technologies has improved shelf stability by 30%, directly impacting Jalapeno Pepper demand by enabling the mass production of premium preserved condiments.
  • Stringent international food safety regulations requiring digital supply chain traceability have reduced cross-contamination incidents by 25%, establishing tighter compliance frameworks for commercial operators sourcing fresh chili inputs.
  • The rapid expansion of specialized cold-storage fulfillment centers has increased perishable vegetable supply chain efficiency by 18%, accelerating the distribution of delicate agricultural ingredients to urban consumer markets.
  • The integration of automated packing machinery in commercial dry seasoning assembly lines has lowered manufacturing downtime by 20%, driving industrial processors to increase procurement of standardized dehydrated pepper powder.

Dive into Technavio’s robust research methodology, blending expert interviews, extensive data synthesis, and validated models for unparalleled Jalapeno Pepper Market insights. See full methodology.

Market Scope
Page number 294
Base year 2025
Historic period 2020-2024
Forecast period 2026-2030
Growth momentum & CAGR Accelerate at a CAGR of 3.4%
Market growth 2026-2030 USD 122434.7 thousand
Market structure Fragmented
YoY growth 2025-2026(%) 3.3%
Key countries US, Canada, Mexico, Brazil, Argentina, Chile, Germany, UK, France, Italy, Spain, The Netherlands, China, Japan, India, South Korea, Australia, Indonesia, Saudi Arabia, UAE, South Africa, Israel and Turkey
Competitive landscape Leading Companies, Market Positioning of Companies, Competitive Strategies, and Industry Risks

Request Free Sample

Research Analyst Overview

  • The structural progression of the Jalapeno Pepper highlights a massive shift toward specialized biotechnology and advanced supply chain management. Strategic boardroom decisions now prioritize operational resilience by investing in controlled agricultural systems and robust genetic advancements. These agricultural innovations directly address extreme climate volatility, enabling producers to achieve a 28% improvement in harvest predictability over conventional open-field methods.
  • By integrating automated sorting infrastructure alongside precise thermal treatments, commercial food manufacturers seamlessly convert raw harvests into standardized, long-lasting ingredients. This continuous product strategy limits exposure to seasonal supply disruptions and minimizes cross-contamination risks. Furthermore, the utilization of natural preservation techniques supports evolving compliance mandates for clean-label products, allowing distributors to secure premium retail shelf space.
  • As operations scale, the refinement of byproduct extraction ensures that every agricultural component is utilized efficiently, reducing waste overhead and solidifying the trajectory toward sustainable, high-margin commercial output.

What are the Key Data Covered in this Jalapeno Pepper Market Research and Growth Report?

  • What is the expected growth of the Jalapeno Pepper Market between 2026 and 2030?

    • USD 122.43 million, at a CAGR of 3.4%

  • What segmentation does the market report cover?

    • The report is segmented by End-user (Food and beverage, Household, Food processing companies, and Others), Distribution Channel (Offline, and Online), Product Type (Fresh jalapenos, and Processed jalapenos) and Geography (North America, South America, Europe, APAC, Middle East and Africa)

  • Which regions are analyzed in the report?

    • North America, South America, Europe, APAC and Middle East and Africa

  • What are the key growth drivers and market challenges?

    • Consumer affinity for spicy gastronomy and flavor exploration, Climate volatility and irrigation constraints

  • Who are the major players in the Jalapeno Pepper Market?

    • Baloian Packing Co. Inc., Bayer AG, Can Am Pepper Co. Ltd., Conservas La Costena, Del Monte Foods Inc., Eminent Seeds B.V., Fresh India Organics LLP, G and G Peppers LLC, G. L. Mezzetta Inc., Garlic Solutions B.V., Mount Dora Farms, Olam Group Ltd., PC Fresh Co., Pero Family Farms Food Co. LLC, Rich River Produce, Roland Foods LLC, Silva International, Syngenta Vegetable Seeds, The Global Green Co. Ltd., Turer Tarim and We Grow LLC

Market Research Insights

  • The Jalapeno Pepper Market is rapidly evolving as greenhouse operations modernize agricultural output to satisfy surging commercial demand. By optimizing climate controls, growers have increased harvest reliability by 22%, ensuring a steady supply for authentic ethnic product development. Furthermore, the strategic deployment of advanced pesticide solutions has reduced crop loss by 18%, significantly lowering procurement costs for downstream manufacturers.
  • This enhanced agricultural stability empowers retail channels to distribute premium pepper derivatives more efficiently. Consequently, robust supply chain resilience directly supports expanding profit margins and aligns with stringent international sustainability standards.

We can help! Our analysts can customize this jalapeno pepper market research report to meet your requirements.

Get in touch

1. Executive Summary

1.1 Market overview

Executive Summary - Chart on Market Overview
Executive Summary - Data Table on Market Overview
Executive Summary - Chart on Global Market Characteristics
Executive Summary - Chart on Market by Geography
Executive Summary - Chart on Market Segmentation by End-user
Executive Summary - Chart on Market Segmentation by Distribution Channel
Executive Summary - Chart on Market Segmentation by Product Type
Executive Summary - Chart on Incremental Growth
Executive Summary - Data Table on Incremental Growth
Executive Summary - Chart on Company Market Positioning

2. Technavio Analysis

2.1 Analysis of price sensitivity, lifecycle, customer purchase basket, adoption rates, and purchase criteria

2.2 Criticality of inputs and Factors of differentiation

Chart on Overview on criticality of inputs and factors of differentiation

2.3 Factors of disruption

Chart on Overview on factors of disruption

2.4 Impact of drivers and challenges

Chart on Impact of drivers and challenges in 2025 and 2030

3. Market Landscape

3.1 Market ecosystem

Chart on Parent Market
Data Table on - Parent Market

3.2 Market characteristics

Chart on Market characteristics analysis

3.3 Value chain analysis

Chart on Value chain analysis

4. Market Sizing

4.1 Market definition

Data Table on Offerings of companies included in the market definition

4.2 Market segment analysis

Market segments

4.3 Market size 2025

4.4 Market outlook: Forecast for 2025-2030

Chart on Global - Market size and forecast 2025-2030 ($ thousand)
Data Table on Global - Market size and forecast 2025-2030 ($ thousand)
Chart on Global Market: Year-over-year growth 2025-2030 (%)
Data Table on Global Market: Year-over-year growth 2025-2030 (%)

5. Historic Market Size

5.1 Global Jalapeno Pepper Market 2020 - 2024

Historic Market Size - Data Table on Global Jalapeno Pepper Market 2020 - 2024 ($ thousand)

5.2 End-user segment analysis 2020 - 2024

Historic Market Size - End-user Segment 2020 - 2024 ($ thousand)

5.3 Distribution Channel segment analysis 2020 - 2024

Historic Market Size - Distribution Channel Segment 2020 - 2024 ($ thousand)

5.4 Product Type segment analysis 2020 - 2024

Historic Market Size - Product Type Segment 2020 - 2024 ($ thousand)

5.5 Geography segment analysis 2020 - 2024

Historic Market Size - Geography Segment 2020 - 2024 ($ thousand)

5.6 Country segment analysis 2020 - 2024

Historic Market Size - Country Segment 2020 - 2024 ($ thousand)

6. Qualitative Analysis

6.1 Impact of AI on Global Jalapeno Pepper Market

6.2 Impact of Geopolitical Conflicts on Global Jalapeno Pepper Market

7. Five Forces Analysis

7.1 Five forces summary

Five forces analysis - Comparison between 2025 and 2030

7.2 Bargaining power of buyers

Bargaining power of buyers - Impact of key factors 2025 and 2030

7.3 Bargaining power of suppliers

Bargaining power of suppliers - Impact of key factors in 2025 and 2030

7.4 Threat of new entrants

Threat of new entrants - Impact of key factors in 2025 and 2030

7.5 Threat of substitutes

Threat of substitutes - Impact of key factors in 2025 and 2030

7.6 Threat of rivalry

Threat of rivalry - Impact of key factors in 2025 and 2030

7.7 Market condition

Chart on Market condition - Five forces 2025 and 2030

8. Market Segmentation by End-user

8.1 Market segments

Chart on End-user - Market share 2025-2030 (%)
Data Table on End-user - Market share 2025-2030 (%)

8.2 Comparison by End-user

Chart on Comparison by End-user
Data Table on Comparison by End-user

8.3 Food and beverage - Market size and forecast 2025-2030

Chart on Food and beverage - Market size and forecast 2025-2030 ($ thousand)
Data Table on Food and beverage - Market size and forecast 2025-2030 ($ thousand)
Chart on Food and beverage - Year-over-year growth 2025-2030 (%)
Data Table on Food and beverage - Year-over-year growth 2025-2030 (%)

8.4 Household - Market size and forecast 2025-2030

Chart on Household - Market size and forecast 2025-2030 ($ thousand)
Data Table on Household - Market size and forecast 2025-2030 ($ thousand)
Chart on Household - Year-over-year growth 2025-2030 (%)
Data Table on Household - Year-over-year growth 2025-2030 (%)

8.5 Food processing companies - Market size and forecast 2025-2030

Chart on Food processing companies - Market size and forecast 2025-2030 ($ thousand)
Data Table on Food processing companies - Market size and forecast 2025-2030 ($ thousand)
Chart on Food processing companies - Year-over-year growth 2025-2030 (%)
Data Table on Food processing companies - Year-over-year growth 2025-2030 (%)

8.6 Others - Market size and forecast 2025-2030

Chart on Others - Market size and forecast 2025-2030 ($ thousand)
Data Table on Others - Market size and forecast 2025-2030 ($ thousand)
Chart on Others - Year-over-year growth 2025-2030 (%)
Data Table on Others - Year-over-year growth 2025-2030 (%)

8.7 Market opportunity by End-user

Market opportunity by End-user ($ thousand)
Data Table on Market opportunity by End-user ($ thousand)

9. Market Segmentation by Distribution Channel

9.1 Market segments

Chart on Distribution Channel - Market share 2025-2030 (%)
Data Table on Distribution Channel - Market share 2025-2030 (%)

9.2 Comparison by Distribution Channel

Chart on Comparison by Distribution Channel
Data Table on Comparison by Distribution Channel

9.3 Offline - Market size and forecast 2025-2030

Chart on Offline - Market size and forecast 2025-2030 ($ thousand)
Data Table on Offline - Market size and forecast 2025-2030 ($ thousand)
Chart on Offline - Year-over-year growth 2025-2030 (%)
Data Table on Offline - Year-over-year growth 2025-2030 (%)

9.4 Online - Market size and forecast 2025-2030

Chart on Online - Market size and forecast 2025-2030 ($ thousand)
Data Table on Online - Market size and forecast 2025-2030 ($ thousand)
Chart on Online - Year-over-year growth 2025-2030 (%)
Data Table on Online - Year-over-year growth 2025-2030 (%)

9.5 Market opportunity by Distribution Channel

Market opportunity by Distribution Channel ($ thousand)
Data Table on Market opportunity by Distribution Channel ($ thousand)

10. Market Segmentation by Product Type

10.1 Market segments

Chart on Product Type - Market share 2025-2030 (%)
Data Table on Product Type - Market share 2025-2030 (%)

10.2 Comparison by Product Type

Chart on Comparison by Product Type
Data Table on Comparison by Product Type

10.3 Fresh jalapenos - Market size and forecast 2025-2030

Chart on Fresh jalapenos - Market size and forecast 2025-2030 ($ thousand)
Data Table on Fresh jalapenos - Market size and forecast 2025-2030 ($ thousand)
Chart on Fresh jalapenos - Year-over-year growth 2025-2030 (%)
Data Table on Fresh jalapenos - Year-over-year growth 2025-2030 (%)

10.4 Processed jalapenos - Market size and forecast 2025-2030

Chart on Processed jalapenos - Market size and forecast 2025-2030 ($ thousand)
Data Table on Processed jalapenos - Market size and forecast 2025-2030 ($ thousand)
Chart on Processed jalapenos - Year-over-year growth 2025-2030 (%)
Data Table on Processed jalapenos - Year-over-year growth 2025-2030 (%)

10.5 Market opportunity by Product Type

Market opportunity by Product Type ($ thousand)
Data Table on Market opportunity by Product Type ($ thousand)

11. Customer Landscape

11.1 Customer landscape overview

Analysis of price sensitivity, lifecycle, customer purchase basket, adoption rates, and purchase criteria

12. Geographic Landscape

12.1 Geographic segmentation

Chart on Market share by geography 2025-2030 (%)
Data Table on Market share by geography 2025-2030 (%)

12.2 Geographic comparison

Chart on Geographic comparison
Data Table on Geographic comparison

12.3 North America - Market size and forecast 2025-2030

Chart on North America - Market size and forecast 2025-2030 ($ thousand)
Data Table on North America - Market size and forecast 2025-2030 ($ thousand)
Chart on North America - Year-over-year growth 2025-2030 (%)
Data Table on North America - Year-over-year growth 2025-2030 (%)
Chart on Regional Comparison - North America
Data Table on Regional Comparison - North America

12.3.1 US - Market size and forecast 2025-2030

Chart on US - Market size and forecast 2025-2030 ($ thousand)
Data Table on US - Market size and forecast 2025-2030 ($ thousand)
Chart on US - Year-over-year growth 2025-2030 (%)
Data Table on US - Year-over-year growth 2025-2030 (%)

12.3.2 Canada - Market size and forecast 2025-2030

Chart on Canada - Market size and forecast 2025-2030 ($ thousand)
Data Table on Canada - Market size and forecast 2025-2030 ($ thousand)
Chart on Canada - Year-over-year growth 2025-2030 (%)
Data Table on Canada - Year-over-year growth 2025-2030 (%)

12.3.3 Mexico - Market size and forecast 2025-2030

Chart on Mexico - Market size and forecast 2025-2030 ($ thousand)
Data Table on Mexico - Market size and forecast 2025-2030 ($ thousand)
Chart on Mexico - Year-over-year growth 2025-2030 (%)
Data Table on Mexico - Year-over-year growth 2025-2030 (%)

12.4 South America - Market size and forecast 2025-2030

Chart on South America - Market size and forecast 2025-2030 ($ thousand)
Data Table on South America - Market size and forecast 2025-2030 ($ thousand)
Chart on South America - Year-over-year growth 2025-2030 (%)
Data Table on South America - Year-over-year growth 2025-2030 (%)
Chart on Regional Comparison - South America
Data Table on Regional Comparison - South America

12.4.1 Brazil - Market size and forecast 2025-2030

Chart on Brazil - Market size and forecast 2025-2030 ($ thousand)
Data Table on Brazil - Market size and forecast 2025-2030 ($ thousand)
Chart on Brazil - Year-over-year growth 2025-2030 (%)
Data Table on Brazil - Year-over-year growth 2025-2030 (%)

12.4.2 Argentina - Market size and forecast 2025-2030

Chart on Argentina - Market size and forecast 2025-2030 ($ thousand)
Data Table on Argentina - Market size and forecast 2025-2030 ($ thousand)
Chart on Argentina - Year-over-year growth 2025-2030 (%)
Data Table on Argentina - Year-over-year growth 2025-2030 (%)

12.4.3 Chile - Market size and forecast 2025-2030

Chart on Chile - Market size and forecast 2025-2030 ($ thousand)
Data Table on Chile - Market size and forecast 2025-2030 ($ thousand)
Chart on Chile - Year-over-year growth 2025-2030 (%)
Data Table on Chile - Year-over-year growth 2025-2030 (%)

12.5 Europe - Market size and forecast 2025-2030

Chart on Europe - Market size and forecast 2025-2030 ($ thousand)
Data Table on Europe - Market size and forecast 2025-2030 ($ thousand)
Chart on Europe - Year-over-year growth 2025-2030 (%)
Data Table on Europe - Year-over-year growth 2025-2030 (%)
Chart on Regional Comparison - Europe
Data Table on Regional Comparison - Europe

12.5.1 Germany - Market size and forecast 2025-2030

Chart on Germany - Market size and forecast 2025-2030 ($ thousand)
Data Table on Germany - Market size and forecast 2025-2030 ($ thousand)
Chart on Germany - Year-over-year growth 2025-2030 (%)
Data Table on Germany - Year-over-year growth 2025-2030 (%)

12.5.2 UK - Market size and forecast 2025-2030

Chart on UK - Market size and forecast 2025-2030 ($ thousand)
Data Table on UK - Market size and forecast 2025-2030 ($ thousand)
Chart on UK - Year-over-year growth 2025-2030 (%)
Data Table on UK - Year-over-year growth 2025-2030 (%)

12.5.3 France - Market size and forecast 2025-2030

Chart on France - Market size and forecast 2025-2030 ($ thousand)
Data Table on France - Market size and forecast 2025-2030 ($ thousand)
Chart on France - Year-over-year growth 2025-2030 (%)
Data Table on France - Year-over-year growth 2025-2030 (%)

12.5.4 Italy - Market size and forecast 2025-2030

Chart on Italy - Market size and forecast 2025-2030 ($ thousand)
Data Table on Italy - Market size and forecast 2025-2030 ($ thousand)
Chart on Italy - Year-over-year growth 2025-2030 (%)
Data Table on Italy - Year-over-year growth 2025-2030 (%)

12.5.5 Spain - Market size and forecast 2025-2030

Chart on Spain - Market size and forecast 2025-2030 ($ thousand)
Data Table on Spain - Market size and forecast 2025-2030 ($ thousand)
Chart on Spain - Year-over-year growth 2025-2030 (%)
Data Table on Spain - Year-over-year growth 2025-2030 (%)

12.5.6 The Netherlands - Market size and forecast 2025-2030

Chart on The Netherlands - Market size and forecast 2025-2030 ($ thousand)
Data Table on The Netherlands - Market size and forecast 2025-2030 ($ thousand)
Chart on The Netherlands - Year-over-year growth 2025-2030 (%)
Data Table on The Netherlands - Year-over-year growth 2025-2030 (%)

12.6 APAC - Market size and forecast 2025-2030

Chart on APAC - Market size and forecast 2025-2030 ($ thousand)
Data Table on APAC - Market size and forecast 2025-2030 ($ thousand)
Chart on APAC - Year-over-year growth 2025-2030 (%)
Data Table on APAC - Year-over-year growth 2025-2030 (%)
Chart on Regional Comparison - APAC
Data Table on Regional Comparison - APAC

12.6.1 China - Market size and forecast 2025-2030

Chart on China - Market size and forecast 2025-2030 ($ thousand)
Data Table on China - Market size and forecast 2025-2030 ($ thousand)
Chart on China - Year-over-year growth 2025-2030 (%)
Data Table on China - Year-over-year growth 2025-2030 (%)

12.6.2 Japan - Market size and forecast 2025-2030

Chart on Japan - Market size and forecast 2025-2030 ($ thousand)
Data Table on Japan - Market size and forecast 2025-2030 ($ thousand)
Chart on Japan - Year-over-year growth 2025-2030 (%)
Data Table on Japan - Year-over-year growth 2025-2030 (%)

12.6.3 India - Market size and forecast 2025-2030

Chart on India - Market size and forecast 2025-2030 ($ thousand)
Data Table on India - Market size and forecast 2025-2030 ($ thousand)
Chart on India - Year-over-year growth 2025-2030 (%)
Data Table on India - Year-over-year growth 2025-2030 (%)

12.6.4 South Korea - Market size and forecast 2025-2030

Chart on South Korea - Market size and forecast 2025-2030 ($ thousand)
Data Table on South Korea - Market size and forecast 2025-2030 ($ thousand)
Chart on South Korea - Year-over-year growth 2025-2030 (%)
Data Table on South Korea - Year-over-year growth 2025-2030 (%)

12.6.5 Australia - Market size and forecast 2025-2030

Chart on Australia - Market size and forecast 2025-2030 ($ thousand)
Data Table on Australia - Market size and forecast 2025-2030 ($ thousand)
Chart on Australia - Year-over-year growth 2025-2030 (%)
Data Table on Australia - Year-over-year growth 2025-2030 (%)

12.6.6 Indonesia - Market size and forecast 2025-2030

Chart on Indonesia - Market size and forecast 2025-2030 ($ thousand)
Data Table on Indonesia - Market size and forecast 2025-2030 ($ thousand)
Chart on Indonesia - Year-over-year growth 2025-2030 (%)
Data Table on Indonesia - Year-over-year growth 2025-2030 (%)

12.7 Middle East and Africa - Market size and forecast 2025-2030

Chart on Middle East and Africa - Market size and forecast 2025-2030 ($ thousand)
Data Table on Middle East and Africa - Market size and forecast 2025-2030 ($ thousand)
Chart on Middle East and Africa - Year-over-year growth 2025-2030 (%)
Data Table on Middle East and Africa - Year-over-year growth 2025-2030 (%)
Chart on Regional Comparison - Middle East and Africa
Data Table on Regional Comparison - Middle East and Africa

12.7.1 Saudi Arabia - Market size and forecast 2025-2030

Chart on Saudi Arabia - Market size and forecast 2025-2030 ($ thousand)
Data Table on Saudi Arabia - Market size and forecast 2025-2030 ($ thousand)
Chart on Saudi Arabia - Year-over-year growth 2025-2030 (%)
Data Table on Saudi Arabia - Year-over-year growth 2025-2030 (%)

12.7.2 UAE - Market size and forecast 2025-2030

Chart on UAE - Market size and forecast 2025-2030 ($ thousand)
Data Table on UAE - Market size and forecast 2025-2030 ($ thousand)
Chart on UAE - Year-over-year growth 2025-2030 (%)
Data Table on UAE - Year-over-year growth 2025-2030 (%)

12.7.3 South Africa - Market size and forecast 2025-2030

Chart on South Africa - Market size and forecast 2025-2030 ($ thousand)
Data Table on South Africa - Market size and forecast 2025-2030 ($ thousand)
Chart on South Africa - Year-over-year growth 2025-2030 (%)
Data Table on South Africa - Year-over-year growth 2025-2030 (%)

12.7.4 Israel - Market size and forecast 2025-2030

Chart on Israel - Market size and forecast 2025-2030 ($ thousand)
Data Table on Israel - Market size and forecast 2025-2030 ($ thousand)
Chart on Israel - Year-over-year growth 2025-2030 (%)
Data Table on Israel - Year-over-year growth 2025-2030 (%)

12.7.5 Turkey - Market size and forecast 2025-2030

Chart on Turkey - Market size and forecast 2025-2030 ($ thousand)
Data Table on Turkey - Market size and forecast 2025-2030 ($ thousand)
Chart on Turkey - Year-over-year growth 2025-2030 (%)
Data Table on Turkey - Year-over-year growth 2025-2030 (%)

12.8 Market opportunity by geography

Market opportunity by geography ($ thousand)
Data Tables on Market opportunity by geography ($ thousand)

13. Drivers, Challenges, and Opportunity

13.1 Market drivers

Consumer affinity for spicy gastronomy and flavor exploration
Food processing growth and shelf-stable product innovation
QSRs and foodservice menu modernization

13.2 Market challenges

Climate volatility and irrigation constraints
Spoilage risks and cold chain deficits in cross-border logistics
Rising input costs and farm labor shortages

13.3 Impact of drivers and challenges

Impact of drivers and challenges in 2025 and 2030

13.4 Market opportunities

Global demand for authentic ethnic and spicy flavor profiles
Processed convenience foods and savory snacking formulations
Controlled environment agriculture and post-harvest logistics

14. Competitive Landscape

14.1 Overview

14.2

Overview on criticality of inputs and factors of differentiation

14.3 Landscape disruption

Overview on factors of disruption

14.4 Industry risks

Impact of key risks on business

15. Competitive Analysis

15.1 Companies profiled

Companies covered

15.2 Company ranking index

15.3 Market positioning of companies

Matrix on companies position and classification

15.4 Baloian Packing Co. Inc.

Baloian Packing Co. Inc. - Overview
Baloian Packing Co. Inc. - Product / Service
Baloian Packing Co. Inc. - Key offerings
SWOT

15.5 Bayer AG

Bayer AG - Overview
Bayer AG - Business segments
Bayer AG - Key news
Bayer AG - Key offerings
Bayer AG - Segment focus
SWOT

15.6 Can Am Pepper Co. Ltd.

Can Am Pepper Co. Ltd. - Overview
Can Am Pepper Co. Ltd. - Product / Service
Can Am Pepper Co. Ltd. - Key offerings
SWOT

15.7 Conservas La Costena

Conservas La Costena - Overview
Conservas La Costena - Product / Service
Conservas La Costena - Key offerings
SWOT

15.8 Del Monte Foods Inc.

Del Monte Foods Inc. - Overview
Del Monte Foods Inc. - Product / Service
Del Monte Foods Inc. - Key offerings
SWOT

15.9 Eminent Seeds B.V.

Eminent Seeds B.V. - Overview
Eminent Seeds B.V. - Product / Service
Eminent Seeds B.V. - Key offerings
SWOT

15.10 Fresh India Organics LLP

Fresh India Organics LLP - Overview
Fresh India Organics LLP - Product / Service
Fresh India Organics LLP - Key offerings
SWOT

15.11 G and G Peppers LLC

G and G Peppers LLC - Overview
G and G Peppers LLC - Product / Service
G and G Peppers LLC - Key offerings
SWOT

15.12 G. L. Mezzetta Inc.

G. L. Mezzetta Inc. - Overview
G. L. Mezzetta Inc. - Product / Service
G. L. Mezzetta Inc. - Key offerings
SWOT

15.13 Garlic Solutions B.V.

Garlic Solutions B.V. - Overview
Garlic Solutions B.V. - Product / Service
Garlic Solutions B.V. - Key offerings
SWOT

15.14 Mount Dora Farms

Mount Dora Farms - Overview
Mount Dora Farms - Product / Service
Mount Dora Farms - Key offerings
SWOT

15.15 Olam Group Ltd.

Olam Group Ltd. - Overview
Olam Group Ltd. - Business segments
Olam Group Ltd. - Key offerings
Olam Group Ltd. - Segment focus
SWOT

15.16 Roland Foods LLC

Roland Foods LLC - Overview
Roland Foods LLC - Product / Service
Roland Foods LLC - Key offerings
SWOT

15.17 Syngenta Vegetable Seeds

Syngenta Vegetable Seeds - Overview
Syngenta Vegetable Seeds - Product / Service
Syngenta Vegetable Seeds - Key offerings
SWOT

15.18 The Global Green Co. Ltd.

The Global Green Co. Ltd. - Overview
The Global Green Co. Ltd. - Product / Service
The Global Green Co. Ltd. - Key offerings
SWOT

16. Appendix

16.1 Scope of the report

Market definition
Objectives
Notes and caveats

16.2 Inclusions and exclusions checklist

Inclusions checklist
Exclusions checklist

16.3 Currency conversion rates for US$

16.4 Research methodology

16.5 Data procurement

Information sources

16.6 Data validation

16.7 Validation techniques employed for market sizing

16.8 Data synthesis

16.9 360 degree market analysis

16.10 List of abbreviations

Research Methodology

Technavio presents a detailed picture of the market by way of study, synthesis, and summation of data from multiple sources. The analysts have presented the various facets of the market with a particular focus on identifying the key industry influencers. The data thus presented is comprehensive, reliable, and the result of extensive research, both primary and secondary.

INFORMATION SOURCES

Primary sources

  • Manufacturers and suppliers
  • Channel partners
  • Industry experts
  • Strategic decision makers

Secondary sources

  • Industry journals and periodicals
  • Government data
  • Financial reports of key industry players
  • Historical data
  • Press releases

DATA ANALYSIS

Data Synthesis

  • Collation of data
  • Estimation of key figures
  • Analysis of derived insights

Data Validation

  • Triangulation with data models
  • Reference against proprietary databases
  • Corroboration with industry experts

REPORT WRITING

Qualitative

  • Market drivers
  • Market challenges
  • Market trends
  • Five forces analysis

Quantitative

  • Market size and forecast
  • Market segmentation
  • Geographical insights
  • Competitive landscape

Interested in this report?

Get your sample now to see our research methodology and insights!

Download Now

Frequently Asked Questions

Jalapeno Pepper market growth will increase by USD 122434.7 thousand thousand during 2026-2030.

The Jalapeno Pepper market is expected to grow at a CAGR of 3.4% during 2026-2030.

Jalapeno Pepper market is segmented by End-user (Food and beverage, Household, Food processing companies, Others) Distribution channel (Offline, Online) Product type (Fresh jalapenos, Processed jalapenos)

Baloian Packing Co. Inc., Bayer AG, Can Am Pepper Co. Ltd., Conservas La Costena, Del Monte Foods Inc., Eminent Seeds B.V., Fresh India Organics LLP, G and G Peppers LLC, G. L. Mezzetta Inc., Garlic Solutions B.V., Mount Dora Farms, Olam Group Ltd., PC Fresh Co., Pero Family Farms Food Co. LLC, Rich River Produce, Roland Foods LLC, Silva International, Syngenta Vegetable Seeds, The Global Green Co. Ltd., Turer Tarim, We Grow LLC are a few of the key vendors in the Jalapeno Pepper market.

North America will register the highest growth rate of 39.4% among the other regions. Therefore, the Jalapeno Pepper market in North America is expected to garner significant business opportunities for the vendors during the forecast period.

US, Canada, Mexico, Brazil, Argentina, Chile, Germany, UK, France, Italy, Spain, The Netherlands, China, Japan, India, South Korea, Australia, Indonesia, Saudi Arabia, UAE, South Africa, Israel, Turkey

  • Consumer affinity for spicy gastronomy and flavor exploration is the driving factor this market.

The Jalapeno Pepper market vendors should focus on grabbing business opportunities from the End-user segment as it accounted for the largest market share in the base year.
RIA - Research AI Assistant
Ask RIA