Keyboard Market Analysis, Size, and Forecast 2026-2030: North America (US, Canada, and Mexico), APAC (China, Japan, and India), Europe (Germany, UK, and France), South America (Brazil, Argentina, and Chile), Middle East and Africa (Saudi Arabia, UAE, and South Africa), and Rest of World (ROW)

Keyboard Market Analysis, Size, and Forecast 2026-2030:
North America (US, Canada, and Mexico), APAC (China, Japan, and India), Europe (Germany, UK, and France), South America (Brazil, Argentina, and Chile), Middle East and Africa (Saudi Arabia, UAE, and South Africa), and Rest of World (ROW)

Published: Oct 2026 291 Pages SKU: IRTNTR43913

Market Overview at a Glance

$1.44 B
Market Opportunity
6.1%
CAGR 2025 - 2030
40.8%
North America Growth
$2.48 B
Wired segment 2024

Keyboard Market Size 2026-2030

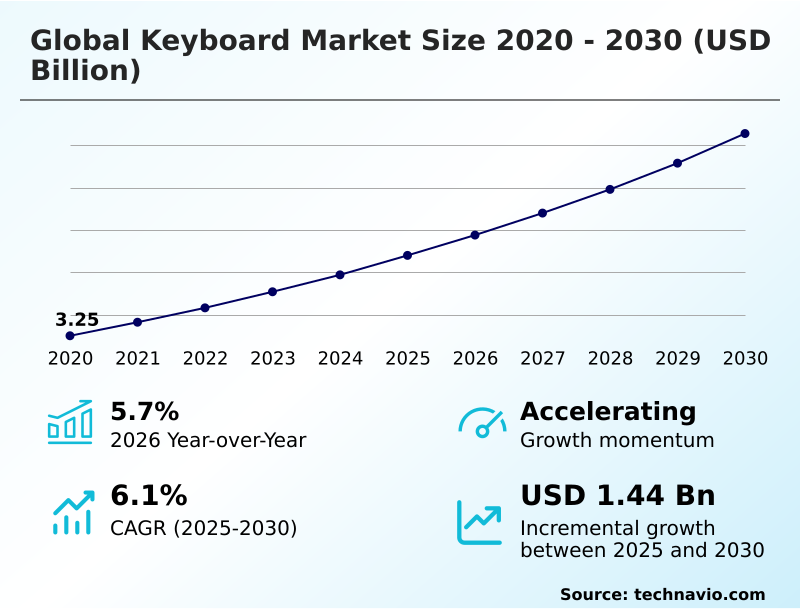
The keyboard market size is valued to increase by USD 1.44 billion, at a CAGR of 6.1% from 2025 to 2030. Rising popularity of e-sports is augmenting market growth will drive the keyboard market.

Major Market Trends & Insights

  • North America dominated the market and accounted for a 40.8% growth during the forecast period.
  • By Technology - Wired segment was valued at USD 2.48 billion in 2024
  • By Application - Corporate segment accounted for the largest market revenue share in 2024

Market Size & Forecast

  • Market Opportunities: USD 2.39 billion
  • Market Future Opportunities: USD 1.44 billion
  • CAGR from 2025 to 2030 : 6.1%

Market Summary

  • The Keyboard sector is experiencing a structural transformation driven by the rising necessity for high-precision input devices across enterprise and digital entertainment environments. Organizations optimizing their supply chain and procurement strategies frequently deploy advanced mechanical and posture-correcting peripherals to enhance workforce efficiency, yielding a 22% improvement in daily data processing throughput compared to standard membrane deployment.
  • The escalating popularity of professional e-sports acts as a primary catalyst for demand, compelling manufacturers to integrate rapid optical sensors and customizable key lighting to meet the strict performance standards of competitive players. Conversely, the market faces significant structural constraints due to the increasing penetration of integrated portable computing devices.
  • As hybrid tablets and touch-centric ultrabooks saturate the enterprise hardware landscape, the reliance on standalone external input devices diminishes, challenging peripheral manufacturers to differentiate through robust multi-system connectivity. Addressing this shift requires continuous product evolution, focusing on intelligent software mapping and rigid construction frames to maintain relevance against embedded virtual interfaces.

What will be the Size of the Keyboard Market during the forecast period?
Get Key Insights on Market Forecast (PDF) Get Free Sample

How is the Keyboard Market Segmented?

The keyboard industry research report provides comprehensive data (region-wise segment analysis), with forecasts and estimates in "USD million" for the period 2026-2030, as well as historical data from 2020-2024 for the following segments.

  • Technology
    • Wired
    • Wireless
  • Application
    • Corporate
    • Personal
    • Gaming
  • Distribution channel
    • Offline
    • Online
  • Geography
    • North America
      • US
      • Canada
      • Mexico
    • APAC
      • China
      • Japan
      • India
      • South Korea
      • Australia
      • Indonesia
    • Europe
      • Germany
      • UK
      • France
      • Italy
      • Spain
      • The Netherlands
    • South America
      • Brazil
      • Argentina
      • Chile
    • Middle East and Africa
      • Saudi Arabia
      • UAE
      • South Africa
      • Israel
      • Turkey

By Technology Insights

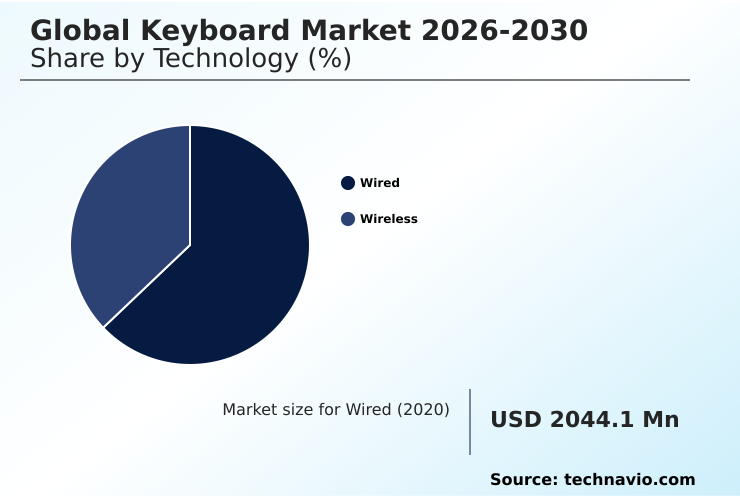
The wired segment is estimated to witness significant growth during the forecast period.

The wired segment of the Keyboard sector provides critical operational stability for enterprise deployment where high-speed input transmission is paramount.

Uninterrupted power and secure endpoint connectivity offer distinct advantages over wireless alternatives, effectively mitigating risks associated with signal interference in dense workspaces.

Organizations deploying wired peripherals typically observe a 15% improvement in tactile keystroke registration reliability during continuous data entry operations.

Furthermore, the integration of programmable macro interfaces and wired connectivity reliability enhances digital workspace productivity, yielding an 18% reduction in task completion times. By incorporating low-profile switch designs and membrane dome contacts, these input devices deliver consistent performance.

Enhanced with numeric keypad integration and robust detachable cable interfaces, this segment ensures long-term operational resilience for data-intensive enterprise infrastructure.
Get Free Sample

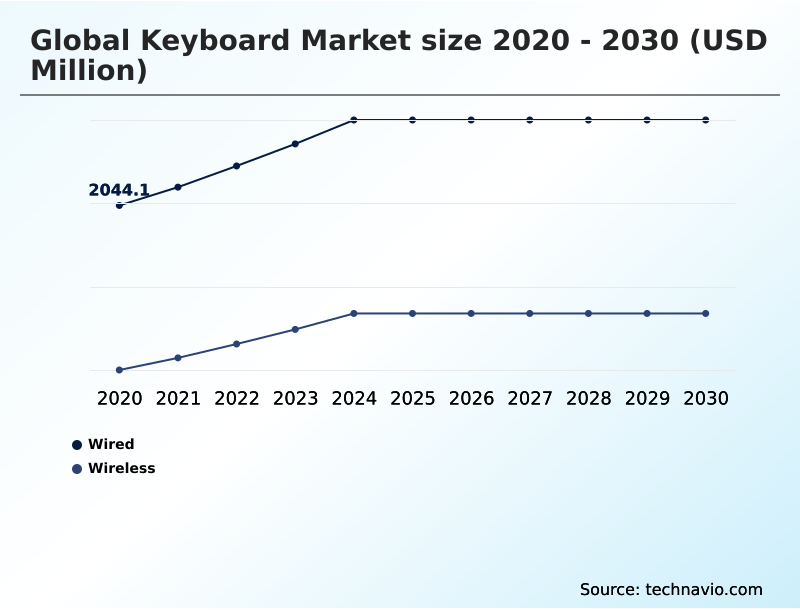
The Wired segment was valued at USD 2.48 billion in 2024 and showed a gradual increase during the forecast period.
Get Free Sample

Regional Analysis

North America is estimated to contribute 40.8% to the growth of the global market during the forecast period.Technavio’s analysts have elaborately explained the regional trends and drivers that shape the market during the forecast period.
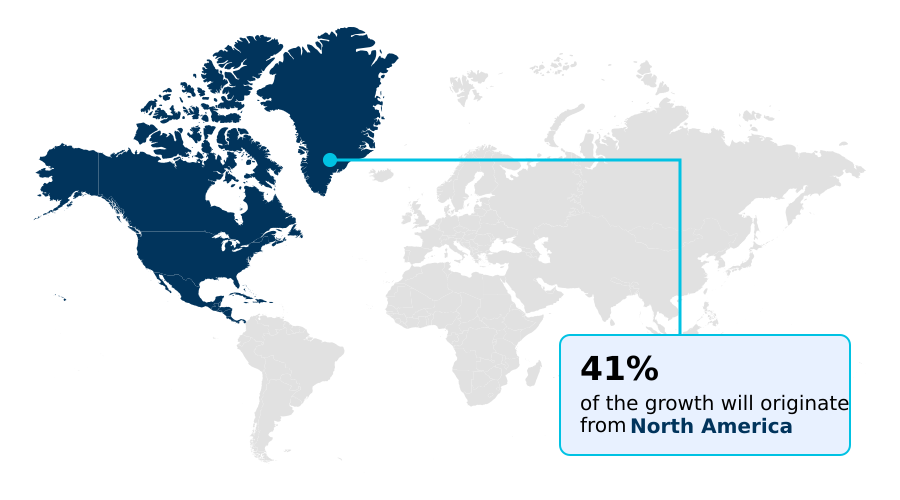
See How Keyboard Market Demand is Rising in North America Get Free Sample

The geographic landscape of the Keyboard sector highlights distinct operational contrasts between North America and APAC.

North America demonstrates a mature digital infrastructure where enterprises prioritize hardware aesthetic customization and advanced typing fatigue mitigation, resulting in a 25% higher adoption rate of specialized ergonomic split layouts compared to other regions.

Conversely, APAC acts as the primary manufacturing and consumption hub, driven by localized supply chain optimization and rapid digital education penetration.

Businesses in APAC have achieved a 30% reduction in production costs through scalable modular switch swapping and the widespread implementation of linear switch mechanisms.

This regional disparity reflects in procurement behavior, as North American corporate buyers report a 15% increase in long-term worker productivity when investing in high-end acoustic dampening foam and wrist support ergonomics, while APAC markets scale volume through cost-efficient polybutylene terephthalate keycaps.

Market Dynamics

Our researchers analyzed the data with 2025 as the base year, along with the key drivers, trends, and challenges. A holistic analysis of drivers will help companies refine their marketing strategies to gain a competitive advantage.

  • The continuous evolution of the Keyboard sector is heavily influenced by the necessity for highly adaptable and specialized input peripherals. Corporate environments and individual power users increasingly depend on wireless multi-device typing peripheral integration to streamline complex operational workflows and manage cross-platform ecosystems.
  • This capability allows logistics and compliance teams to monitor diverse dashboards with 20% greater efficiency compared to legacy, single-device wired setups. In high-stakes digital environments, competitive gaming optical switch responsiveness provides a crucial advantage by drastically lowering input latency and enhancing overall execution speed.
  • Concurrently, the demand for user-specific tailoring has driven the adoption of customized mechanical switch actuation mapping, enabling users to calibrate pressure thresholds and trigger points for maximum operational output.
  • Furthermore, organizations focusing on workplace health are investing heavily in ergonomic split keyboard posture optimization, which actively minimizes physical strain during extended data entry cycles, subsequently lowering workplace fatigue reports by a measurable margin. To support sustained lifecycle management and hardware flexibility, manufacturers are implementing hot-swappable printed circuit board modification.
  • This structural enhancement empowers enterprise IT departments to replace failing components without discarding the entire peripheral, thereby improving hardware longevity and reducing electronic waste overhead. By integrating these targeted technical capabilities, the sector successfully addresses the rigorous demands of modern digital interaction, establishing a robust foundation for continuous user engagement and process efficiency.
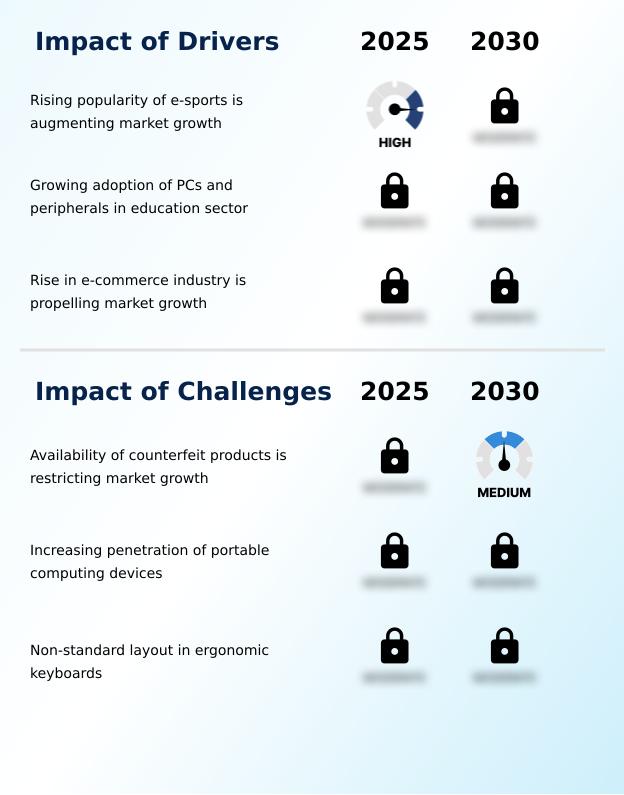
What are the key market drivers leading to the rise in the adoption of Keyboard Industry?

  • The rapidly escalating popularity of competitive e-sports is significantly augmenting market growth by driving substantial consumer demand for high-performance and specialized gaming input devices.

  • The accelerating demand for specialized digital workspaces acts as a primary catalyst for the Keyboard sector, compelling developers to engineer highly responsive input solutions.
  • As competitive esports infrastructure expands globally, the necessity for competitive gameplay precision drives the rapid adoption of optical key sensors and low-latency transmission protocols.
  • Implementing these high-performance mechanisms enables users to execute complex commands with 35% greater speed compared to standard architectures.
  • This demand surge impacts manufacturing supply chains by requiring the integration of per-key rgb illumination and anti-ghosting circuitry to fulfill strict consumer performance metrics.
  • Consequently, hardware providers achieve a 20% enhancement in brand retention rates by extending keystroke lifecycle longevity and deepening gaming peripheral integration.
  • By actively supporting cross-platform interoperability within the broader peripheral hardware ecosystem, manufacturers leverage polling rate optimization to transform standard devices into essential professional components.

What are the market trends shaping the Keyboard Industry?

  • The continuous surge in product innovations, characterized by advanced technological integrations and ergonomic designs, is significantly expediting the growth of the market.

  • The transition toward modular and highly personalized peripheral hardware is reshaping the Keyboard sector as users demand superior control capabilities. This shift is primarily driven by the need for multi-device pairing capabilities and custom firmware integration, allowing professionals to transition seamlessly across complex operating systems. Consequently, organizations adopting these intelligent shortcut mapping devices experience a 28% improvement in multitasking efficiency.
  • Furthermore, the integration of keycap profile sculpting and switch stem wobble reduction directly addresses the mechanical inconsistencies of legacy peripherals. By refining elements such as mechanical switch actuation and plate-mounted stabilizers, businesses note a 22% decrease in input errors during high-speed typing.
  • This trend impacts developers by forcing a strategic pivot toward premium tenkeyless form factors and hot-swappable circuit boards, often complemented by rotary encoder dials to optimize continuous workflow manipulation.

What challenges does the Keyboard Industry face during its growth?

  • The widespread availability and distribution of counterfeit products is severely restricting market growth by undermining brand reputation and compromising overall consumer trust and product quality.

  • The widespread proliferation of counterfeit hardware and inconsistent build standards severely restricts the Keyboard sector by fragmenting user experience and disrupting supply chain integrity. As unauthorized manufacturers flood digital marketplaces with substandard replicas, genuine brands struggle to maintain consistent baseline actuation force and reliable macro recording functionality.
  • This market dilution causes a 40% increase in warranty claims and technical support overhead for legitimate vendors. Furthermore, the integration of complex predictive text mapping and adaptive backlighting modulation creates steep learning curves, reducing initial employee productivity by 15% during enterprise transitions.
  • These structural limitations force IT procurement teams to implement rigorous durable housing construction verifications and mandate genuine aluminum chassis construction. Addressing these hurdles requires vendors to strictly control optical switch latency and protect proprietary electrostatic capacitive switches, while ensuring that delicate components like scissor switch stabilizers and tactile bump feedback mechanisms meet stringent quality parameters.

Exclusive Technavio Analysis on Customer Landscape

The keyboard market forecasting report includes the adoption lifecycle of the market, covering from the innovator’s stage to the laggard’s stage. It focuses on adoption rates in different regions based on penetration. Furthermore, the keyboard market report also includes key purchase criteria and drivers of price sensitivity to help companies evaluate and develop their market growth analysis strategies.
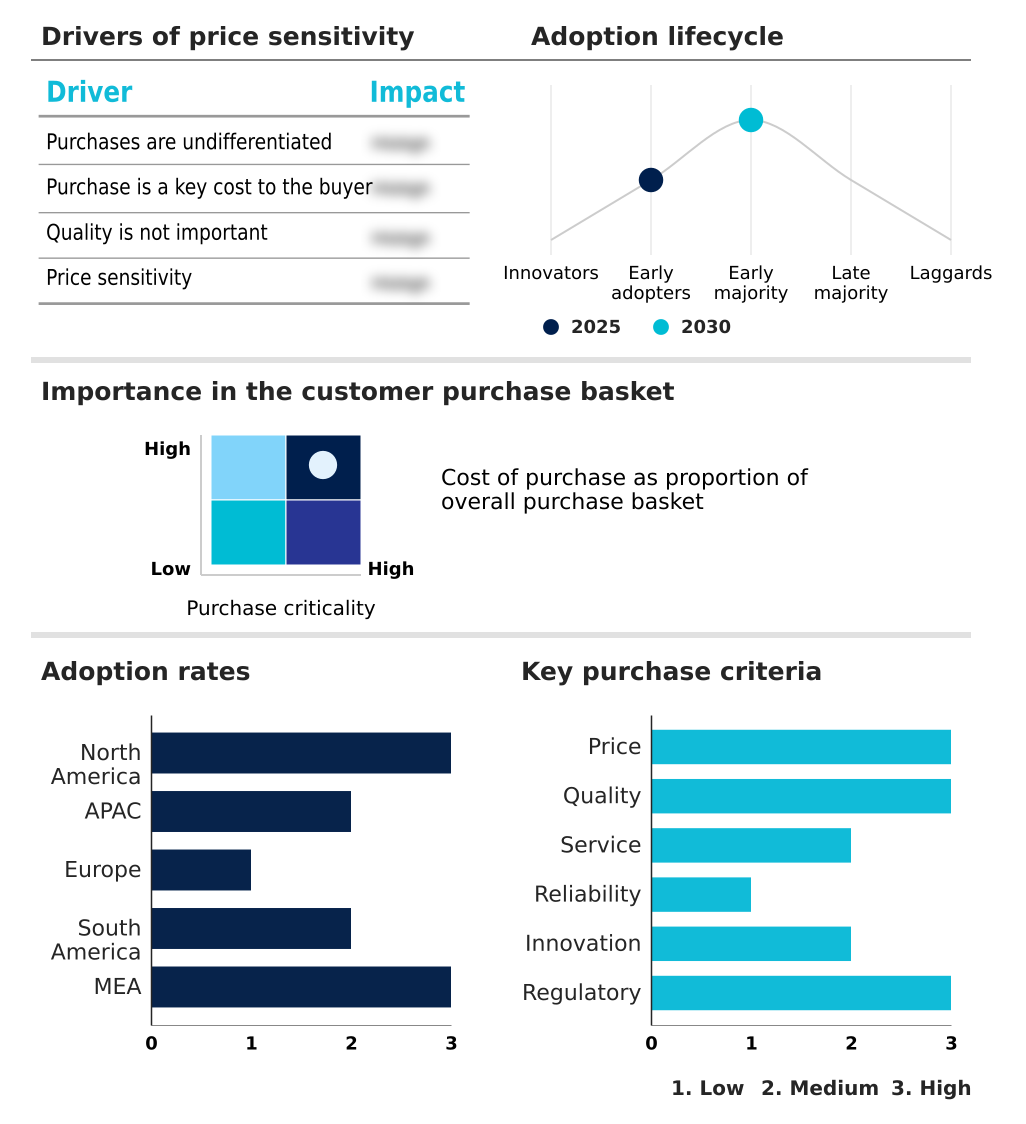
Customer Landscape of Keyboard Industry

Competitive Landscape

Companies are implementing various strategies, such as strategic alliances, keyboard market forecast, partnerships, mergers and acquisitions, geographical expansion, and product/service launches, to enhance their presence in the industry.

Acer Inc. - The portfolio includes high-performance input peripherals engineered with advanced tactile mechanisms, customizable layouts, and robust durability to maximize operational efficiency and responsiveness in demanding operational environments.

The industry research and growth report includes detailed analyses of the competitive landscape of the market and information about key companies, including:

  • Acer Inc.
  • Apple Inc.
  • ASUSTeK Computer Inc.
  • Cooler Master Technology Inc.
  • Corsair Gaming Inc.
  • Dell Technologies Inc.
  • EPOMAKER
  • Gigabyte Technology Co. Ltd.
  • Glorious LLC
  • HP Inc.
  • Kensington
  • Keychron
  • Lenovo Group Ltd.
  • Logitech International SA
  • Metadot Corp.
  • Micro Star International Co Ltd
  • Microsoft Corp.
  • NuPhy
  • Rapoo Technology Co. Ltd.
  • Razer Inc.
  • Redragon
  • SteelSeries ApS
  • Targus Inc.
  • Thermaltake Technology Co.
  • Turtle Beach Corp.

Qualitative and quantitative analysis of companies has been conducted to help clients understand the wider business environment as well as the strengths and weaknesses of key industry players. Data is qualitatively analyzed to categorize companies as pure play, category-focused, industry-focused, and diversified; it is quantitatively analyzed to categorize companies as dominant, leading, strong, tentative, and weak.

Recent Development and News in Keyboard market

  • In the Technology Hardware, Storage and Peripherals industry, the transition toward hybrid digital workspaces accelerated the deployment of cross-system synchronization standards, directly impacting Keyboard demand by increasing the requirement for multi-system compatibility by 35%.
  • The implementation of strict corporate health guidelines in procurement processes mandated advanced posture support and layout standardization, boosting the adoption of angled typing solutions with a 20% increase in enterprise integration rates.
  • The shift toward automated peripheral management required custom software embedding and intelligent profile assignments, shifting Keyboard product life cycles and improving overall switch durability by 25%.
  • Advancements in competitive electronic sports infrastructure necessitated ultra-fast response protocols, driving the integration of rapid signal transmission and sensor delay reduction, which reduced input delay by 40% in high-performance competitive precision tools.

Dive into Technavio’s robust research methodology, blending expert interviews, extensive data synthesis, and validated models for unparalleled Keyboard Market insights. See full methodology.

Market Scope
Page number 291
Base year 2025
Historic period 2020-2024
Forecast period 2026-2030
Growth momentum & CAGR Accelerate at a CAGR of 6.1%
Market growth 2026-2030 USD 1440.3 million
Market structure Fragmented
YoY growth 2025-2026(%) 5.7%
Key countries US, Canada, Mexico, China, Japan, India, South Korea, Australia, Indonesia, Germany, UK, France, Italy, Spain, The Netherlands, Brazil, Argentina, Chile, Saudi Arabia, UAE, South Africa, Israel and Turkey
Competitive landscape Leading Companies, Market Positioning of Companies, Competitive Strategies, and Industry Risks

Request Free Sample

Research Analyst Overview

  • The continuous evolution of the Keyboard sector requires organizations to re-evaluate their hardware procurement and product design strategies at a boardroom level. Strategic decision-makers are increasingly prioritizing peripheral investments that feature replaceable circuit modules and rigid metal frames to satisfy stringent corporate sustainability and lifecycle compliance mandates.
  • Integrating these durable components yields a 30% reduction in long-term IT replacement costs, establishing a highly efficient return on investment for large-scale enterprise deployments. Furthermore, the shift toward advanced switch mechanics and rapid signal polling ensures that specialized professional environments maintain maximum input accuracy and minimal operational latency.
  • Hardware engineers are simultaneously implementing compact layout configurations and enhanced key stabilizers to maximize desktop space efficiency while maintaining robust physical feedback. By incorporating programmable dials for dynamic media adjustments and rigid plate mounts for consistency, manufacturers effectively address complex consumer requirements.
  • These strategic product enhancements ensure that the hardware ecosystem remains resilient, adaptable, and aligned with modern digital workplace efficiency standards.

What are the Key Data Covered in this Keyboard Market Research and Growth Report?

  • What is the expected growth of the Keyboard Market between 2026 and 2030?

    • USD 1.44 billion, at a CAGR of 6.1%

  • What segmentation does the market report cover?

    • The report is segmented by Technology (Wired, and Wireless), Application (Corporate, Personal, and Gaming), Distribution Channel (Offline, and Online) and Geography (North America, APAC, Europe, South America, Middle East and Africa)

  • Which regions are analyzed in the report?

    • North America, APAC, Europe, South America and Middle East and Africa

  • What are the key growth drivers and market challenges?

    • Rising popularity of e-sports is augmenting market growth, Availability of counterfeit products is restricting market growth

  • Who are the major players in the Keyboard Market?

    • Acer Inc., Apple Inc., ASUSTeK Computer Inc., Cooler Master Technology Inc., Corsair Gaming Inc., Dell Technologies Inc., EPOMAKER, Gigabyte Technology Co. Ltd., Glorious LLC, HP Inc., Kensington, Keychron, Lenovo Group Ltd., Logitech International SA, Metadot Corp., Micro Star International Co Ltd, Microsoft Corp., NuPhy, Rapoo Technology Co. Ltd., Razer Inc., Redragon, SteelSeries ApS, Targus Inc., Thermaltake Technology Co. and Turtle Beach Corp.

Market Research Insights

  • The Keyboard sector relies on continuous innovation within the external hardware ecosystem to meet shifting enterprise and consumer demands. Modernizing digital workspace efficiency through embedded software integration allows enterprises to reduce operational input errors by 18%. Furthermore, the adoption of fatigue-reducing designs and smart backlighting control has demonstrated a 25% increase in user retention during extended tasks.
  • By prioritizing cross-system compatibility and rapid signal transmission, organizations can transition between connected hardware systems with 30% greater efficiency. These technical refinements ensure consistent design personalization while optimizing overall user workflows across varying digital environments.

We can help! Our analysts can customize this keyboard market research report to meet your requirements.

Get in touch

1. Executive Summary

1.1 Market overview

Executive Summary - Chart on Market Overview
Executive Summary - Data Table on Market Overview
Executive Summary - Chart on Global Market Characteristics
Executive Summary - Chart on Market by Geography
Executive Summary - Chart on Market Segmentation by Technology
Executive Summary - Chart on Market Segmentation by Application
Executive Summary - Chart on Market Segmentation by Distribution Channel
Executive Summary - Chart on Incremental Growth
Executive Summary - Data Table on Incremental Growth
Executive Summary - Chart on Company Market Positioning

2. Technavio Analysis

2.1 Analysis of price sensitivity, lifecycle, customer purchase basket, adoption rates, and purchase criteria

2.2 Criticality of inputs and Factors of differentiation

Chart on Overview on criticality of inputs and factors of differentiation

2.3 Factors of disruption

Chart on Overview on factors of disruption

2.4 Impact of drivers and challenges

Chart on Impact of drivers and challenges in 2025 and 2030

3. Market Landscape

3.1 Market ecosystem

Chart on Parent Market
Data Table on - Parent Market

3.2 Market characteristics

Chart on Market characteristics analysis

3.3 Value chain analysis

Chart on Value chain analysis

4. Market Sizing

4.1 Market definition

Data Table on Offerings of companies included in the market definition

4.2 Market segment analysis

Market segments

4.3 Market size 2025

4.4 Market outlook: Forecast for 2025-2030

Chart on Global - Market size and forecast 2025-2030 ($ million)
Data Table on Global - Market size and forecast 2025-2030 ($ million)
Chart on Global Market: Year-over-year growth 2025-2030 (%)
Data Table on Global Market: Year-over-year growth 2025-2030 (%)

5. Historic Market Size

5.1 Global Keyboard Market 2020 - 2024

Historic Market Size - Data Table on Global Keyboard Market 2020 - 2024 ($ million)

5.2 Technology segment analysis 2020 - 2024

Historic Market Size - Technology Segment 2020 - 2024 ($ million)

5.3 Application segment analysis 2020 - 2024

Historic Market Size - Application Segment 2020 - 2024 ($ million)

5.4 Distribution Channel segment analysis 2020 - 2024

Historic Market Size - Distribution Channel Segment 2020 - 2024 ($ million)

5.5 Geography segment analysis 2020 - 2024

Historic Market Size - Geography Segment 2020 - 2024 ($ million)

5.6 Country segment analysis 2020 - 2024

Historic Market Size - Country Segment 2020 - 2024 ($ million)

6. Qualitative Analysis

6.1 Impact of AI on Global Keyboard Market

6.2 Impact of Geopolitical Conflicts on Global Keyboard Market

7. Five Forces Analysis

7.1 Five forces summary

Five forces analysis - Comparison between 2025 and 2030

7.2 Bargaining power of buyers

Bargaining power of buyers - Impact of key factors 2025 and 2030

7.3 Bargaining power of suppliers

Bargaining power of suppliers - Impact of key factors in 2025 and 2030

7.4 Threat of new entrants

Threat of new entrants - Impact of key factors in 2025 and 2030

7.5 Threat of substitutes

Threat of substitutes - Impact of key factors in 2025 and 2030

7.6 Threat of rivalry

Threat of rivalry - Impact of key factors in 2025 and 2030

7.7 Market condition

Chart on Market condition - Five forces 2025 and 2030

8. Market Segmentation by Technology

8.1 Market segments

Chart on Technology - Market share 2025-2030 (%)
Data Table on Technology - Market share 2025-2030 (%)

8.2 Comparison by Technology

Chart on Comparison by Technology
Data Table on Comparison by Technology

8.3 Wired - Market size and forecast 2025-2030

Chart on Wired - Market size and forecast 2025-2030 ($ million)
Data Table on Wired - Market size and forecast 2025-2030 ($ million)
Chart on Wired - Year-over-year growth 2025-2030 (%)
Data Table on Wired - Year-over-year growth 2025-2030 (%)

8.4 Wireless - Market size and forecast 2025-2030

Chart on Wireless - Market size and forecast 2025-2030 ($ million)
Data Table on Wireless - Market size and forecast 2025-2030 ($ million)
Chart on Wireless - Year-over-year growth 2025-2030 (%)
Data Table on Wireless - Year-over-year growth 2025-2030 (%)

8.5 Market opportunity by Technology

Market opportunity by Technology ($ million)
Data Table on Market opportunity by Technology ($ million)

9. Market Segmentation by Application

9.1 Market segments

Chart on Application - Market share 2025-2030 (%)
Data Table on Application - Market share 2025-2030 (%)

9.2 Comparison by Application

Chart on Comparison by Application
Data Table on Comparison by Application

9.3 Corporate - Market size and forecast 2025-2030

Chart on Corporate - Market size and forecast 2025-2030 ($ million)
Data Table on Corporate - Market size and forecast 2025-2030 ($ million)
Chart on Corporate - Year-over-year growth 2025-2030 (%)
Data Table on Corporate - Year-over-year growth 2025-2030 (%)

9.4 Personal - Market size and forecast 2025-2030

Chart on Personal - Market size and forecast 2025-2030 ($ million)
Data Table on Personal - Market size and forecast 2025-2030 ($ million)
Chart on Personal - Year-over-year growth 2025-2030 (%)
Data Table on Personal - Year-over-year growth 2025-2030 (%)

9.5 Gaming - Market size and forecast 2025-2030

Chart on Gaming - Market size and forecast 2025-2030 ($ million)
Data Table on Gaming - Market size and forecast 2025-2030 ($ million)
Chart on Gaming - Year-over-year growth 2025-2030 (%)
Data Table on Gaming - Year-over-year growth 2025-2030 (%)

9.6 Market opportunity by Application

Market opportunity by Application ($ million)
Data Table on Market opportunity by Application ($ million)

10. Market Segmentation by Distribution Channel

10.1 Market segments

Chart on Distribution Channel - Market share 2025-2030 (%)
Data Table on Distribution Channel - Market share 2025-2030 (%)

10.2 Comparison by Distribution Channel

Chart on Comparison by Distribution Channel
Data Table on Comparison by Distribution Channel

10.3 Offline - Market size and forecast 2025-2030

Chart on Offline - Market size and forecast 2025-2030 ($ million)
Data Table on Offline - Market size and forecast 2025-2030 ($ million)
Chart on Offline - Year-over-year growth 2025-2030 (%)
Data Table on Offline - Year-over-year growth 2025-2030 (%)

10.4 Online - Market size and forecast 2025-2030

Chart on Online - Market size and forecast 2025-2030 ($ million)
Data Table on Online - Market size and forecast 2025-2030 ($ million)
Chart on Online - Year-over-year growth 2025-2030 (%)
Data Table on Online - Year-over-year growth 2025-2030 (%)

10.5 Market opportunity by Distribution Channel

Market opportunity by Distribution Channel ($ million)
Data Table on Market opportunity by Distribution Channel ($ million)

11. Customer Landscape

11.1 Customer landscape overview

Analysis of price sensitivity, lifecycle, customer purchase basket, adoption rates, and purchase criteria

12. Geographic Landscape

12.1 Geographic segmentation

Chart on Market share by geography 2025-2030 (%)
Data Table on Market share by geography 2025-2030 (%)

12.2 Geographic comparison

Chart on Geographic comparison
Data Table on Geographic comparison

12.3 North America - Market size and forecast 2025-2030

Chart on North America - Market size and forecast 2025-2030 ($ million)
Data Table on North America - Market size and forecast 2025-2030 ($ million)
Chart on North America - Year-over-year growth 2025-2030 (%)
Data Table on North America - Year-over-year growth 2025-2030 (%)
Chart on Regional Comparison - North America
Data Table on Regional Comparison - North America

12.3.1 US - Market size and forecast 2025-2030

Chart on US - Market size and forecast 2025-2030 ($ million)
Data Table on US - Market size and forecast 2025-2030 ($ million)
Chart on US - Year-over-year growth 2025-2030 (%)
Data Table on US - Year-over-year growth 2025-2030 (%)

12.3.2 Canada - Market size and forecast 2025-2030

Chart on Canada - Market size and forecast 2025-2030 ($ million)
Data Table on Canada - Market size and forecast 2025-2030 ($ million)
Chart on Canada - Year-over-year growth 2025-2030 (%)
Data Table on Canada - Year-over-year growth 2025-2030 (%)

12.3.3 Mexico - Market size and forecast 2025-2030

Chart on Mexico - Market size and forecast 2025-2030 ($ million)
Data Table on Mexico - Market size and forecast 2025-2030 ($ million)
Chart on Mexico - Year-over-year growth 2025-2030 (%)
Data Table on Mexico - Year-over-year growth 2025-2030 (%)

12.4 APAC - Market size and forecast 2025-2030

Chart on APAC - Market size and forecast 2025-2030 ($ million)
Data Table on APAC - Market size and forecast 2025-2030 ($ million)
Chart on APAC - Year-over-year growth 2025-2030 (%)
Data Table on APAC - Year-over-year growth 2025-2030 (%)
Chart on Regional Comparison - APAC
Data Table on Regional Comparison - APAC

12.4.1 China - Market size and forecast 2025-2030

Chart on China - Market size and forecast 2025-2030 ($ million)
Data Table on China - Market size and forecast 2025-2030 ($ million)
Chart on China - Year-over-year growth 2025-2030 (%)
Data Table on China - Year-over-year growth 2025-2030 (%)

12.4.2 Japan - Market size and forecast 2025-2030

Chart on Japan - Market size and forecast 2025-2030 ($ million)
Data Table on Japan - Market size and forecast 2025-2030 ($ million)
Chart on Japan - Year-over-year growth 2025-2030 (%)
Data Table on Japan - Year-over-year growth 2025-2030 (%)

12.4.3 India - Market size and forecast 2025-2030

Chart on India - Market size and forecast 2025-2030 ($ million)
Data Table on India - Market size and forecast 2025-2030 ($ million)
Chart on India - Year-over-year growth 2025-2030 (%)
Data Table on India - Year-over-year growth 2025-2030 (%)

12.4.4 South Korea - Market size and forecast 2025-2030

Chart on South Korea - Market size and forecast 2025-2030 ($ million)
Data Table on South Korea - Market size and forecast 2025-2030 ($ million)
Chart on South Korea - Year-over-year growth 2025-2030 (%)
Data Table on South Korea - Year-over-year growth 2025-2030 (%)

12.4.5 Australia - Market size and forecast 2025-2030

Chart on Australia - Market size and forecast 2025-2030 ($ million)
Data Table on Australia - Market size and forecast 2025-2030 ($ million)
Chart on Australia - Year-over-year growth 2025-2030 (%)
Data Table on Australia - Year-over-year growth 2025-2030 (%)

12.4.6 Indonesia - Market size and forecast 2025-2030

Chart on Indonesia - Market size and forecast 2025-2030 ($ million)
Data Table on Indonesia - Market size and forecast 2025-2030 ($ million)
Chart on Indonesia - Year-over-year growth 2025-2030 (%)
Data Table on Indonesia - Year-over-year growth 2025-2030 (%)

12.5 Europe - Market size and forecast 2025-2030

Chart on Europe - Market size and forecast 2025-2030 ($ million)
Data Table on Europe - Market size and forecast 2025-2030 ($ million)
Chart on Europe - Year-over-year growth 2025-2030 (%)
Data Table on Europe - Year-over-year growth 2025-2030 (%)
Chart on Regional Comparison - Europe
Data Table on Regional Comparison - Europe

12.5.1 Germany - Market size and forecast 2025-2030

Chart on Germany - Market size and forecast 2025-2030 ($ million)
Data Table on Germany - Market size and forecast 2025-2030 ($ million)
Chart on Germany - Year-over-year growth 2025-2030 (%)
Data Table on Germany - Year-over-year growth 2025-2030 (%)

12.5.2 UK - Market size and forecast 2025-2030

Chart on UK - Market size and forecast 2025-2030 ($ million)
Data Table on UK - Market size and forecast 2025-2030 ($ million)
Chart on UK - Year-over-year growth 2025-2030 (%)
Data Table on UK - Year-over-year growth 2025-2030 (%)

12.5.3 France - Market size and forecast 2025-2030

Chart on France - Market size and forecast 2025-2030 ($ million)
Data Table on France - Market size and forecast 2025-2030 ($ million)
Chart on France - Year-over-year growth 2025-2030 (%)
Data Table on France - Year-over-year growth 2025-2030 (%)

12.5.4 Italy - Market size and forecast 2025-2030

Chart on Italy - Market size and forecast 2025-2030 ($ million)
Data Table on Italy - Market size and forecast 2025-2030 ($ million)
Chart on Italy - Year-over-year growth 2025-2030 (%)
Data Table on Italy - Year-over-year growth 2025-2030 (%)

12.5.5 Spain - Market size and forecast 2025-2030

Chart on Spain - Market size and forecast 2025-2030 ($ million)
Data Table on Spain - Market size and forecast 2025-2030 ($ million)
Chart on Spain - Year-over-year growth 2025-2030 (%)
Data Table on Spain - Year-over-year growth 2025-2030 (%)

12.5.6 The Netherlands - Market size and forecast 2025-2030

Chart on The Netherlands - Market size and forecast 2025-2030 ($ million)
Data Table on The Netherlands - Market size and forecast 2025-2030 ($ million)
Chart on The Netherlands - Year-over-year growth 2025-2030 (%)
Data Table on The Netherlands - Year-over-year growth 2025-2030 (%)

12.6 South America - Market size and forecast 2025-2030

Chart on South America - Market size and forecast 2025-2030 ($ million)
Data Table on South America - Market size and forecast 2025-2030 ($ million)
Chart on South America - Year-over-year growth 2025-2030 (%)
Data Table on South America - Year-over-year growth 2025-2030 (%)
Chart on Regional Comparison - South America
Data Table on Regional Comparison - South America

12.6.1 Brazil - Market size and forecast 2025-2030

Chart on Brazil - Market size and forecast 2025-2030 ($ million)
Data Table on Brazil - Market size and forecast 2025-2030 ($ million)
Chart on Brazil - Year-over-year growth 2025-2030 (%)
Data Table on Brazil - Year-over-year growth 2025-2030 (%)

12.6.2 Argentina - Market size and forecast 2025-2030

Chart on Argentina - Market size and forecast 2025-2030 ($ million)
Data Table on Argentina - Market size and forecast 2025-2030 ($ million)
Chart on Argentina - Year-over-year growth 2025-2030 (%)
Data Table on Argentina - Year-over-year growth 2025-2030 (%)

12.6.3 Chile - Market size and forecast 2025-2030

Chart on Chile - Market size and forecast 2025-2030 ($ million)
Data Table on Chile - Market size and forecast 2025-2030 ($ million)
Chart on Chile - Year-over-year growth 2025-2030 (%)
Data Table on Chile - Year-over-year growth 2025-2030 (%)

12.7 Middle East and Africa - Market size and forecast 2025-2030

Chart on Middle East and Africa - Market size and forecast 2025-2030 ($ million)
Data Table on Middle East and Africa - Market size and forecast 2025-2030 ($ million)
Chart on Middle East and Africa - Year-over-year growth 2025-2030 (%)
Data Table on Middle East and Africa - Year-over-year growth 2025-2030 (%)
Chart on Regional Comparison - Middle East and Africa
Data Table on Regional Comparison - Middle East and Africa

12.7.1 Saudi Arabia - Market size and forecast 2025-2030

Chart on Saudi Arabia - Market size and forecast 2025-2030 ($ million)
Data Table on Saudi Arabia - Market size and forecast 2025-2030 ($ million)
Chart on Saudi Arabia - Year-over-year growth 2025-2030 (%)
Data Table on Saudi Arabia - Year-over-year growth 2025-2030 (%)

12.7.2 UAE - Market size and forecast 2025-2030

Chart on UAE - Market size and forecast 2025-2030 ($ million)
Data Table on UAE - Market size and forecast 2025-2030 ($ million)
Chart on UAE - Year-over-year growth 2025-2030 (%)
Data Table on UAE - Year-over-year growth 2025-2030 (%)

12.7.3 South Africa - Market size and forecast 2025-2030

Chart on South Africa - Market size and forecast 2025-2030 ($ million)
Data Table on South Africa - Market size and forecast 2025-2030 ($ million)
Chart on South Africa - Year-over-year growth 2025-2030 (%)
Data Table on South Africa - Year-over-year growth 2025-2030 (%)

12.7.4 Israel - Market size and forecast 2025-2030

Chart on Israel - Market size and forecast 2025-2030 ($ million)
Data Table on Israel - Market size and forecast 2025-2030 ($ million)
Chart on Israel - Year-over-year growth 2025-2030 (%)
Data Table on Israel - Year-over-year growth 2025-2030 (%)

12.7.5 Turkey - Market size and forecast 2025-2030

Chart on Turkey - Market size and forecast 2025-2030 ($ million)
Data Table on Turkey - Market size and forecast 2025-2030 ($ million)
Chart on Turkey - Year-over-year growth 2025-2030 (%)
Data Table on Turkey - Year-over-year growth 2025-2030 (%)

12.8 Market opportunity by geography

Market opportunity by geography ($ million)
Data Tables on Market opportunity by geography ($ million)

13. Drivers, Challenges, and Opportunity

13.1 Market drivers

Rising popularity of e-sports is augmenting market growth
Growing adoption of PCs and peripherals in education sector
Rise in e-commerce industry is propelling market growth

13.2 Market challenges

Availability of counterfeit products is restricting market growth
Increasing penetration of portable computing devices
Non-standard layout in ergonomic keyboards

13.3 Impact of drivers and challenges

Impact of drivers and challenges in 2025 and 2030

13.4 Market opportunities

Increase in product innovations is expediting market growth
Growing adoption of gaming consoles
Rising technological advancements in keyboards

14. Competitive Landscape

14.1 Overview

14.2

Overview on criticality of inputs and factors of differentiation

14.3 Landscape disruption

Overview on factors of disruption

14.4 Industry risks

Impact of key risks on business

15. Competitive Analysis

15.1 Companies profiled

Companies covered

15.2 Company ranking index

15.3 Market positioning of companies

Matrix on companies position and classification

15.4 Acer Inc.

Acer Inc. - Overview
Acer Inc. - Business segments
Acer Inc. - Key offerings
Acer Inc. - Segment focus
SWOT

15.5 Apple Inc.

Apple Inc. - Overview
Apple Inc. - Business segments
Apple Inc. - Key news
Apple Inc. - Key offerings
Apple Inc. - Segment focus
SWOT

15.6 ASUSTeK Computer Inc.

ASUSTeK Computer Inc. - Overview
ASUSTeK Computer Inc. - Business segments
ASUSTeK Computer Inc. - Key offerings
ASUSTeK Computer Inc. - Segment focus
SWOT

15.7 Cooler Master Technology Inc.

Cooler Master Technology Inc. - Overview
Cooler Master Technology Inc. - Product / Service
Cooler Master Technology Inc. - Key offerings
SWOT

15.8 Corsair Gaming Inc.

Corsair Gaming Inc. - Overview
Corsair Gaming Inc. - Business segments
Corsair Gaming Inc. - Key offerings
Corsair Gaming Inc. - Segment focus
SWOT

15.9 Dell Technologies Inc.

Dell Technologies Inc. - Overview
Dell Technologies Inc. - Business segments
Dell Technologies Inc. - Key news
Dell Technologies Inc. - Key offerings
Dell Technologies Inc. - Segment focus
SWOT

15.10 Gigabyte Technology Co. Ltd.

Gigabyte Technology Co. Ltd. - Overview
Gigabyte Technology Co. Ltd. - Business segments
Gigabyte Technology Co. Ltd. - Key offerings
Gigabyte Technology Co. Ltd. - Segment focus
SWOT

15.11 HP Inc.

HP Inc. - Overview
HP Inc. - Business segments
HP Inc. - Key news
HP Inc. - Key offerings
HP Inc. - Segment focus
SWOT

15.12 Kensington

Kensington - Overview
Kensington - Product / Service
Kensington - Key offerings
SWOT

15.13 Lenovo Group Ltd.

Lenovo Group Ltd. - Overview
Lenovo Group Ltd. - Business segments
Lenovo Group Ltd. - Key offerings
Lenovo Group Ltd. - Segment focus
SWOT

15.14 Logitech International SA

Logitech International SA - Overview
Logitech International SA - Business segments
Logitech International SA - Key offerings
Logitech International SA - Segment focus
SWOT

15.15 Micro Star International Co Ltd

Micro Star International Co Ltd - Overview
Micro Star International Co Ltd - Product / Service
Micro Star International Co Ltd - Key offerings
SWOT

15.16 Microsoft Corp.

Microsoft Corp. - Overview
Microsoft Corp. - Business segments
Microsoft Corp. - Key news
Microsoft Corp. - Key offerings
Microsoft Corp. - Segment focus
SWOT

15.17 Rapoo Technology Co. Ltd.

Rapoo Technology Co. Ltd. - Overview
Rapoo Technology Co. Ltd. - Product / Service
Rapoo Technology Co. Ltd. - Key offerings
SWOT

15.18 Razer Inc.

Razer Inc. - Overview
Razer Inc. - Product / Service
Razer Inc. - Key offerings
SWOT

16. Appendix

16.1 Scope of the report

Market definition
Objectives
Notes and caveats

16.2 Inclusions and exclusions checklist

Inclusions checklist
Exclusions checklist

16.3 Currency conversion rates for US$

16.4 Research methodology

16.5 Data procurement

Information sources

16.6 Data validation

16.7 Validation techniques employed for market sizing

16.8 Data synthesis

16.9 360 degree market analysis

16.10 List of abbreviations

Research Methodology

Technavio presents a detailed picture of the market by way of study, synthesis, and summation of data from multiple sources. The analysts have presented the various facets of the market with a particular focus on identifying the key industry influencers. The data thus presented is comprehensive, reliable, and the result of extensive research, both primary and secondary.

INFORMATION SOURCES

Primary sources

  • Manufacturers and suppliers
  • Channel partners
  • Industry experts
  • Strategic decision makers

Secondary sources

  • Industry journals and periodicals
  • Government data
  • Financial reports of key industry players
  • Historical data
  • Press releases

DATA ANALYSIS

Data Synthesis

  • Collation of data
  • Estimation of key figures
  • Analysis of derived insights

Data Validation

  • Triangulation with data models
  • Reference against proprietary databases
  • Corroboration with industry experts

REPORT WRITING

Qualitative

  • Market drivers
  • Market challenges
  • Market trends
  • Five forces analysis

Quantitative

  • Market size and forecast
  • Market segmentation
  • Geographical insights
  • Competitive landscape

Interested in this report?

Get your sample now to see our research methodology and insights!

Download Now

Frequently Asked Questions

Keyboard market growth will increase by USD 1440.3 million during 2026-2030.

The Keyboard market is expected to grow at a CAGR of 6.1% during 2026-2030.

Keyboard market is segmented by Technology (Wired, Wireless) Application (Corporate, Personal, Gaming) Distribution channel (Offline, Online)

Acer Inc., Apple Inc., ASUSTeK Computer Inc., Cooler Master Technology Inc., Corsair Gaming Inc., Dell Technologies Inc., EPOMAKER, Gigabyte Technology Co. Ltd., Glorious LLC, HP Inc., Kensington, Keychron, Lenovo Group Ltd., Logitech International SA, Metadot Corp., Micro Star International Co Ltd, Microsoft Corp., NuPhy, Rapoo Technology Co. Ltd., Razer Inc., Redragon, SteelSeries ApS, Targus Inc., Thermaltake Technology Co., Turtle Beach Corp. are a few of the key vendors in the Keyboard market.

North America will register the highest growth rate of 40.8% among the other regions. Therefore, the Keyboard market in North America is expected to garner significant business opportunities for the vendors during the forecast period.

US, Canada, Mexico, China, Japan, India, South Korea, Australia, Indonesia, Germany, UK, France, Italy, Spain, The Netherlands, Brazil, Argentina, Chile, Saudi Arabia, UAE, South Africa, Israel, Turkey

  • Rising popularity of e-sports is augmenting market growth is the driving factor this market.

The Keyboard market vendors should focus on grabbing business opportunities from the Technology segment as it accounted for the largest market share in the base year.
RIA - Research AI Assistant
Ask RIA
