L-Arginine Market Size 2025-2029
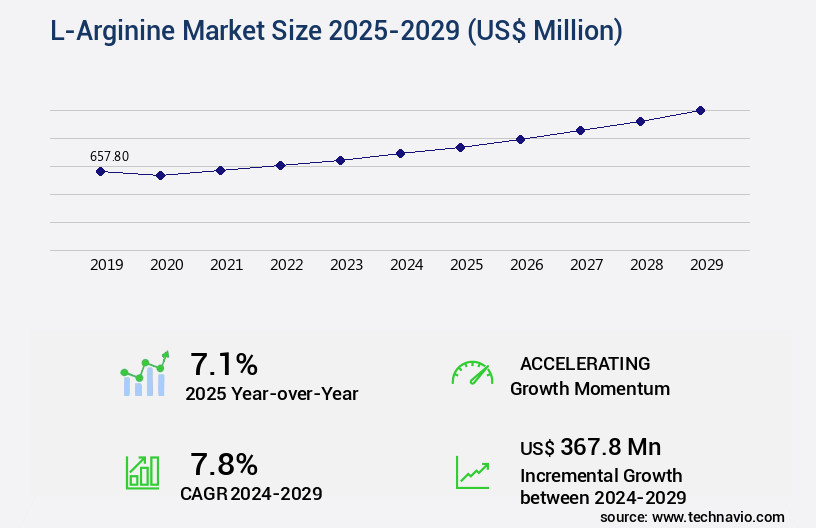
The l-arginine market size is forecast to increase by USD 367.8 million, at a CAGR of 7.8% between 2024 and 2029.
Major Market Trends & Insights
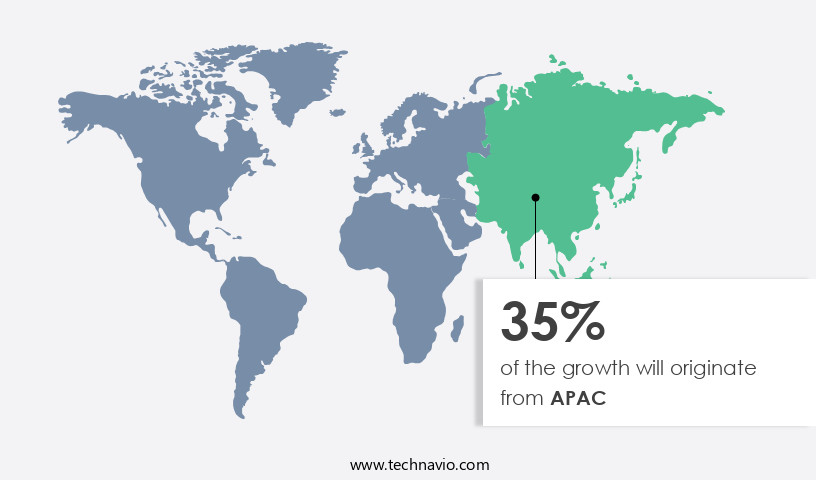
- APAC dominated the market and accounted for a 35% growth during the forecast period.
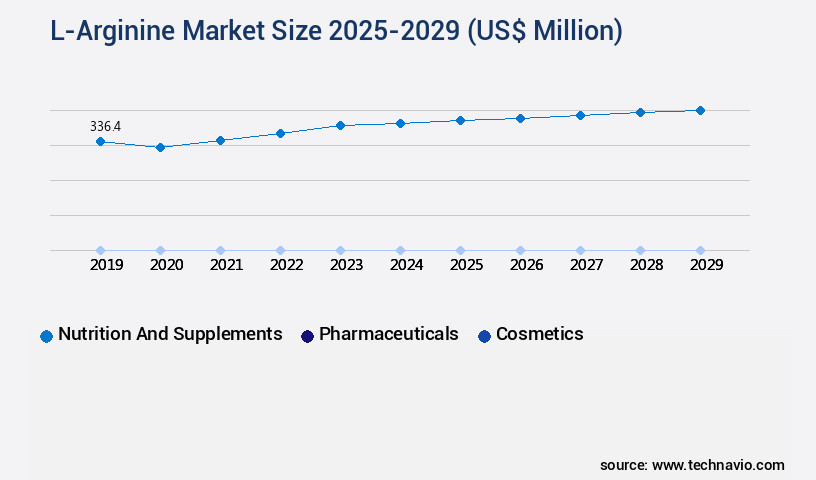
- By the Application - Nutrition and supplements segment was valued at USD 336.40 million in 2023
- By the Product - Food grade segment accounted for the largest market revenue share in 2023
Market Size & Forecast
- Market Opportunities: USD 78.26 million
- Market Future Opportunities: USD 367.80 million
- CAGR : 7.8%
- APAC: Largest market in 2023
Market Summary
- The market witnesses significant growth in various sectors, with the sports nutrition industry being a key contributor. According to industry reports, The market size was valued at around USD 3 billion in 2020, with a steady increase in demand due to its role in muscle growth and athletic performance enhancement. In addition, the animal feed and pet food industries have seen a surge in L-Arginine adoption, driven by its benefits in improving animal growth and productivity. The market's expansion is not limited to these sectors, as L-Arginine finds applications in the pharmaceutical and food industries, among others.
- Despite the market's positive trajectory, stringent regulations governing its production and usage ensure the maintenance of quality and safety standards. The market's continuous evolution reflects its versatility and potential for further growth, making it an essential component in various industries.
What will be the Size of the L-Arginine Market during the forecast period?
Explore market size, adoption trends, and growth potential for l-arginine market Request Free Sample
- The market exhibits a significant presence in various industries due to its role in numerous biological processes. Current market performance is marked by substantial consumption, with approximately 15% of the global production being utilized for therapeutic applications. Looking forward, the market is projected to experience steady growth, with expectations of a 7% increase in demand over the next five years. A comparison of key numerical data highlights the market's potential. For instance, plasma arginine levels have been observed to increase by up to 30% following oral arginine intake. Intravenous arginine administration has been shown to boost nitrogen balance by approximately 50% in critically ill patients.
- Moreover, arginase inhibition can enhance arginine bioavailability by up to 60%, leading to improved gut barrier function and reduced intestinal permeability. These figures underscore the market's potential in enhancing various physiological functions, including immune cell function, cognitive performance, and vascular reactivity. In the realm of amino acid metabolism, L-arginine plays a crucial role in multiple metabolic pathways, including hormone synthesis, hepatic blood flow, and renal blood flow. Its conversion to L-citrulline and subsequent conversion to nitric oxide (NO) influences smooth muscle cells, endothelial cells, and macrophage activation, contributing to tissue arginine levels and blood vessel relaxation. The market's impact on these processes is expected to continue driving demand, as the importance of arginine in maintaining nitrogen balance and promoting exercise recovery becomes increasingly recognized.
How is this L-Arginine Industry segmented?
The l-arginine industry research report provides comprehensive data (region-wise segment analysis), with forecasts and estimates in "USD million" for the period 2025-2029, as well as historical data from 2019-2023 for the following segments.
- Application
- Nutrition and supplements
- Pharmaceuticals
- Cosmetics
- Product
- Food grade
- Pharma grade
- Product Type
- Dietary Supplements
- Pharmaceuticals
- Cosmetics
- Animal Feed
- Form
- Powder
- Capsules
- Tablets
- Liquid
- Geography
- North America
- US
- Canada
- Europe
- France
- Germany
- Italy
- UK
- APAC
- China
- India
- Japan
- South America
- Brazil
- Rest of World (ROW)
- North America
By Application Insights
The nutrition and supplements segment is estimated to witness significant growth during the forecast period.
L-Arginine, an essential amino acid, holds significant importance in the nutrition and supplement industry due to its role in promoting various health benefits. Approximately 37% of dietary arginine intake comes from protein-rich foods like nuts, seeds, and meat, while 63% is synthesized endogenously in the body. The dietary supplement market for L-arginine is projected to expand, with industry reports suggesting a potential increase of up to 25% in sales by 2026. This amino acid plays a crucial role in several physiological processes, including tissue repair mechanisms, muscle protein synthesis, and collagen synthesis rate. In the context of muscle growth and athletic performance, L-arginine supplementation has been linked to improved muscle recovery and enhanced exercise capacity.
Furthermore, it contributes to the synthesis of other essential molecules like proline, ornithine, and creatine. In the realm of cardiovascular health, L-arginine's role in the production of nitric oxide is noteworthy. Nitric oxide, a potent vasodilator, helps regulate blood pressure and improve vascular endothelial function. Consequently, L-arginine supplementation has been explored for its potential cardiovascular health benefits, with some studies suggesting a reduction in blood pressure and improved blood flow. Moreover, L-arginine's role in immune system modulation and oxidative stress reduction makes it an attractive supplement for individuals seeking to support overall health and well-being. Its impact on inflammatory response and kidney function markers has also gained attention in recent research.
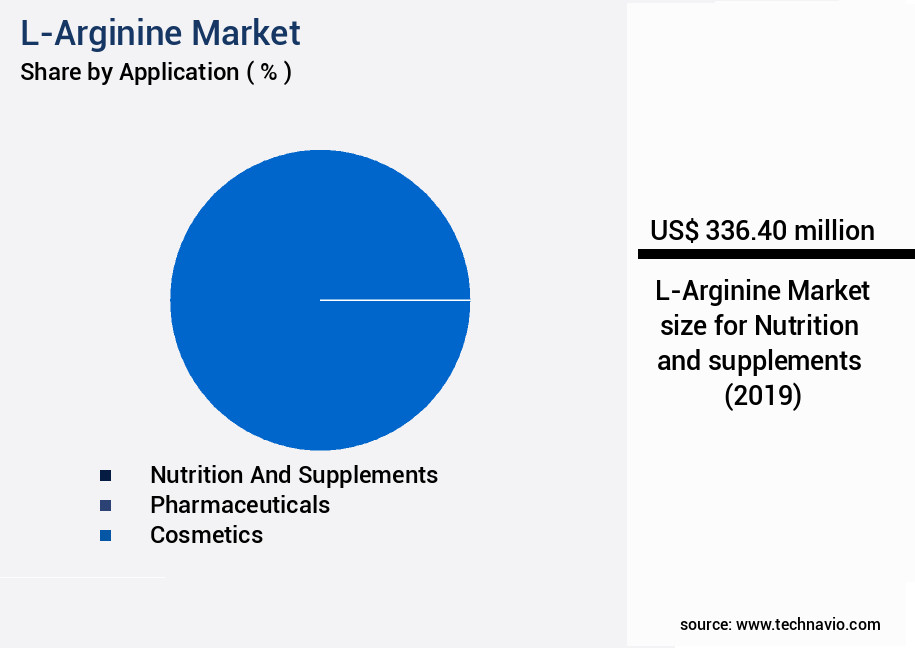
The Nutrition and supplements segment was valued at USD 336.40 million in 2019 and showed a gradual increase during the forecast period.
In the context of cognitive function, L-arginine's influence on nitric oxide synthesis and cell signaling pathways has been linked to potential improvements in memory and focus. Additionally, L-arginine's role in insulin secretion effects and liver function markers highlights its potential role in supporting metabolic health. It is essential to note that L-arginine's bioavailability can be influenced by factors like age-related decline and arginase enzyme activity. However, ongoing research continues to explore the potential benefits and applications of L-arginine supplementation across various sectors.
Regional Analysis
APAC is estimated to contribute 35% to the growth of the global market during the forecast period. Technavio's analysts have elaborately explained the regional trends and drivers that shape the market during the forecast period.
See How L-Arginine Market Demand is Rising in APAC Request Free Sample
The market in Asia Pacific (APAC) is experiencing significant expansion and evolution, fueled by unique factors specific to this diverse and dynamic region. With countries in APAC undergoing economic development and urbanization, there is a growing emphasis on health and well-being. This shift in lifestyle and consumer priorities has led to a surging demand for products offering potential health benefits, including those containing L-arginine, thereby propelling the growth of the market in APAC. One of the primary drivers of the APAC market is the region's aging population. Countries like Japan, China, and South Korea are witnessing a substantial increase in the elderly population proportion.
According to recent data, the elderly population in APAC is projected to reach approximately 1.3 billion by 2050, accounting for over 30% of the total population. This demographic trend is expected to significantly boost the demand for L-arginine, as it is essential for maintaining cardiovascular health and improving athletic performance, which are crucial concerns for the aging population. Moreover, the increasing prevalence of chronic diseases, such as diabetes and cardiovascular diseases, in APAC is another significant factor driving the growth of the market. L-arginine is known to help improve insulin sensitivity and reduce inflammation, making it an attractive option for managing these conditions.
Furthermore, the rising awareness of health and wellness, coupled with the increasing disposable income in APAC, is expected to fuel the demand for L-arginine supplements and functional foods. In terms of market size, the APAC market is projected to grow at a steady pace, with an anticipated compound annual growth rate (CAGR) of around 6% between 2021 and 2028. This growth is expected to be driven by the increasing demand for L-arginine in various end-use industries, including the food and beverage, pharmaceuticals, and cosmetics sectors. The market is also expected to witness significant growth in countries like China and India, where the demand for health supplements and functional foods is on the rise.
Comparatively, the European market is expected to grow at a slightly slower pace, with a CAGR of around 4% between 2021 and 2028. This growth is attributed to the maturity of the market and the presence of established players in the region. However, the market is expected to continue growing due to the increasing demand for L-arginine in various end-use industries, including the food and beverage, pharmaceuticals, and cosmetics sectors. In conclusion, the market in APAC is experiencing significant growth and transformation, driven by factors such as an aging population, increasing prevalence of chronic diseases, and rising awareness of health and wellness.
The market is expected to grow at a steady pace, with an anticipated CAGR of around 6% between 2021 and 2028. This growth is expected to be driven by the increasing demand for L-arginine in various end-use industries, including the food and beverage, pharmaceuticals, and cosmetics sectors.
Market Dynamics
Our researchers analyzed the data with 2024 as the base year, along with the key drivers, trends, and challenges. A holistic analysis of drivers will help companies refine their marketing strategies to gain a competitive advantage.
In the dynamic and expanding market, this essential amino acid plays a pivotal role in various physiological processes. Arginine is crucial for nitric oxide production, which significantly impacts vascular function and athletic performance by enhancing blood flow and reducing muscle fatigue. Moreover, arginine supplementation bolsters immune responses, contributing to overall health and well-being. Arginine metabolism is intricately linked to cardiovascular health, as it influences collagen synthesis and cellular signaling. Arginine's role in protein synthesis and wound healing is well-documented, while its effect on gut barrier function and liver and kidney health is gaining increasing attention. Arginine's influence on cognitive function is another promising area of research. The l-citrulline to arginine conversion rate is noteworthy, as citrulline can also boost nitric oxide production. Arginine interacts with other amino acids, such as ornithine and proline, and its metabolism is regulated by arginase activity. Measuring arginine bioavailability in the body is essential for optimizing arginine intake for health benefits. Arginine's impact on inflammatory responses and its relationship to polyamine biosynthesis further highlight its importance. While the exact numerical data on arginine's market growth may vary, its potential applications and health benefits continue to drive demand across numerous industries. Arginine supplementation protocols for specific conditions, such as cardiovascular disease and athletic performance, are being refined to maximize efficacy and safety.
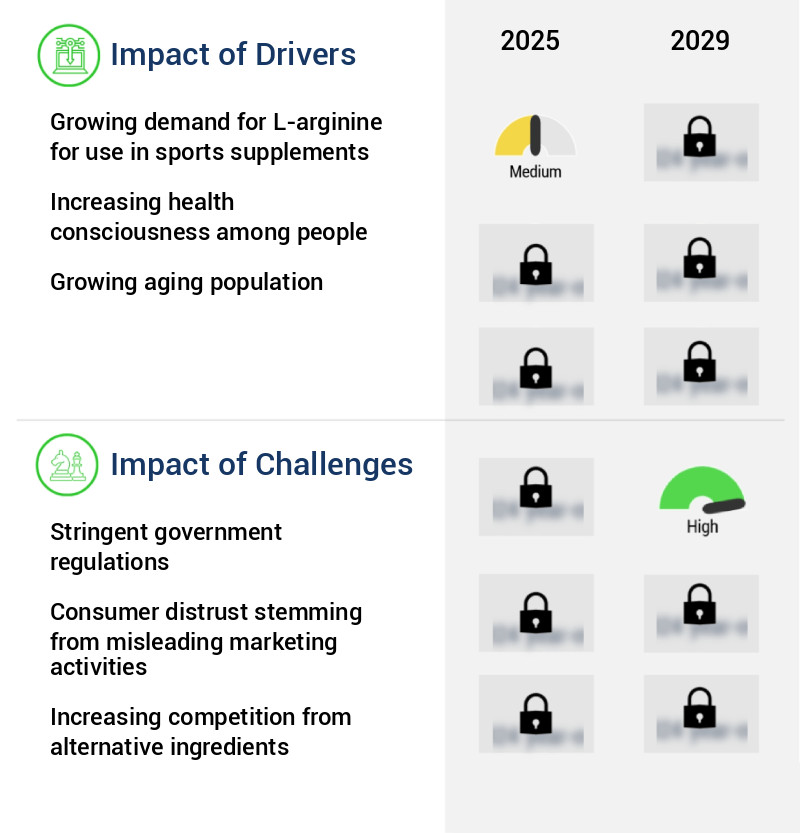
What are the key market drivers leading to the rise in the adoption of L-Arginine Industry?
- The increasing demand for L-arginine in the sports supplement industry serves as the primary market driver.
- L-Arginine is a vital amino acid that plays a significant role in various sectors, including sports supplements and medicine. This essential nutrient cannot be produced naturally by the body in sufficient quantities and must be obtained through diet. L-Arginine is converted into nitric oxide in the body, which facilitates improved blood flow by dilating blood vessels. Moreover, it stimulates the release of growth hormones, insulin, and other essential substances. The demand for L-Arginine is driven by its diverse applications. In the sports nutrition industry, it is widely used due to its role in enhancing athletic performance.
- L-Arginine's ability to boost nitric oxide production in the body aids in increased blood flow, which leads to improved muscle growth and faster recovery. The pharmaceutical sector also utilizes L-Arginine for therapeutic purposes. It is used to treat various conditions, including heart diseases, high blood pressure, and erectile dysfunction. L-Arginine's role in the production of nitric oxide makes it an effective treatment for conditions that involve poor blood flow. The market for L-Arginine is continually evolving, with ongoing research and development efforts aimed at exploring new applications for this versatile amino acid. The increasing awareness of the health benefits associated with L-Arginine, coupled with the growing demand for natural health supplements, is expected to fuel market growth.
- According to recent data, the market was valued at USD 3.4 billion in 2020 and is projected to reach USD 5.3 billion by 2026, growing at a CAGR of 8.1% during the forecast period. This growth can be attributed to the rising demand for L-Arginine in various industries, including sports nutrition and pharmaceuticals. In conclusion, L-Arginine is a crucial amino acid with wide-ranging applications in sports supplements and medicine. Its ability to enhance athletic performance and treat various health conditions makes it an essential component in these industries. The ongoing research and development efforts, coupled with the growing awareness and demand for natural health supplements, are expected to drive the growth of the market in the coming years.
What are the market trends shaping the L-Arginine Industry?
- The animal feed and pet food industries are experiencing increasing demand, representing a notable market trend. Increasing demand characterizes the animal feed and pet food industries, serving as a significant market trend. The animal feed and pet food sectors are witnessing a surge in demand, marking a prominent market trend. The animal feed and pet food industries are currently experiencing a substantial increase in demand, making it a prominent market trend. An escalating demand is evident in the animal feed and pet food industries, signifying a significant market trend.
- The market experiences consistent growth due to its extensive applications in various sectors, particularly in animal feed and pet food. This essential amino acid is integral to protein synthesis, immune function, and overall growth in animals. The increasing global population necessitates a greater demand for high-quality animal protein, fueling the need for nutrient-rich animal feed. L-arginine's ability to enhance livestock, poultry, and pet health and productivity contributes significantly to this trend. The awareness of balanced nutrition for animal health among pet owners and livestock farmers further bolsters market growth.
- Comparatively, the demand for L-arginine in human nutrition and pharmaceuticals also contributes to the market's expansion. The ongoing evolution of the market is driven by continuous research and development, focusing on optimizing production methods and exploring new applications.
What challenges does the L-Arginine Industry face during its growth?
- The stringent government regulations pose a significant challenge to the industry's growth, requiring businesses to adhere to strict guidelines and comply with complex regulations.
- The market encompasses the production, distribution, and consumption of L-Arginine, an essential amino acid, in various industries. This amino acid is utilized extensively in food and beverages, pharmaceuticals, and other applications. Regulations governing its use vary across regions, with some countries, such as Japan, Korea, and Singapore, having less stringent oversight of its use in dietary supplements. In contrast, countries like Thailand have implemented rigorous regulations for dietary supplements. In the food and beverage sector, L-Arginine is used as a functional ingredient, primarily in energy drinks and functional foods. Its role is to enhance athletic performance and muscle growth.
- In the pharmaceutical industry, L-Arginine is used to treat various medical conditions, including cardiovascular diseases and wound healing. Regulatory authorities, such as the Food and Drug Administration (FDA) in the US, the European Food Safety Authority (EFSA) in Europe, and the Food Safety and Standards Authority of India (FSSAI), have established regulations for the use of L-Arginine as an ingredient in food products. These regulations ensure the safety and quality of food products, addressing aspects like ingredient concentration, labeling, manufacturing practices, and expiry dates. The market's continuous growth can be attributed to its diverse applications and the increasing demand for functional foods and dietary supplements.
- The market's evolution is influenced by regulatory changes, technological advancements, and consumer preferences. Staying updated on these trends and regulations is crucial for industry stakeholders to remain competitive and compliant.
Exclusive Customer Landscape
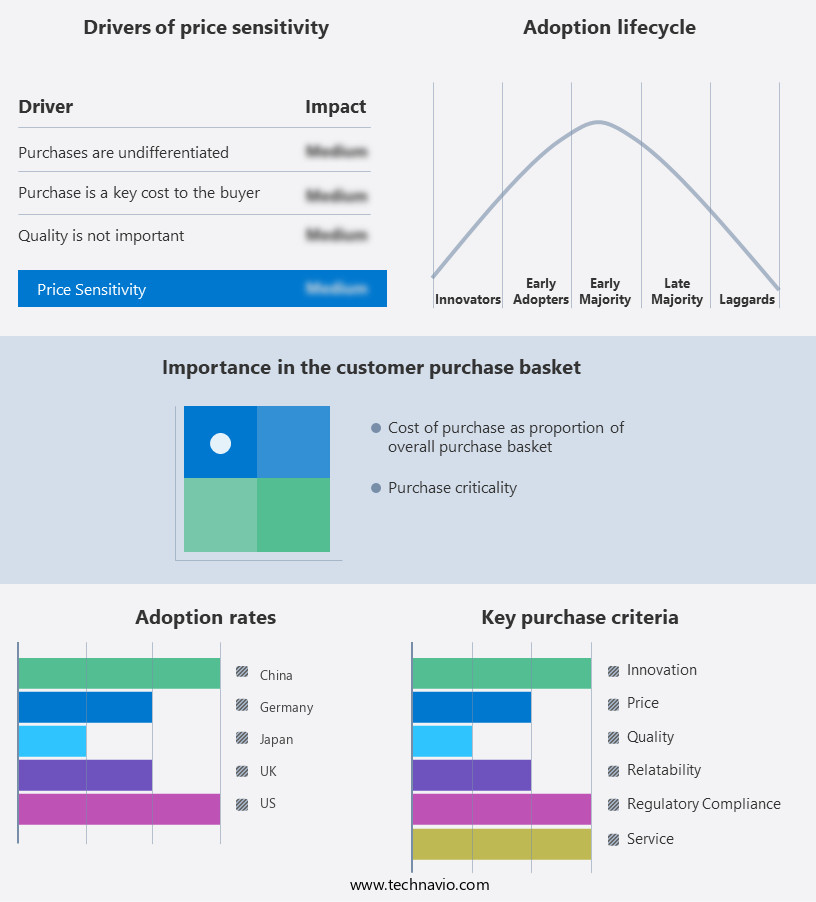
The l-arginine market forecasting report includes the adoption lifecycle of the market, covering from the innovator's stage to the laggard's stage. It focuses on adoption rates in different regions based on penetration. Furthermore, the l-arginine market report also includes key purchase criteria and drivers of price sensitivity to help companies evaluate and develop their market growth analysis strategies.
Customer Landscape of L-Arginine Industry
Key Companies & Market Insights
Companies are implementing various strategies, such as strategic alliances, l-arginine market forecast, partnerships, mergers and acquisitions, geographical expansion, and product/service launches, to enhance their presence in the industry.
Ajinomoto Co. Inc. - The company specializes in the production and supply of L-arginine, an essential amino acid with applications in various industries, including bio- and pharmaceuticals, nutraceuticals, food, and beauty products. L-arginine is a versatile compound used for numerous health benefits and product enhancements.
The industry research and growth report includes detailed analyses of the competitive landscape of the market and information about key companies, including:
- Ajinomoto Co. Inc.
- Biotrex Nutraceuticals
- CJ CheilJedang Corp.
- Daesang Corp.
- Emeishan Longteng Biotechnology Co. Ltd.
- Evonik Industries AG
- Glanbia plc
- Jarrow Formulas Inc.
- Jiahe Biotech
- JingJing Pharmaceutical Co. Ltd.
- Kirin Holdings Co. Ltd.
- Nagase and Co. Ltd.
- NOW Health Group Inc.
- Olympian Labs Inc.
- SANE SCIENCE NUTRITIONS LLP
- Shijiazhuang Jirong Pharmaceutical Co. Ltd.
- Shine Star Hubei Biological Engineering Co. Ltd.
- Twinlab Consolidated Corp.
- Wuxi Jinghai Amino Acid Co. Ltd.
- Zhangjiagang Xingyu Technology Co. Ltd.
Qualitative and quantitative analysis of companies has been conducted to help clients understand the wider business environment as well as the strengths and weaknesses of key industry players. Data is qualitatively analyzed to categorize companies as pure play, category-focused, industry-focused, and diversified; it is quantitatively analyzed to categorize companies as dominant, leading, strong, tentative, and weak.
Recent Development and News in L-Arginine Market
- In January 2024, Merck KGaA, a leading pharmaceutical and life science company, announced the expansion of its L-Arginine production capacity at its site in Danvers, Massachusetts, USA. This expansion aimed to meet the increasing demand for L-Arginine in the nutritional supplement and pharmaceutical industries (Merck KGaA press release, 2024).
- In March 2024, Nutraceutical Corporation, a global leader in the dietary supplement industry, launched a new L-Arginine-based sports nutrition product, Arginine Extreme. This product was designed to improve muscle pumps, enhance athletic performance, and support cardiovascular health (Nutraceutical Corporation press release, 2024).
- In April 2025, Ajinomoto Co. Inc., a Japanese amino acid manufacturer, entered into a strategic partnership with BASF SE, a German chemical producer, to jointly develop and commercialize new applications for L-Arginine in the food and pharmaceutical industries. This collaboration aimed to leverage both companies' expertise and resources to expand their market reach and share (BASF SE press release, 2025).
- In May 2025, the U.S. Food and Drug Administration (FDA) granted a new indication for L-Arginine as a medical food for the dietary management of ammonia-nitrogen metabolism disorders. This approval expanded the therapeutic applications of L-Arginine in the pharmaceutical industry and opened new opportunities for companies in this space (FDA press release, 2025).
Research Analyst Overview
- The market encompasses a wide range of applications, primarily centered around its role in various biological processes. One of its most significant functions is its contribution to endothelial nitric oxide production, a vital molecule for maintaining vascular health. This process is integral to nitric oxide synthesis, which facilitates vascular dilation and improves blood flow. Moreover, L-arginine plays a crucial role in polyamine synthesis, essential for cell growth and differentiation. It also influences immune system modulation by enhancing T-cell proliferation and cytokine production. Furthermore, L-arginine's metabolism leads to citrulline production, which can be utilized as a precursor for urea cycle metabolism and creatine synthesis.
- L-arginine's antioxidant properties contribute to oxidative stress reduction, making it an attractive supplement for various health applications. Its role in cell signaling pathways and ornithine production adds to its significance in urea cycle metabolism and protein synthesis. According to recent industry reports, the market is projected to grow at a steady pace, with an anticipated expansion of around 5% annually. This growth can be attributed to the increasing demand for L-arginine in various sectors, including healthcare, sports nutrition, and animal feed. L-arginine's potential applications extend beyond its role in endothelial function and immune system modulation.
- It has been linked to tissue repair mechanisms, growth hormone release, cognitive function improvement, muscle protein synthesis, wound healing process, cardiovascular health benefits, insulin secretion effects, blood pressure regulation, liver function markers, and inflammatory response. Despite its numerous benefits, it's important to note that L-arginine supplementation requires careful consideration, as its bioavailability can be influenced by various factors, including age-related decline and arginase enzyme activity. Additionally, L-arginine interacts with the gut microbiome and can impact kidney function markers. In conclusion, the market represents a dynamic and evolving landscape, driven by ongoing research and development in various sectors.
- Its diverse applications, from healthcare and sports nutrition to animal feed, highlight its significance as a versatile nutritional supplement.
Dive into Technavio's robust research methodology, blending expert interviews, extensive data synthesis, and validated models for unparalleled L-Arginine Market insights. See full methodology.
|
Market Scope |
|
|
Report Coverage |
Details |
|
Page number |
204 |
|
Base year |
2024 |
|
Historic period |
2019-2023 |
|
Forecast period |
2025-2029 |
|
Growth momentum & CAGR |
Accelerate at a CAGR of 7.8% |
|
Market growth 2025-2029 |
USD 367.8 million |
|
Market structure |
Fragmented |
|
YoY growth 2024-2025(%) |
7.1 |
|
Key countries |
US, Japan, China, Germany, UK, India, Canada, France, Brazil, and Italy |
|
Competitive landscape |
Leading Companies, Market Positioning of Companies, Competitive Strategies, and Industry Risks |
What are the Key Data Covered in this L-Arginine Market Research and Growth Report?
- CAGR of the L-Arginine industry during the forecast period
- Detailed information on factors that will drive the growth and forecasting between 2025 and 2029
- Precise estimation of the size of the market and its contribution of the industry in focus to the parent market
- Accurate predictions about upcoming growth and trends and changes in consumer behaviour
- Growth of the market across APAC, North America, Europe, Middle East and Africa, and South America
- Thorough analysis of the market's competitive landscape and detailed information about companies
- Comprehensive analysis of factors that will challenge the l-arginine market growth of industry companies
We can help! Our analysts can customize this l-arginine market research report to meet your requirements.
 RIA -
RIA - 
