Level Sensors And Switches Market Analysis, Size, and Forecast 2025-2029: North America (US, Canada, and Mexico), Europe (France, Germany, and UK), APAC (China, India, Japan, and South Korea), and Rest of World (ROW)

Level Sensors And Switches Market Analysis, Size, and Forecast 2025-2029:
North America (US, Canada, and Mexico), Europe (France, Germany, and UK), APAC (China, India, Japan, and South Korea), and Rest of World (ROW)

Published: May 2025 247 Pages SKU: IRTNTR70695

Market Overview at a Glance

$2.62 B
Market Opportunity
8.9%
CAGR
8.0
YoY growth 2024-2025(%)

Level Sensors And Switches Market Size 2025-2029

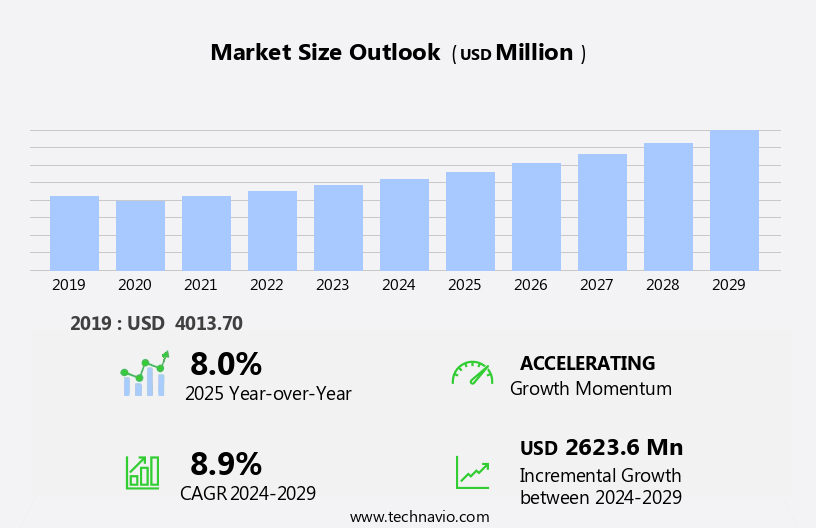
The level sensors and switches market size is forecast to increase by USD 2.62 billion, at a CAGR of 8.9% between 2024 and 2029.

  • The market is experiencing significant growth, driven by the increasing demand in the oil and gas industry for efficient and accurate level measurement solutions. This sector's reliance on level sensors and switches for process optimization and safety is on the rise, as companies seek to maximize production and minimize operational costs. Another trend shaping the market is the growing preference for wireless level sensors. Boiler control relies on level sensors to prevent overheating and ensure efficient energy usage. The flexibility and ease of installation offered by these sensors make them an attractive option for various industries, including water and wastewater treatment, food and beverage, and chemical processing. However, the challenge of selecting the right level sensor for specific applications remains a significant obstacle.
  • Factors such as temperature, pressure, and liquid properties must be considered to ensure the chosen sensor delivers accurate and reliable readings. Despite these opportunities, the market faces challenges. Selecting the appropriate level sensor for various applications can be a complex process, as each sensor type has its unique advantages and limitations. For instance, ultrasonic sensors are suitable for measuring liquids with varying densities, while radar sensors are ideal for applications with high levels of interference. Companies must carefully evaluate their specific requirements to make informed decisions and optimize their operations effectively.

What will be the Size of the Level Sensors And Switches Market during the forecast period?

Level Sensors And Switches Market Size

Explore in-depth regional segment analysis with market size data - historical 2019-2023 and forecasts 2025-2029 - in the full report.  
 Request Free Sample

  • In the market, system integration plays a crucial role in optimizing industrial processes. Sensor life cycles are extended through advanced calibration procedures and temperature compensation, ensuring sensor accuracy. Solid state switches and piezoelectric sensors offer reliability and sensitivity, while data analytics and machine learning enable predictive maintenance and process optimization. Remote diagnostics and sensor troubleshooting improve uptime, and fail-safe design ensures safety systems function effectively. Deep learning and artificial intelligence enhance sensor configuration and data logging capabilities. Cloud platform integration and software integration streamline control systems, while pressure compensation and electromagnetic switches cater to various applications.
  • Zero-point drift and sensor resolution are critical factors in selecting the right sensors for specific industrial needs. Predictive analytics and emergency shutdown systems ensure safety and efficiency in harsh environments. Overall, the market continues to evolve, driven by technological advancements and the demand for optimized industrial processes. However, the challenge of selecting the right sensor for specific applications necessitates a thorough understanding of the unique requirements and capabilities of each sensor type. Companies seeking to capitalize on these opportunities must invest in research and development to offer innovative solutions that cater to diverse application needs.

How is this Level Sensors And Switches Industry segmented?

The level sensors and switches industry research report provides comprehensive data (region-wise segment analysis), with forecasts and estimates in "USD million" for the period 2025-2029, as well as historical data from 2019-2023 for the following segments.

  • End-user
    • Oil and gas
    • Water and wastewater treatment
    • Chemical
    • Food and beverage
    • Others
  • Technology
    • Hydrostatic pressure
    • Microwave and radar
    • Ultrasonic
    • Vibratory probe
    • Others
  • Type
    • MEMS
    • Optical sensors
    • Capacitive sensors
    • Piezoelectric sensors
    • Others
  • Geography
    • North America
      • US
      • Canada
      • Mexico
    • Europe
      • France
      • Germany
      • UK
    • APAC
      • China
      • India
      • Japan
      • South Korea
    • Rest of World (ROW)

By End-user Insights

The oil and gas segment is estimated to witness significant growth during the forecast period. Level sensors and switches play a crucial role in process industries, particularly in the oil and gas sector. These sensors, known for their simple designs and high efficiency, enable complex functions. Given the industry's requirement to operate in harsh environmental conditions, level sensors and switches offer comprehensive solutions to prevent leaks and spills of hazardous substances. The expanding exploration in African oil fields and escalating investments in the oil and gas industries across the Middle East and Asia-Pacific are propelling market growth. In the realm of technology, level sensors incorporate various advancements, such as Devicenet protocol, Ethernet connectivity, Wi-Fi, and Profibus protocol, to facilitate seamless integration with industrial automation systems.

Sensor calibration and maintenance are essential aspects of level sensor and switch performance. Capacitive sensors, conductive sensors, and magnetic sensors are some of the types that require regular calibration to maintain accuracy. Proximity switches, float switches, and pressure switches are among the switch types that facilitate efficient switch actuation and control. In summary, the market is driven by the oil and gas industry's need for efficient and reliable level sensing and control solutions. The market is characterized by technological advancements, diverse applications, and stringent industry requirements.

Level Sensors And Switches Market Size

Request Free Sample

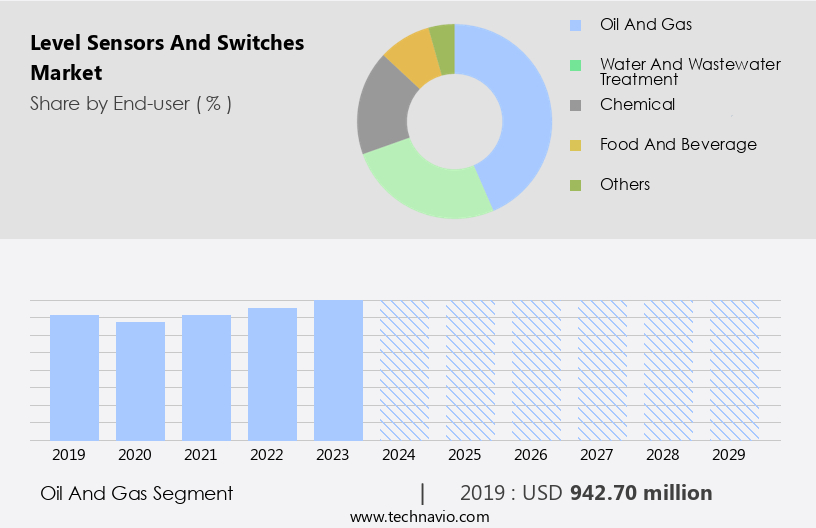
The Oil and gas segment was valued at USD 942.70 billion in 2019 and showed a gradual increase during the forecast period.

Pressure sensors, optical sensors, and ultrasonic sensors are among the popular types, catering to diverse applications in industries like water treatment, power generation, and food & beverage. Moreover, level sensors and switches are engineered to meet stringent industry requirements, including shock resistance, vibration resistance, operating temperature, and hazardous area certification. They are also designed for easy integration with OEM applications, PLCs, SCADA systems, and other industrial control systems. In the context of the Internet of Things (IoT), level sensors and switches are increasingly being used for remote monitoring, data acquisition, and switch actuation. They support various communication protocols, such as Modbus, CAN bus, and HART, to ensure seamless data exchange and control.

The Level Sensors and Switches Market is growing rapidly, driven by advancements in strain gauge sensors that enhance precision and performance. A crucial factor in industry adoption is the sensor life cycle, ensuring longevity and cost efficiency. Improved sensor reliability guarantees accurate measurement and reduced maintenance needs. Enhanced sensor sensitivity allows for more precise detection of liquid and solid levels in various industrial applications. Proper sensor installation is essential for optimizing functionality and achieving consistent performance.

Regional Analysis

APAC is estimated to contribute 33% to the growth of the global market during the forecast period. Technavio's analysts have elaborately explained the regional trends and drivers that shape the market during the forecast period.

Level Sensors And Switches Market Share by Geography

Download Free Sample Report

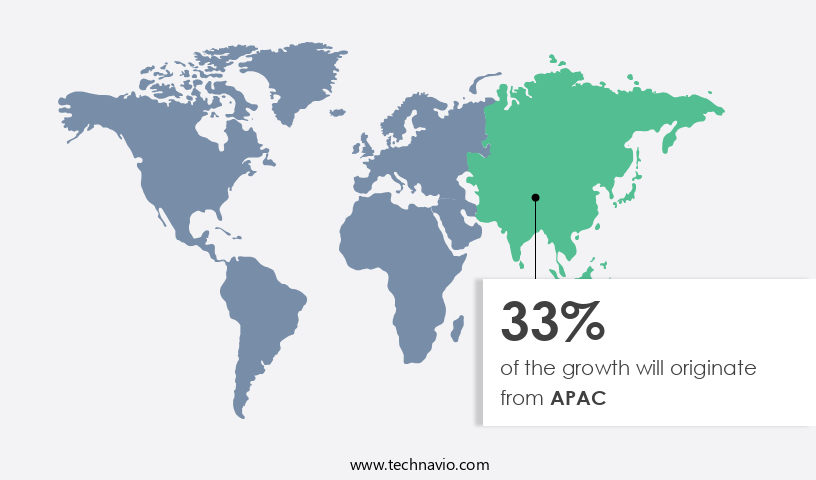
In the industrial automation sector, level sensors and switches are essential components, particularly in the oil and gas industry. The demand for these devices is surging due to increased investments in this sector, especially in greenfield projects across APAC. Notably, state-owned oil companies in China, such as CNOOC Ltd., PetroChina Co. Ltd., and China Petroleum and Chemical Corp., have significantly boosted their investments in traditional and renewable energy projects. In 2024, they collectively invested over RMB 130 billion and increased oil production by 7% year-on-year. This trend is driving the market for level sensors and switches, which play a crucial role in process control, fluid level detection, and reservoir monitoring.

These devices come in various types, including pressure sensors, capacitive sensors, ultrasonic sensors, and magnetic sensors. They offer features like wifi connectivity, ethernet connectivity, and Bluetooth connectivity for remote monitoring and data acquisition. Other essential features include shock resistance, vibration resistance, and hazardous area certification. Level sensors and switches are used in diverse applications, such as food & beverage, water treatment, power generation, and chemical processing. They are integrated with various protocols like DeviceNet, Modbus, Profibus, and CAN bus for seamless communication with other industrial automation systems. They also offer different output options, such as analog output, digital output, and Hart protocol, catering to the specific requirements of various applications.

Moreover, level sensors and switches are integral to various industrial automation systems, including conveyor systems, pipeline monitoring, and tank monitoring. They ensure efficient process control, reduce downtime, and enhance overall productivity. Maintenance requirements for these devices are essential, and sensor calibration is a critical aspect to maintain their accuracy and reliability. In summary, the market for level sensors and switches is experiencing significant growth due to increased investments in the oil and gas industry and the need for efficient process control and automation across various industries. The devices offer various features and come in different types, catering to diverse applications and integration requirements.

Market Dynamics

Our researchers analyzed the data with 2024 as the base year, along with the key drivers, trends, and challenges. A holistic analysis of drivers will help companies refine their marketing strategies to gain a competitive advantage.

What are the Level Sensors And Switches market drivers leading to the rise in the adoption of Industry?

  • The oil and gas industry's growing requirement for level sensors and switches serves as the primary market driver. Level sensors and switches play a crucial role in process control and industrial automation, particularly in the chemical processing industry. These devices are essential for fluid level detection in various applications, including reservoir monitoring and hazardous area certification. Two common communication protocols, RS-485 and CAN bus, facilitate the integration of level sensors into larger control systems. Inductive sensors and magnetic sensors are popular technologies for level detection due to their reliability and immunity to harsh environments. Float switches are another option for applications where a simple on/off switch is sufficient. Analog output and digital output are common output types, providing flexibility for system integration.
  • The oil and gas industry in the Middle East and Africa continues to drive demand for level sensors and switches due to their extensive oil reserves. Despite reduced oil and gas prices, Latin American countries have not seen a significant decrease in production, ensuring ongoing demand for new plant equipment and machinery. Ingress protection rating is an essential consideration for level sensors and switches, ensuring they can withstand the harsh conditions often encountered in industrial applications. The HART protocol and ISA-100 communication protocols provide additional features for process monitoring and diagnostics.

What are the Level Sensors and Switches market trends shaping the Industry?

  • The growing demand for wireless level sensors represents a significant market trend in the industrial automation sector. These sensors offer numerous advantages, including increased flexibility, easier installation, and improved data access, making them an essential component of modern industrial systems. Level sensors and switches play a crucial role in industrial automation and process control by monitoring and maintaining the accurate level of fluids or materials in tanks and pipelines. These sensors convert physical quantities into electrical signals, which are then processed through an automation system to indicate physical variations or error signals. Wireless level sensors, in particular, have gained popularity due to their ability to transmit data in real-time, enabling remote monitoring and control. Pressure sensors, optical sensors, and proximity switches are common types of level sensors used in various industries, including food & beverage, oil & gas, and manufacturing.
  • These sensors offer features such as high precision, reliability, range, and sensitivity, making them suitable for applications like flow control, pipeline monitoring, and OEM integrations with PLCs. Signal conditioning is an essential aspect of level sensing, ensuring the accuracy and quality of the electrical signals produced by the sensors. The integration of wireless connectivity technologies, such as Wi-Fi and DeviceNet protocol, further enhances the functionality of level sensors by enabling seamless data transfer and remote monitoring. These sensors offer advanced features, such as pressure sensing, optical detection, and proximity switching, making them indispensable in various industries and applications.

How does Level Sensors and Switches market face challenges during its growth?

  • The inability to choose appropriate level sensors poses a significant challenge to industry expansion. This issue, which requires the expertise and knowledge of professionals, hinders growth in the sector. Level sensors and switches play a crucial role in various industries, including water treatment, power generation, and oil & gas, for level control and switch actuation. These devices come in different types, such as capacitive sensors, which use the property of capacitance to detect the level of a medium. Digital output, ethernet connectivity, Bluetooth connectivity, and IoT applications are some advanced features increasingly adopted in level sensors and switches. However, choosing the right type of level sensor can be challenging due to the complexity involved in capturing and measuring distinct phases, such as vapor and liquid or liquid and solid.
  • Customized solutions are often sought after, but their high cost can be a significant barrier for industrial buyers, potentially impacting business operations and overall costs. Data acquisition and sensor calibration are essential aspects of maintaining accurate level measurements. Industrial communication protocols, such as Profibus, facilitate seamless integration of level sensors and switches into industrial systems.

Exclusive Customer Landscape

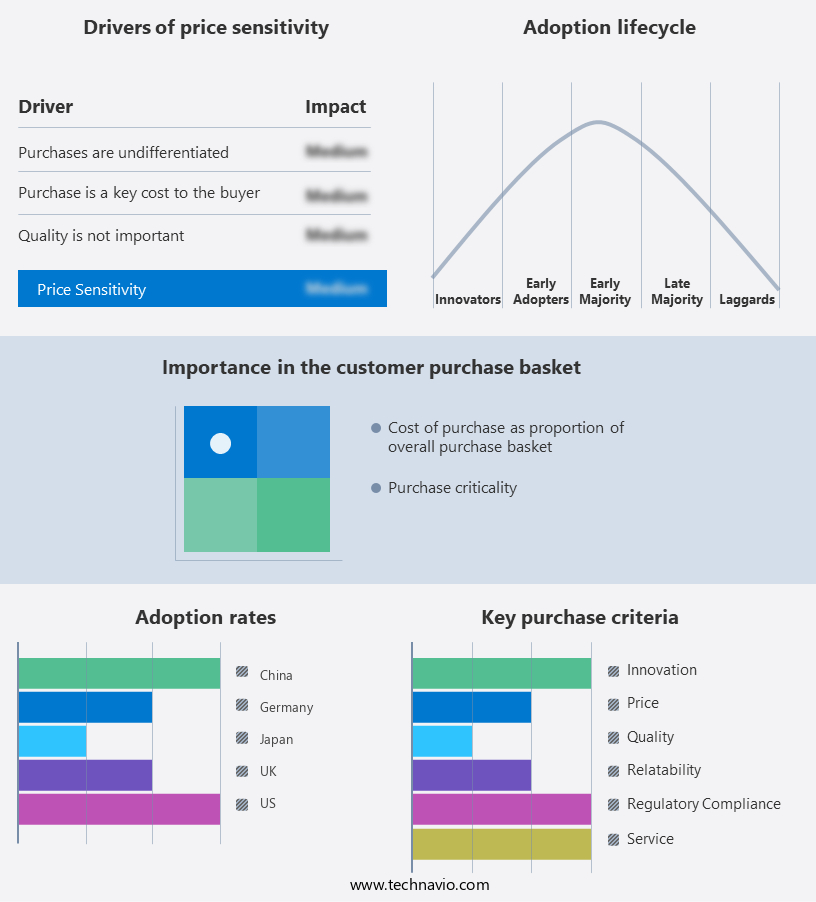
The level sensors and switches market forecasting report includes the adoption lifecycle of the market, covering from the innovator's stage to the laggard's stage. It focuses on adoption rates in different regions based on penetration. Furthermore, the level sensors and switches market report also includes key purchase criteria and drivers of price sensitivity to help companies evaluate and develop their market growth analysis strategies.

Level Sensors And Switches Market Share by Geography

 Customer Landscape

Key Companies & Market Insights

Companies are implementing various strategies, such as strategic alliances, level sensors and switches market forecast, partnerships, mergers and acquisitions, geographical expansion, and product/service launches, to enhance their presence in the industry.

ABB Ltd. - The company specializes in level sensors and switches and introduces its advanced LLT 100 laser level transmitters, engineered for precise measurement of dry bulk solids and liquids within silos.

The industry research and growth report includes detailed analyses of the competitive landscape of the market and information about key companies, including:

  • ABB Ltd.
  • AMETEK Inc.
  • Berthold Technologies GmbH and Co.KG
  • Danfoss AS
  • Dwyer Instruments LLC
  • Emerson Electric Co.
  • Endress Hauser Group Services AG
  • Gems Sensors Inc.
  • Honeywell International Inc.
  • JUMO Instrument Co. Ltd.
  • KROHNE Messtechnik GmbH
  • NOHKEN Inc
  • Pepperl and Fuchs SE
  • Rockwell Automation Inc.
  • Schneider Electric SE
  • Siemens AG
  • SST Sensing Ltd.
  • TE Connectivity Ltd.
  • Trafag AG
  • VEGA Grieshaber KG

Qualitative and quantitative analysis of companies has been conducted to help clients understand the wider business environment as well as the strengths and weaknesses of key industry players. Data is qualitatively analyzed to categorize companies as pure play, category-focused, industry-focused, and diversified; it is quantitatively analyzed to categorize companies as dominant, leading, strong, tentative, and weak.

Recent Development and News in Level Sensors And Switches Market

  • In February 2023, Honeywell International Inc. announced the launch of its new level sensor, the MicroSwitch Level Sensor, designed for harsh environments. This innovative product offers a higher temperature rating and improved reliability, making it suitable for applications in the oil and gas industry (Honeywell, 2023).
  • In March 2024, Emerson Electric and Sensirion AG, a Swiss sensor manufacturer, entered into a strategic partnership to develop advanced level sensors for various industries. The collaboration aims to combine Emerson's automation expertise with Sensirion's sensor technology, creating more efficient and accurate level sensing solutions (Emerson Electric, 2024).
  • In May 2024, Endress+Hauser, a leading process automation company, acquired Sensico Instruments, a Swiss manufacturer of ultrasonic level measurement sensors. This acquisition strengthened Endress+Hauser's position in the level sensor market and expanded its product portfolio (Endress+Hauser, 2024).

Research Analyst Overview

The market continues to evolve, driven by the diverse requirements of various sectors such as water treatment, power generation, food & beverage, oil & gas, and chemical processing. Tank monitoring and pipeline monitoring are crucial applications, ensuring efficient flow control and maintaining optimal operating pressure. Devicenet protocol and Profibus protocol facilitate seamless integration with PLCs and SCADA systems, while signal conditioning and sensor calibration ensure accurate level sensing. Optical sensors and ultrasonic sensors are increasingly used for non-contact level measurement, offering advantages in harsh environments and challenging applications. Wifi connectivity and Bluetooth connectivity enable remote monitoring and data acquisition, enhancing operational efficiency and reducing maintenance requirements.

Proximity switches and float switches are essential components in material handling and industrial automation, ensuring switch actuation and response time in various applications. Capacitive sensors and conductive sensors offer versatility in sensing different media and temperatures, while shock resistance and vibration resistance ensure reliable performance in demanding environments. The ongoing integration of IoT applications and wireless communication in level sensors and switches is revolutionizing process control and industrial automation, enabling smart manufacturing and real-time data analysis. The market's continuous dynamism is reflected in the emergence of new technologies and evolving patterns, ensuring a vibrant and innovative landscape for level sensing solutions.

Technologies like inductive sensors, magnetic sensors, and float switches offer reliable level detection in various applications. The oil and gas industries in the Middle East and Africa, along with ongoing production in Latin America, ensure consistent demand for these devices. Ingress protection rating and communication protocols like RS-485, CAN bus, HART, and ISA-100 further enhance their functionality and versatility. The Level Sensors and Switches Market is advancing with innovative switch technology, ensuring accurate fluid level detection. Enhanced sensor integration improves monitoring precision across industries.

Efficient PLC integration optimizes automation, while SCADA integration enables seamless real-time data acquisition. Communication protocols like Modbus protocol, RS protocol, and Profinet protocol facilitate reliable data exchange in industrial systems. These advancements contribute to improved operational efficiency and safety in sectors such as manufacturing, wastewater management, and oil & gas. The integration of these technologies allows for smarter, adaptive sensing solutions, ensuring better process control and reducing maintenance costs. As industries embrace automation, the demand for intelligent level sensors and switches continues to grow, driving further innovation and market expansion.

Dive into Technavio's strong research methodology, blending expert interviews, extensive data synthesis, and validated models for unparalleled Level Sensors And Switches Market insights. See full methodology.

Market Scope

Report Coverage

Details

Page number

247

Base year

2024

Historic period

2019-2023

Forecast period

2025-2029

Growth momentum & CAGR

Accelerate at a CAGR of 8.9%

Market growth 2025-2029

USD 2.62 billion

Market structure

Fragmented

YoY growth 2024-2025(%)

8.0

Key countries

US, China, Canada, Germany, Japan, Mexico, UK, France, India, and South Korea

Competitive landscape

Leading Companies, Market Positioning of Companies, Competitive Strategies, and Industry Risks

Request Free Sample

What are the Key Data Covered in this Level Sensors And Switches Market Research and Growth Report?

  • CAGR of the Level Sensors And Switches industry during the forecast period
  • Detailed information on factors that will drive the growth and forecasting between 2025 and 2029
  • Precise estimation of the size of the market and its contribution of the industry in focus to the parent market
  • Accurate predictions about upcoming growth and trends and changes in consumer behaviour
  • Growth of the market across APAC, North America, Europe, South America, and Middle East and Africa
  • Thorough analysis of the market's competitive landscape and detailed information about companies
  • Comprehensive analysis of factors that will challenge the level sensors and switches market growth of industry companies

We can help! Our analysts can customize this level sensors and switches market research report to meet your requirements.

Get in touch

1 Executive Summary

  • 1.1 Market overview
    • Executive Summary - Chart on Market Overview
    • Executive Summary - Data Table on Market Overview
    • Executive Summary - Chart on Global Market Characteristics
    • Executive Summary - Chart on Market by Geography
    • Executive Summary - Chart on Market Segmentation by End-user
    • Executive Summary - Chart on Market Segmentation by Technology
    • Executive Summary - Chart on Market Segmentation by Type
    • Executive Summary - Chart on Incremental Growth
    • Executive Summary - Data Table on Incremental Growth
    • Executive Summary - Chart on Company Market Positioning

2 Technavio Analysis

  • 2.1 Analysis of price sensitivity, lifecycle, customer purchase basket, adoption rates, and purchase criteria
    • Analysis of price sensitivity, lifecycle, customer purchase basket, adoption rates, and purchase criteria
  • 2.2 Criticality of inputs and Factors of differentiation
    • Overview on criticality of inputs and factors of differentiation
  • 2.3 Factors of disruption
    • Overview on factors of disruption
  • 2.4 Impact of drivers and challenges
    • Impact of drivers and challenges in 2024 and 2029

3 Market Landscape

  • 3.1 Market ecosystem
    • Parent Market
    • Data Table on - Parent Market
  • 3.2 Market characteristics
    • Market characteristics analysis
  • 3.3 Value chain analysis
    • Value chain analysis

4 Market Sizing

  • 4.1 Market definition
    • Offerings of companies included in the market definition
  • 4.2 Market segment analysis
    • Market segments
  • 4.3 Market size 2024
    • 4.4 Market outlook: Forecast for 2024-2029
      • Chart on Global - Market size and forecast 2024-2029 ($ million)
      • Data Table on Global - Market size and forecast 2024-2029 ($ million)
      • Chart on Global Market: Year-over-year growth 2024-2029 (%)
      • Data Table on Global Market: Year-over-year growth 2024-2029 (%)

    5 Historic Market Size

    • 5.1 Global Level Sensors And Switches Market 2019 - 2023
      • Historic Market Size - Data Table on Global Level Sensors And Switches Market 2019 - 2023 ($ million)
    • 5.2 End-user segment analysis 2019 - 2023
      • Historic Market Size - End-user Segment 2019 - 2023 ($ million)
    • 5.3 Technology segment analysis 2019 - 2023
      • Historic Market Size - Technology Segment 2019 - 2023 ($ million)
    • 5.4 Type segment analysis 2019 - 2023
      • Historic Market Size - Type Segment 2019 - 2023 ($ million)
    • 5.5 Geography segment analysis 2019 - 2023
      • Historic Market Size - Geography Segment 2019 - 2023 ($ million)
    • 5.6 Country segment analysis 2019 - 2023
      • Historic Market Size - Country Segment 2019 - 2023 ($ million)

    6 Qualitative Analysis

    • 6.1 Impact of AI in global level sensors and switches market

      7 Five Forces Analysis

      • 7.1 Five forces summary
        • Five forces analysis - Comparison between 2024 and 2029
      • 7.2 Bargaining power of buyers
        • Bargaining power of buyers - Impact of key factors 2024 and 2029
      • 7.3 Bargaining power of suppliers
        • Bargaining power of suppliers - Impact of key factors in 2024 and 2029
      • 7.4 Threat of new entrants
        • Threat of new entrants - Impact of key factors in 2024 and 2029
      • 7.5 Threat of substitutes
        • Threat of substitutes - Impact of key factors in 2024 and 2029
      • 7.6 Threat of rivalry
        • Threat of rivalry - Impact of key factors in 2024 and 2029
      • 7.7 Market condition
        • Chart on Market condition - Five forces 2024 and 2029

      8 Market Segmentation by End-user

      • 8.1 Market segments
        • Chart on End-user - Market share 2024-2029 (%)
        • Data Table on End-user - Market share 2024-2029 (%)
      • 8.2 Comparison by End-user
        • Chart on Comparison by End-user
        • Data Table on Comparison by End-user
      • 8.3 Oil and gas - Market size and forecast 2024-2029
        • Chart on Oil and gas - Market size and forecast 2024-2029 ($ million)
        • Data Table on Oil and gas - Market size and forecast 2024-2029 ($ million)
        • Chart on Oil and gas - Year-over-year growth 2024-2029 (%)
        • Data Table on Oil and gas - Year-over-year growth 2024-2029 (%)
      • 8.4 Water and wastewater treatment - Market size and forecast 2024-2029
        • Chart on Water and wastewater treatment - Market size and forecast 2024-2029 ($ million)
        • Data Table on Water and wastewater treatment - Market size and forecast 2024-2029 ($ million)
        • Chart on Water and wastewater treatment - Year-over-year growth 2024-2029 (%)
        • Data Table on Water and wastewater treatment - Year-over-year growth 2024-2029 (%)
      • 8.5 Chemical - Market size and forecast 2024-2029
        • Chart on Chemical - Market size and forecast 2024-2029 ($ million)
        • Data Table on Chemical - Market size and forecast 2024-2029 ($ million)
        • Chart on Chemical - Year-over-year growth 2024-2029 (%)
        • Data Table on Chemical - Year-over-year growth 2024-2029 (%)
      • 8.6 Food and beverage - Market size and forecast 2024-2029
        • Chart on Food and beverage - Market size and forecast 2024-2029 ($ million)
        • Data Table on Food and beverage - Market size and forecast 2024-2029 ($ million)
        • Chart on Food and beverage - Year-over-year growth 2024-2029 (%)
        • Data Table on Food and beverage - Year-over-year growth 2024-2029 (%)
      • 8.7 Others - Market size and forecast 2024-2029
        • Chart on Others - Market size and forecast 2024-2029 ($ million)
        • Data Table on Others - Market size and forecast 2024-2029 ($ million)
        • Chart on Others - Year-over-year growth 2024-2029 (%)
        • Data Table on Others - Year-over-year growth 2024-2029 (%)
      • 8.8 Market opportunity by End-user
        • Market opportunity by End-user ($ million)
        • Data Table on Market opportunity by End-user ($ million)

      9 Market Segmentation by Technology

      • 9.1 Market segments
        • Chart on Technology - Market share 2024-2029 (%)
        • Data Table on Technology - Market share 2024-2029 (%)
      • 9.2 Comparison by Technology
        • Chart on Comparison by Technology
        • Data Table on Comparison by Technology
      • 9.3 Hydrostatic pressure - Market size and forecast 2024-2029
        • Chart on Hydrostatic pressure - Market size and forecast 2024-2029 ($ million)
        • Data Table on Hydrostatic pressure - Market size and forecast 2024-2029 ($ million)
        • Chart on Hydrostatic pressure - Year-over-year growth 2024-2029 (%)
        • Data Table on Hydrostatic pressure - Year-over-year growth 2024-2029 (%)
      • 9.4 Microwave and radar - Market size and forecast 2024-2029
        • Chart on Microwave and radar - Market size and forecast 2024-2029 ($ million)
        • Data Table on Microwave and radar - Market size and forecast 2024-2029 ($ million)
        • Chart on Microwave and radar - Year-over-year growth 2024-2029 (%)
        • Data Table on Microwave and radar - Year-over-year growth 2024-2029 (%)
      • 9.5 Ultrasonic - Market size and forecast 2024-2029
        • Chart on Ultrasonic - Market size and forecast 2024-2029 ($ million)
        • Data Table on Ultrasonic - Market size and forecast 2024-2029 ($ million)
        • Chart on Ultrasonic - Year-over-year growth 2024-2029 (%)
        • Data Table on Ultrasonic - Year-over-year growth 2024-2029 (%)
      • 9.6 Vibratory probe - Market size and forecast 2024-2029
        • Chart on Vibratory probe - Market size and forecast 2024-2029 ($ million)
        • Data Table on Vibratory probe - Market size and forecast 2024-2029 ($ million)
        • Chart on Vibratory probe - Year-over-year growth 2024-2029 (%)
        • Data Table on Vibratory probe - Year-over-year growth 2024-2029 (%)
      • 9.7 Others - Market size and forecast 2024-2029
        • Chart on Others - Market size and forecast 2024-2029 ($ million)
        • Data Table on Others - Market size and forecast 2024-2029 ($ million)
        • Chart on Others - Year-over-year growth 2024-2029 (%)
        • Data Table on Others - Year-over-year growth 2024-2029 (%)
      • 9.8 Market opportunity by Technology
        • Market opportunity by Technology ($ million)
        • Data Table on Market opportunity by Technology ($ million)

      10 Market Segmentation by Type

      • 10.1 Market segments
        • Chart on Type - Market share 2024-2029 (%)
        • Data Table on Type - Market share 2024-2029 (%)
      • 10.2 Comparison by Type
        • Chart on Comparison by Type
        • Data Table on Comparison by Type
      • 10.3 MEMS - Market size and forecast 2024-2029
        • Chart on MEMS - Market size and forecast 2024-2029 ($ million)
        • Data Table on MEMS - Market size and forecast 2024-2029 ($ million)
        • Chart on MEMS - Year-over-year growth 2024-2029 (%)
        • Data Table on MEMS - Year-over-year growth 2024-2029 (%)
      • 10.4 Optical sensors - Market size and forecast 2024-2029
        • Chart on Optical sensors - Market size and forecast 2024-2029 ($ million)
        • Data Table on Optical sensors - Market size and forecast 2024-2029 ($ million)
        • Chart on Optical sensors - Year-over-year growth 2024-2029 (%)
        • Data Table on Optical sensors - Year-over-year growth 2024-2029 (%)
      • 10.5 Capacitive sensors - Market size and forecast 2024-2029
        • Chart on Capacitive sensors - Market size and forecast 2024-2029 ($ million)
        • Data Table on Capacitive sensors - Market size and forecast 2024-2029 ($ million)
        • Chart on Capacitive sensors - Year-over-year growth 2024-2029 (%)
        • Data Table on Capacitive sensors - Year-over-year growth 2024-2029 (%)
      • 10.6 Piezoelectric sensors - Market size and forecast 2024-2029
        • Chart on Piezoelectric sensors - Market size and forecast 2024-2029 ($ million)
        • Data Table on Piezoelectric sensors - Market size and forecast 2024-2029 ($ million)
        • Chart on Piezoelectric sensors - Year-over-year growth 2024-2029 (%)
        • Data Table on Piezoelectric sensors - Year-over-year growth 2024-2029 (%)
      • 10.7 Others - Market size and forecast 2024-2029
        • Chart on Others - Market size and forecast 2024-2029 ($ million)
        • Data Table on Others - Market size and forecast 2024-2029 ($ million)
        • Chart on Others - Year-over-year growth 2024-2029 (%)
        • Data Table on Others - Year-over-year growth 2024-2029 (%)
      • 10.8 Market opportunity by Type
        • Market opportunity by Type ($ million)
        • Data Table on Market opportunity by Type ($ million)

      11 Customer Landscape

      • 11.1 Customer landscape overview
        • Analysis of price sensitivity, lifecycle, customer purchase basket, adoption rates, and purchase criteria

      12 Geographic Landscape

      • 12.1 Geographic segmentation
        • Chart on Market share by geography 2024-2029 (%)
        • Data Table on Market share by geography 2024-2029 (%)
      • 12.2 Geographic comparison
        • Chart on Geographic comparison
        • Data Table on Geographic comparison
      • 12.3 APAC - Market size and forecast 2024-2029
        • Chart on APAC - Market size and forecast 2024-2029 ($ million)
        • Data Table on APAC - Market size and forecast 2024-2029 ($ million)
        • Chart on APAC - Year-over-year growth 2024-2029 (%)
        • Data Table on APAC - Year-over-year growth 2024-2029 (%)
      • 12.4 North America - Market size and forecast 2024-2029
        • Chart on North America - Market size and forecast 2024-2029 ($ million)
        • Data Table on North America - Market size and forecast 2024-2029 ($ million)
        • Chart on North America - Year-over-year growth 2024-2029 (%)
        • Data Table on North America - Year-over-year growth 2024-2029 (%)
      • 12.5 Europe - Market size and forecast 2024-2029
        • Chart on Europe - Market size and forecast 2024-2029 ($ million)
        • Data Table on Europe - Market size and forecast 2024-2029 ($ million)
        • Chart on Europe - Year-over-year growth 2024-2029 (%)
        • Data Table on Europe - Year-over-year growth 2024-2029 (%)
      • 12.6 South America - Market size and forecast 2024-2029
        • Chart on South America - Market size and forecast 2024-2029 ($ million)
        • Data Table on South America - Market size and forecast 2024-2029 ($ million)
        • Chart on South America - Year-over-year growth 2024-2029 (%)
        • Data Table on South America - Year-over-year growth 2024-2029 (%)
      • 12.7 Middle East and Africa - Market size and forecast 2024-2029
        • Chart on Middle East and Africa - Market size and forecast 2024-2029 ($ million)
        • Data Table on Middle East and Africa - Market size and forecast 2024-2029 ($ million)
        • Chart on Middle East and Africa - Year-over-year growth 2024-2029 (%)
        • Data Table on Middle East and Africa - Year-over-year growth 2024-2029 (%)
      • 12.8 US - Market size and forecast 2024-2029
        • Chart on US - Market size and forecast 2024-2029 ($ million)
        • Data Table on US - Market size and forecast 2024-2029 ($ million)
        • Chart on US - Year-over-year growth 2024-2029 (%)
        • Data Table on US - Year-over-year growth 2024-2029 (%)
      • 12.9 China - Market size and forecast 2024-2029
        • Chart on China - Market size and forecast 2024-2029 ($ million)
        • Data Table on China - Market size and forecast 2024-2029 ($ million)
        • Chart on China - Year-over-year growth 2024-2029 (%)
        • Data Table on China - Year-over-year growth 2024-2029 (%)
      • 12.10 Canada - Market size and forecast 2024-2029
        • Chart on Canada - Market size and forecast 2024-2029 ($ million)
        • Data Table on Canada - Market size and forecast 2024-2029 ($ million)
        • Chart on Canada - Year-over-year growth 2024-2029 (%)
        • Data Table on Canada - Year-over-year growth 2024-2029 (%)
      • 12.11 Germany - Market size and forecast 2024-2029
        • Chart on Germany - Market size and forecast 2024-2029 ($ million)
        • Data Table on Germany - Market size and forecast 2024-2029 ($ million)
        • Chart on Germany - Year-over-year growth 2024-2029 (%)
        • Data Table on Germany - Year-over-year growth 2024-2029 (%)
      • 12.12 Japan - Market size and forecast 2024-2029
        • Chart on Japan - Market size and forecast 2024-2029 ($ million)
        • Data Table on Japan - Market size and forecast 2024-2029 ($ million)
        • Chart on Japan - Year-over-year growth 2024-2029 (%)
        • Data Table on Japan - Year-over-year growth 2024-2029 (%)
      • 12.13 UK - Market size and forecast 2024-2029
        • Chart on UK - Market size and forecast 2024-2029 ($ million)
        • Data Table on UK - Market size and forecast 2024-2029 ($ million)
        • Chart on UK - Year-over-year growth 2024-2029 (%)
        • Data Table on UK - Year-over-year growth 2024-2029 (%)
      • 12.14 Mexico - Market size and forecast 2024-2029
        • Chart on Mexico - Market size and forecast 2024-2029 ($ million)
        • Data Table on Mexico - Market size and forecast 2024-2029 ($ million)
        • Chart on Mexico - Year-over-year growth 2024-2029 (%)
        • Data Table on Mexico - Year-over-year growth 2024-2029 (%)
      • 12.15 India - Market size and forecast 2024-2029
        • Chart on India - Market size and forecast 2024-2029 ($ million)
        • Data Table on India - Market size and forecast 2024-2029 ($ million)
        • Chart on India - Year-over-year growth 2024-2029 (%)
        • Data Table on India - Year-over-year growth 2024-2029 (%)
      • 12.16 France - Market size and forecast 2024-2029
        • Chart on France - Market size and forecast 2024-2029 ($ million)
        • Data Table on France - Market size and forecast 2024-2029 ($ million)
        • Chart on France - Year-over-year growth 2024-2029 (%)
        • Data Table on France - Year-over-year growth 2024-2029 (%)
      • 12.17 South Korea - Market size and forecast 2024-2029
        • Chart on South Korea - Market size and forecast 2024-2029 ($ million)
        • Data Table on South Korea - Market size and forecast 2024-2029 ($ million)
        • Chart on South Korea - Year-over-year growth 2024-2029 (%)
        • Data Table on South Korea - Year-over-year growth 2024-2029 (%)
      • 12.18 Market opportunity by geography
        • Market opportunity by geography ($ million)
        • Data Tables on Market opportunity by geography ($ million)

      13 Drivers, Challenges, and Opportunity/Restraints

      • 13.1 Market drivers
        • 13.2 Market challenges
          • 13.3 Impact of drivers and challenges
            • Impact of drivers and challenges in 2024 and 2029
          • 13.4 Market opportunities/restraints

            14 Competitive Landscape

            • 14.1 Overview
              • 14.2 Competitive Landscape
                • Overview on criticality of inputs and factors of differentiation
              • 14.3 Landscape disruption
                • Overview on factors of disruption
              • 14.4 Industry risks
                • Impact of key risks on business

              15 Competitive Analysis

              • 15.1 Companies profiled
                • Companies covered
              • 15.2 Company ranking index
                • Company ranking index
              • 15.3 Market positioning of companies
                • Matrix on companies position and classification
              • 15.4 ABB Ltd.
                • ABB Ltd. - Overview
                • ABB Ltd. - Business segments
                • ABB Ltd. - Key news
                • ABB Ltd. - Key offerings
                • ABB Ltd. - Segment focus
                • SWOT
              • 15.5 AMETEK Inc.
                • AMETEK Inc. - Overview
                • AMETEK Inc. - Business segments
                • AMETEK Inc. - Key news
                • AMETEK Inc. - Key offerings
                • AMETEK Inc. - Segment focus
                • SWOT
              • 15.6 Berthold Technologies GmbH and Co.KG
                • Berthold Technologies GmbH and Co.KG - Overview
                • Berthold Technologies GmbH and Co.KG - Product / Service
                • Berthold Technologies GmbH and Co.KG - Key offerings
                • SWOT
              • 15.7 Danfoss AS
                • Danfoss AS - Overview
                • Danfoss AS - Product / Service
                • Danfoss AS - Key offerings
                • SWOT
              • 15.8 Dwyer Instruments LLC
                • Dwyer Instruments LLC - Overview
                • Dwyer Instruments LLC - Product / Service
                • Dwyer Instruments LLC - Key offerings
                • SWOT
              • 15.9 Emerson Electric Co.
                • Emerson Electric Co. - Overview
                • Emerson Electric Co. - Business segments
                • Emerson Electric Co. - Key news
                • Emerson Electric Co. - Key offerings
                • Emerson Electric Co. - Segment focus
                • SWOT
              • 15.10 Endress Hauser Group Services AG
                • Endress Hauser Group Services AG - Overview
                • Endress Hauser Group Services AG - Product / Service
                • Endress Hauser Group Services AG - Key news
                • Endress Hauser Group Services AG - Key offerings
                • SWOT
              • 15.11 Gems Sensors Inc.
                • Gems Sensors Inc. - Overview
                • Gems Sensors Inc. - Product / Service
                • Gems Sensors Inc. - Key offerings
                • SWOT
              • 15.12 Honeywell International Inc.
                • Honeywell International Inc. - Overview
                • Honeywell International Inc. - Business segments
                • Honeywell International Inc. - Key news
                • Honeywell International Inc. - Key offerings
                • Honeywell International Inc. - Segment focus
                • SWOT
              • 15.13 KROHNE Messtechnik GmbH
                • KROHNE Messtechnik GmbH - Overview
                • KROHNE Messtechnik GmbH - Product / Service
                • KROHNE Messtechnik GmbH - Key news
                • KROHNE Messtechnik GmbH - Key offerings
                • SWOT
              • 15.14 Rockwell Automation Inc.
                • Rockwell Automation Inc. - Overview
                • Rockwell Automation Inc. - Business segments
                • Rockwell Automation Inc. - Key news
                • Rockwell Automation Inc. - Key offerings
                • Rockwell Automation Inc. - Segment focus
                • SWOT
              • 15.15 Schneider Electric SE
                • Schneider Electric SE - Overview
                • Schneider Electric SE - Business segments
                • Schneider Electric SE - Key news
                • Schneider Electric SE - Key offerings
                • Schneider Electric SE - Segment focus
                • SWOT
              • 15.16 Siemens AG
                • Siemens AG - Overview
                • Siemens AG - Business segments
                • Siemens AG - Key news
                • Siemens AG - Key offerings
                • Siemens AG - Segment focus
                • SWOT
              • 15.17 TE Connectivity Ltd.
                • TE Connectivity Ltd. - Overview
                • TE Connectivity Ltd. - Business segments
                • TE Connectivity Ltd. - Key news
                • TE Connectivity Ltd. - Key offerings
                • TE Connectivity Ltd. - Segment focus
                • SWOT
              • 15.18 VEGA Grieshaber KG
                • VEGA Grieshaber KG - Overview
                • VEGA Grieshaber KG - Product / Service
                • VEGA Grieshaber KG - Key offerings
                • SWOT

              16 Appendix

              • 16.1 Scope of the report
                • 16.2 Inclusions and exclusions checklist
                  • Inclusions checklist
                  • Exclusions checklist
                • 16.3 Currency conversion rates for US$
                  • Currency conversion rates for US$
                • 16.4 Research methodology
                  • Research methodology
                • 16.5 Data procurement
                  • Information sources
                • 16.6 Data validation
                  • Data validation
                • 16.7 Validation techniques employed for market sizing
                  • Validation techniques employed for market sizing
                • 16.8 Data synthesis
                  • Data synthesis
                • 16.9 360 degree market analysis
                  • 360 degree market analysis
                • 16.10 List of abbreviations
                  • List of abbreviations

                Research Methodology

                Technavio presents a detailed picture of the market by way of study, synthesis, and summation of data from multiple sources. The analysts have presented the various facets of the market with a particular focus on identifying the key industry influencers. The data thus presented is comprehensive, reliable, and the result of extensive research, both primary and secondary.

                INFORMATION SOURCES

                Primary sources

                • Manufacturers and suppliers
                • Channel partners
                • Industry experts
                • Strategic decision makers

                Secondary sources

                • Industry journals and periodicals
                • Government data
                • Financial reports of key industry players
                • Historical data
                • Press releases

                DATA ANALYSIS

                Data Synthesis

                • Collation of data
                • Estimation of key figures
                • Analysis of derived insights

                Data Validation

                • Triangulation with data models
                • Reference against proprietary databases
                • Corroboration with industry experts

                REPORT WRITING

                Qualitative

                • Market drivers
                • Market challenges
                • Market trends
                • Five forces analysis

                Quantitative

                • Market size and forecast
                • Market segmentation
                • Geographical insights
                • Competitive landscape

                Interested in this report?

                Get your sample now to see our research methodology and insights!

                Download Now

                Frequently Asked Questions

                Level Sensors And Switches market growth will increase by $ 2623.6 mn during 2025-2029.

                The Level Sensors And Switches market is expected to grow at a CAGR of 8.9% during 2025-2029.

                Level Sensors And Switches market is segmented by End-user( Oil and gas, Water and wastewater treatment, Chemical, Food and beverage, Others) Technology( Hydrostatic pressure, Microwave and radar, Ultrasonic, Vibratory probe, Others) Type( MEMS, Optical sensors, Capacitive sensors, Piezoelectric sensors, Others)

                ABB Ltd., AMETEK Inc., Berthold Technologies GmbH and Co.KG, Danfoss AS, Dwyer Instruments LLC, Emerson Electric Co., Endress Hauser Group Services AG, Gems Sensors Inc., Honeywell International Inc., JUMO Instrument Co. Ltd., KROHNE Messtechnik GmbH, NOHKEN Inc, Pepperl and Fuchs SE, Rockwell Automation Inc., Schneider Electric SE, Siemens AG, SST Sensing Ltd., TE Connectivity Ltd., Trafag AG, VEGA Grieshaber KG are a few of the key vendors in the Level Sensors And Switches market.

                APAC will register the highest growth rate of 33% among the other regions. Therefore, the Level Sensors And Switches market in APAC is expected to garner significant business opportunities for the vendors during the forecast period.

                US, China, Canada, Germany, Japan, Mexico, UK, France, India, South Korea

                • Increasing demand for level sensors and switches in oil and gas industryThe prominence of the oil and gas industry in the Middle East remains matchless. These oil-rich economies have been consistent demand drivers for level sensors and switches. Africa is globally ranked second after the Middle East in terms of oil exports. Onshore oil production costs in some parts of West Africa are relatively low is the driving factor this market.
                • which will propel oil companies to continue investing in the region. Countries like Nigeria is the driving factor this market.
                • Libya is the driving factor this market.
                • and Chad are witnessing an increase in oil exploration activities is the driving factor this market.
                • which will positively impact new plant equipment and machinery is the driving factor this market.
                • including level sensors and switches.In contrast to markets in the US is the driving factor this market.
                • reduced oil and gas prices have not obstructed oil production in Latin American countries. Companies such as Petrobras in Brazil have increased production volumes with the commissioning of new projects. As the oil and gas industry has to carry out its processes in extremely harsh conditions is the driving factor this market.
                • it becomes relatively important to measure the fluid level is the driving factor this market.
                • temperature is the driving factor this market.
                • and pressure. Owing to technological enhancements is the driving factor this market.
                • level sensors and switches not only help monitor the level of fluid but also monitor the temperature and pressure and provide a digital analog of these conditions on a real-time basis. All these factors have led to the increased use of level sensors and switches in the oil and gas industry to provide accurate fluid level measurement. Thus is the driving factor this market.
                • increasing demand for level sensors and switches in the oil and gas industry fuels the growth of the global level sensors and switches market during the forecast period. is the driving factor this market.

                The Level Sensors And Switches market vendors should focus on grabbing business opportunities from the Oil and gas segment as it accounted for the largest market share in the base year.