Linerless Labels Market Size 2026-2030
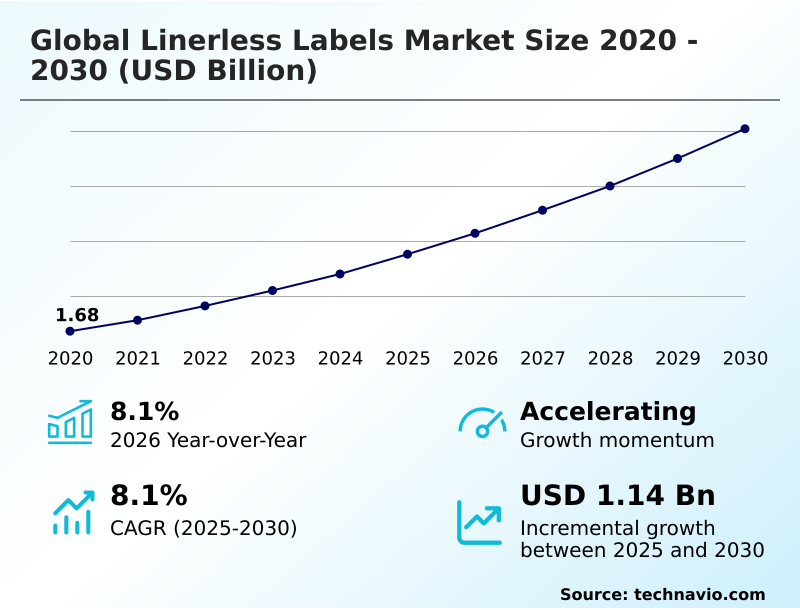
The linerless labels market size is valued to increase by USD 1.14 billion, at a CAGR of 8.1% from 2025 to 2030. Growing corporate emphasis on environmental sustainability and waste reduction will drive the linerless labels market.
Major Market Trends & Insights
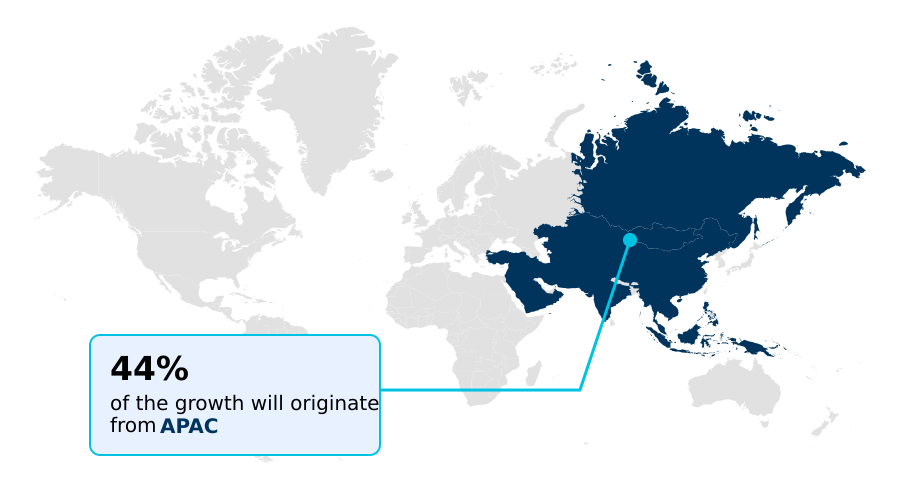
- APAC dominated the market and accounted for a 44.1% growth during the forecast period.
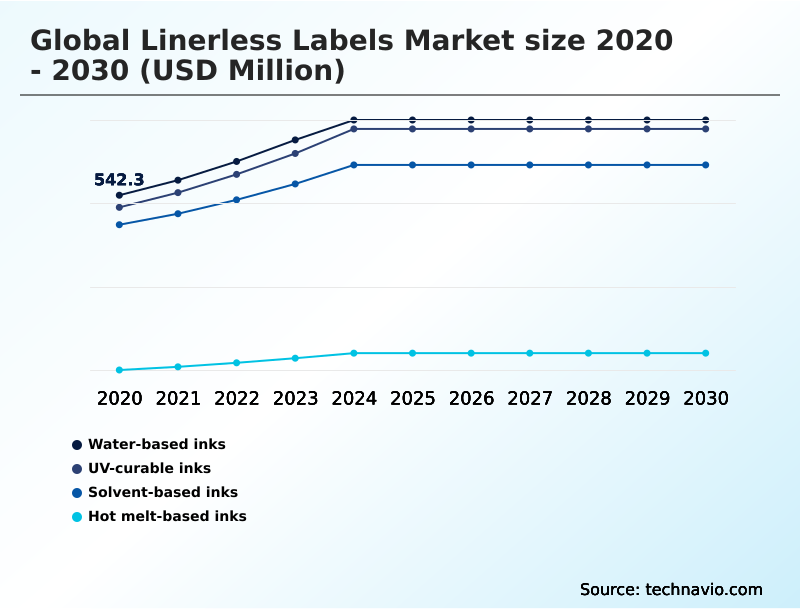
- By Type - Water-based inks segment was valued at USD 710.7 million in 2024
- By End-user - Food and beverages segment accounted for the largest market revenue share in 2024
Market Size & Forecast
- Market Opportunities: USD 1.83 billion
- Market Future Opportunities: USD 1.14 billion
- CAGR from 2025 to 2030 : 8.1%
Market Summary
- The linerless labels market is defined by a significant shift toward operational efficiency and environmental stewardship. The core technology eliminates the release liner common in traditional pressure-sensitive labeling, instead using a specialized silicone release coating on the face stock. This innovation directly addresses corporate sustainability mandates by reducing landfill waste and lowering the carbon footprint associated with packaging.
- Key drivers include the optimization of production lines; linerless rolls contain up to 50% more labels, minimizing downtime from frequent roll changes. For example, in a high-volume logistics hub, this translates to improved throughput and reduced labor costs. However, the technology faces challenges, such as adhesive accumulation on hardware components and the high capital expenditure required for system retrofitting.
- Trends are focused on material science advancements, including the development of bio-based adhesives and recycled face stocks, which enhance the recyclability of the final package. The integration of smart technologies like RFID into linerless formats is also expanding applications in inventory management and anti-counterfeiting, making these solutions a strategic imperative for modern supply chains.
What will be the Size of the Linerless Labels Market during the forecast period?
Get Key Insights on Market Forecast (PDF) Get Free Sample
How is the Linerless Labels Market Segmented?
The linerless labels industry research report provides comprehensive data (region-wise segment analysis), with forecasts and estimates in "USD million" for the period 2026-2030, as well as historical data from 2020-2024 for the following segments.
- Type
- Water-based inks
- UV-curable inks
- Solvent-based inks
- Hot melt-based inks
- End-user
- Food and beverages
- Retail
- Personal care
- Pharmaceuticals
- Others
- Product type
- Variable information print
- Primary labels
- Geography
- APAC
- China
- India
- Japan
- Europe
- Germany
- UK
- France
- North America
- US
- Canada
- Mexico
- South America
- Brazil
- Argentina
- Middle East and Africa
- Saudi Arabia
- UAE
- South Africa
- Rest of World (ROW)
- APAC
By Type Insights
The water-based inks segment is estimated to witness significant growth during the forecast period.
The market is segmented by type, including eco-friendly linerless options like water-based inks, which are gaining traction due to low volatile organic compound emissions.
These inks are formulated for compatibility with the silicone release coating on linerless rolls, ensuring they do not smudge or transfer within the roll.
The segment's growth is supported by demand from the food and beverage industry, where safety is paramount. Advancements in resin technology have resulted in high-performance water-based inks with faster drying times and enhanced vibrancy.
For specialized needs, the market also offers UV-curable, hot melt-based inks, and specialized solvent-based ink systems. Innovations like low-migration profile inks are crucial for linerless primary labels in food packaging.
The linerless thermal printer technology ensures that these inks perform effectively, with some systems achieving 99% print accuracy.
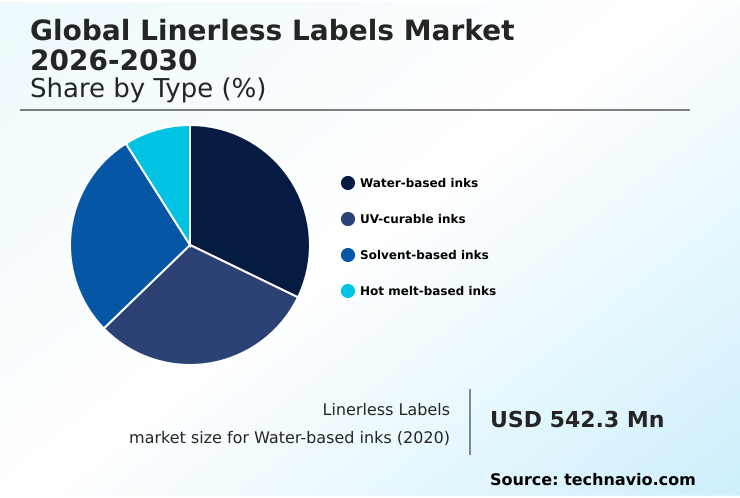
The Water-based inks segment was valued at USD 710.7 million in 2024 and showed a gradual increase during the forecast period.
Regional Analysis
APAC is estimated to contribute 44.1% to the growth of the global market during the forecast period.Technavio’s analysts have elaborately explained the regional trends and drivers that shape the market during the forecast period.
See How Linerless Labels Market Demand is Rising in APAC Get Free Sample
The APAC region is projected to contribute over 44% of the market's incremental growth, driven by its expanding logistics and manufacturing sectors. In this region, the adoption of linerless shipping labels and self-adhesive linerless labels is accelerating.
European markets are driven by stringent regulations, promoting the use of advanced linerless thermal materials with a water-based adhesive system.
In North America, the focus is on automating high-volume distribution centers with sophisticated linerless print-and-apply systems and non-stick hardware components, reducing downtime by 30%. Latin America sees growth in food export sectors, where linerless weigh-scale labeling is crucial.
The demand for various linerless thermal rolls, compatible with water-based inks, UV-curable inks, and solvent-based inks, is growing globally. The use of linerless synthetic films is also expanding in applications requiring durability, supported by specialized linerless label printers.
Market Dynamics
Our researchers analyzed the data with 2025 as the base year, along with the key drivers, trends, and challenges. A holistic analysis of drivers will help companies refine their marketing strategies to gain a competitive advantage.
- The linerless labels market addresses several critical business needs across various sectors. The benefits of linerless labeling technology are most evident when analyzing linerless versus traditional labels efficiency; linerless systems can increase label-per-roll capacity by over 40%, directly boosting productivity.
- For businesses considering adoption, the cost of switching to linerless labels is a key factor, encompassing both hardware and material expenses. However, the long-term sustainability impact of linerless labels often justifies the initial outlay. In logistics, linerless label printers for logistics are becoming standard for managing e-commerce shipping, where variable information printing on linerless labels is essential.
- A common operational issue is linerless label adhesive buildup solutions, which hardware manufacturers are addressing. The recyclability of linerless label materials, supported by bio-based adhesives for linerless labels, enhances corporate sustainability profiles. Applications are diverse, from linerless labels for food packaging and pharmaceutical packaging to linerless label technology for retail.
- A high-speed linerless label applicators comparison reveals significant differences in throughput. The choice of ink, including water-based inks, UV-curable inks, solvent-based inks, or hot melt-based inks for linerless labels, depends on the specific application, whether for functional use or for primary product labeling. The challenges in linerless label application are being mitigated through continuous innovation.
What are the key market drivers leading to the rise in the adoption of Linerless Labels Industry?
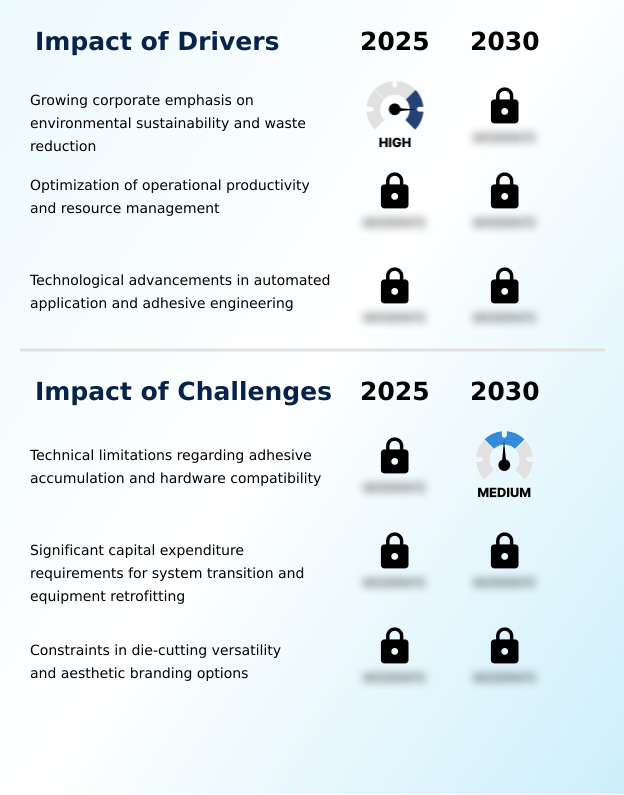
- A growing corporate emphasis on environmental sustainability and waste reduction serves as a key driver for the market.
- The primary market driver is the pursuit of operational efficiency, with companies achieving up to a 50% increase in labels per roll.
- This advantage is amplified by linerless systems that enable variable-length printing, a feature critical for linerless weigh-scale labels and other variable information print labels. Such linerless solutions minimize material waste.
- Technological advancements in hardware, including high-speed linerless applicators with self-cleaning cutting mechanism features, reduce maintenance downtime. Innovations in adhesives, such as high-performance bio-based hot-melt adhesives, ensure strong bonds on diverse substrates, including challenging non-porous surfaces and recycled packaging surfaces.
- The development of durable linerless label applicators and materials like PET durable label material and mono-web linerless labels is expanding applications into more demanding industrial environments.
What are the market trends shaping the Linerless Labels Industry?
- The advancement of sustainable material science is shaping the market, with a notable emphasis on developing bio-based adhesives.
- A key trend is the rapid shift toward advanced material science, including the development of bio-based adhesives and recycled face stocks. These sustainable labeling solutions are central to achieving circular economy goals. Innovations in wash-off adhesives are improving the recyclability of packaging by simplifying label removal. The industry is also exploring plant-based release coating alternatives to traditional silicone.
- Concurrently, the integration of smart technology is creating new opportunities for smart linerless labels, which now feature ultra-thin inlay technology for enhanced tracking and security. This convergence of sustainability and intelligence is driving the development of next-generation linerless solutions.
- The market is also seeing advances in linerless film technology and premium linerless materials, enabling high-quality decorative linerless labels and linerless decorative solutions that combine aesthetic appeal with environmental responsibility, leading to an 18% improvement in brand engagement in test markets.
What challenges does the Linerless Labels Industry face during its growth?
- Technical limitations regarding adhesive accumulation and hardware compatibility pose a key challenge to industry growth.
- A primary challenge restraining market growth is the technical issue of adhesive accumulation on hardware, which can cause downtime and negate some efficiency gains. This requires investment in specialized linerless label solution and linerless printing technology.
- Another significant constraint is the limited die-cutting versatility compared to traditional pressure-sensitive labeling, as the linerless format is not well-suited for decorative die-cutting of complex shapes. This restricts use in premium branding. The transition to a linerless label solution also requires substantial capital investment in new equipment, such as specialized thermal cutters, a barrier for many SMEs.
- While direct thermal linerless labels are common, the development of reliable thermal transfer linerless solutions for long-term durability is ongoing. Balancing the need for a high-tack adhesive with non-stick performance remains a key focus for manufacturers of linerless label materials and linerless thermal labels.
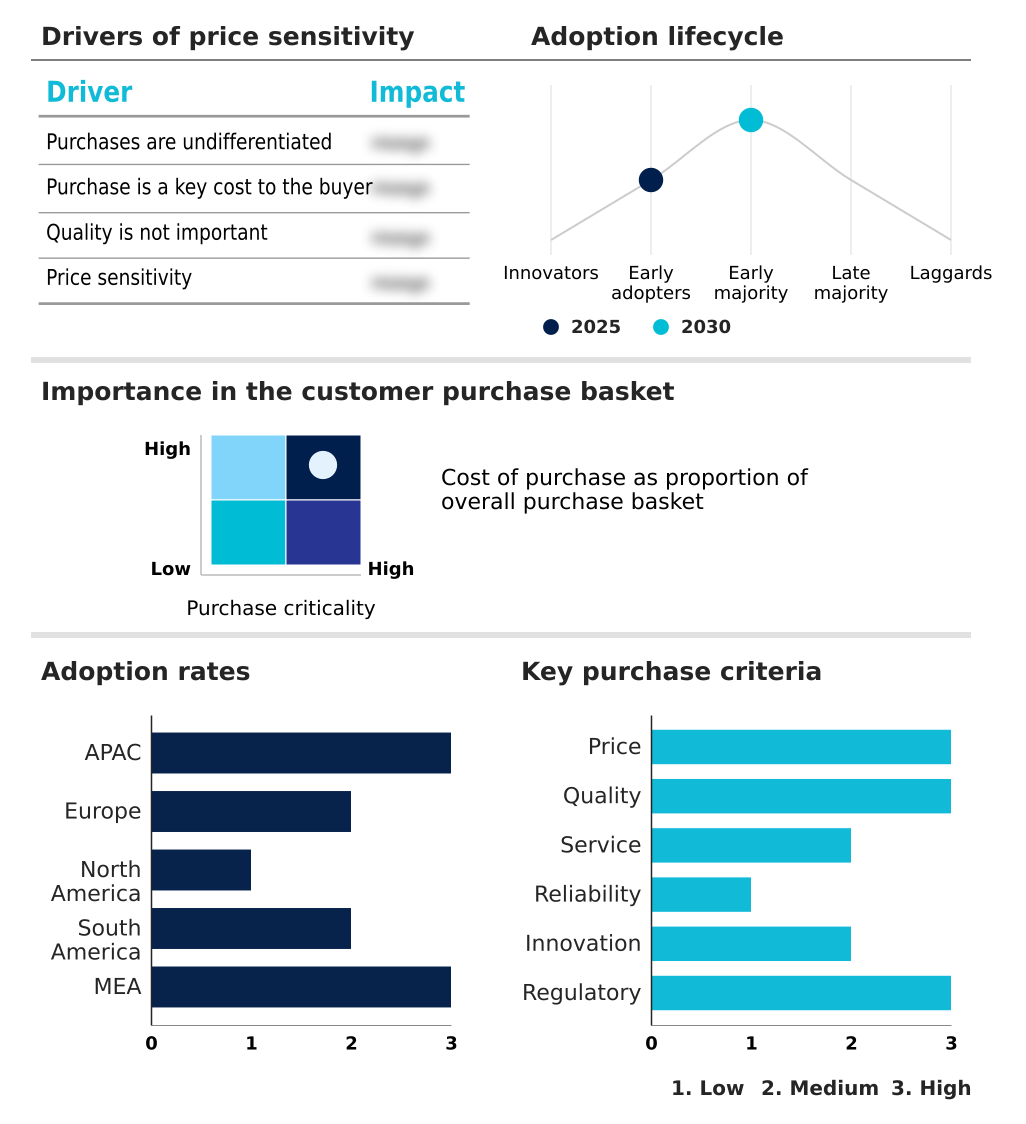
Exclusive Technavio Analysis on Customer Landscape
The linerless labels market forecasting report includes the adoption lifecycle of the market, covering from the innovator’s stage to the laggard’s stage. It focuses on adoption rates in different regions based on penetration. Furthermore, the linerless labels market report also includes key purchase criteria and drivers of price sensitivity to help companies evaluate and develop their market growth analysis strategies.
Customer Landscape of Linerless Labels Industry
Competitive Landscape
Companies are implementing various strategies, such as strategic alliances, linerless labels market forecast, partnerships, mergers and acquisitions, geographical expansion, and product/service launches, to enhance their presence in the industry.
3M Co. - Key offerings include eco-friendly linerless labels and pressure-sensitive solutions, such as thermal and film-based materials, designed for variable information printing and sustainable packaging applications.
The industry research and growth report includes detailed analyses of the competitive landscape of the market and information about key companies, including:
- 3M Co.
- Avery Dennison Corp.
- CCL Industries Inc.
- Constantia Flexibles GmbH
- Conver Autoadhesivos SA
- Coveris Management GmbH
- FEDRIGONI Spa
- General Data Co. Inc.
- Gipako UAB
- Linerless
- NAStar Inc.
- Optimum Group
- Puramark
- Reflex Labels Ltd.
- RR Donnelley and Sons Co.
- SATO Holdings Corp.
- Skanem AS
- UPM Kymmene Corp.
Qualitative and quantitative analysis of companies has been conducted to help clients understand the wider business environment as well as the strengths and weaknesses of key industry players. Data is qualitatively analyzed to categorize companies as pure play, category-focused, industry-focused, and diversified; it is quantitatively analyzed to categorize companies as dominant, leading, strong, tentative, and weak.
Recent Development and News in Linerless labels market
- In May 2025, the European Union finalized an update to the Packaging and Packaging Waste Regulation, introducing mandatory targets for reducing non-recyclable components in industrial labeling, compelling accelerated adoption of linerless technology.
- In August 2025, Avery Dennison Corp. launched an advanced series of high-speed linerless applicators featuring a proprietary self-cleaning cutting mechanism to address adhesive residue buildup in automated distribution centers.
- In November 2025, SATO Europe introduced a new generation of linerless thermal printers equipped with artificial intelligence to monitor cutter wear and adhesive levels, providing predictive maintenance alerts to prevent downtime.
- In March 2025, Henkel AG launched a new series of high-performance, bio-based hot-melt adhesives specifically formulated for linerless applications in the food and beverage industry, designed to maintain tackiness in refrigerated environments.
Dive into Technavio’s robust research methodology, blending expert interviews, extensive data synthesis, and validated models for unparalleled Linerless Labels Market insights. See full methodology.
| Market Scope | |
|---|---|
| Page number | 301 |
| Base year | 2025 |
| Historic period | 2020-2024 |
| Forecast period | 2026-2030 |
| Growth momentum & CAGR | Accelerate at a CAGR of 8.1% |
| Market growth 2026-2030 | USD 1139.6 million |
| Market structure | Fragmented |
| YoY growth 2025-2026(%) | 8.1% |
| Key countries | China, India, Japan, South Korea, Australia, Indonesia, Germany, UK, France, Italy, Spain, The Netherlands, US, Canada, Mexico, Brazil, Argentina, Chile, Saudi Arabia, UAE, South Africa, Israel and Turkey |
| Competitive landscape | Leading Companies, Market Positioning of Companies, Competitive Strategies, and Industry Risks |
Research Analyst Overview
- The linerless labels market is fundamentally reshaping packaging logistics through material science and hardware innovation. The core technology relies on a silicone release coating applied to recycled face stocks, which eliminates the need for a liner and enables variable-length printing. This is critical for applications using linerless thermal printers.
- The industry is moving beyond basic pressure-sensitive labeling to advanced thermal transfer linerless solutions. Material advancements include bio-based adhesives, wash-off adhesives, and a range of ink systems like water-based inks, UV-curable inks, and specialized solvent-based ink systems. For high-speed lines, hot melt-based inks are essential.
- The development of mono-web linerless labels and linerless synthetic films, along with PET durable label material, provides durability for harsh environments. From a boardroom perspective, the decision to invest in this technology is clear: companies transitioning to linerless systems have achieved up to a 50% reduction in material waste.
- Hardware evolution, such as non-stick hardware components and self-cleaning cutting mechanisms, mitigates issues like adhesive accumulation. The adoption of high-performance water-based inks and inks with a low-migration profile is driven by safety regulations, while high-tack adhesive and ultra-thin inlay technology are expanding smart labeling. However, limited die-cutting versatility remains a constraint compared to traditional methods.
- The move towards a water-based adhesive system and plant-based release coating further underscores the market’s commitment to a circular economy, supported by advanced linerless thermal materials.
What are the Key Data Covered in this Linerless Labels Market Research and Growth Report?
-
What is the expected growth of the Linerless Labels Market between 2026 and 2030?
-
USD 1.14 billion, at a CAGR of 8.1%
-
-
What segmentation does the market report cover?
-
The report is segmented by Type (Water-based inks, UV-curable inks, Solvent-based inks, and Hot melt-based inks), End-user (Food and beverages, Retail, Personal care, Pharmaceuticals, and Others), Product Type (Variable information print, and Primary labels) and Geography (APAC, Europe, North America, South America, Middle East and Africa)
-
-
Which regions are analyzed in the report?
-
APAC, Europe, North America, South America and Middle East and Africa
-
-
What are the key growth drivers and market challenges?
-
Growing corporate emphasis on environmental sustainability and waste reduction, Technical limitations regarding adhesive accumulation and hardware compatibility
-
-
Who are the major players in the Linerless Labels Market?
-
3M Co., Avery Dennison Corp., CCL Industries Inc., Constantia Flexibles GmbH, Conver Autoadhesivos SA, Coveris Management GmbH, FEDRIGONI Spa, General Data Co. Inc., Gipako UAB, Linerless, NAStar Inc., Optimum Group, Puramark, Reflex Labels Ltd., RR Donnelley and Sons Co., SATO Holdings Corp., Skanem AS and UPM Kymmene Corp.
-
Market Research Insights
- The market dynamics for linerless labels are driven by tangible efficiency gains and sustainability mandates. Organizations adopting linerless systems report a 40-50% increase in labels per roll, which directly reduces equipment downtime and improves operational throughput.
- This shift to sustainable labeling solutions is not just an environmental choice but a financial one; it eliminates liner disposal costs and reduces freight expenses due to lighter, more compact linerless rolls. However, adoption is not universal, as a recent assessment found that over 55% of mid-sized processors cite the high cost of specialized hardware as a primary barrier.
- Linerless label printers and applicators are becoming more sophisticated, with high-speed linerless applicators and linerless thermal labels addressing previous technical hurdles. This evolution makes eco-friendly linerless options and linerless tray wrap solutions more viable for sectors from food packaging to e-commerce, where both waste reduction and performance are critical.
We can help! Our analysts can customize this linerless labels market research report to meet your requirements.
 RIA -
RIA - 
