Liver Cancer Drugs Market Size 2025-2029
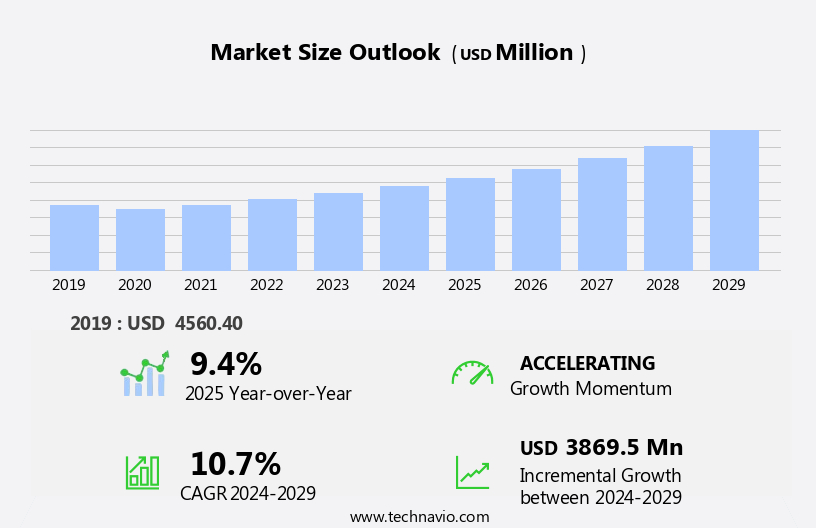
The liver cancer drugs market size is forecast to increase by USD 3.87 billion at a CAGR of 10.7% between 2024 and 2029.
- The market is experiencing significant growth due to the increasing incidence of liver cancer worldwide. According to the World Health Organization, liver cancer is the sixth most common cancer and the third leading cause of cancer-related deaths globally. Despite advances in diagnosis and treatment methods, the only curative options for liver cancer remain surgical resection and transplantation. Consequently, there is a pressing need for effective and innovative drug therapies to improve patient outcomes and reduce mortality rates. A key trend driving market growth is the increasing use of monoclonal antibodies in the development of liver cancer drugs.
- Furthermore, the biomarkers and their role in diagnosis and treatment is a developing trend in the market. Type 2 diabetes, a condition that increases the risk, is also a key factor driving market growth. Monoclonal antibodies are proteins that can recognize and bind to specific targets on cancer cells, making them effective agents for targeted therapy. Several pharmaceutical companies are investing heavily in the research and development of monoclonal antibody-based drugs for liver cancer, offering significant opportunities for market growth. However, the market is not without challenges. The high cost of developing and manufacturing these drugs, as well as the complex regulatory environment, can pose significant barriers to entry. Additionally, the lack of effective treatment options for advanced-stage liver cancer and the need for personalized treatment approaches present significant challenges for market players.
What will be the Size of the Liver Cancer Drugs Market during the forecast period?
- In the complex and evolving landscape of liver cancer treatment, several key trends are shaping the market. Disease management strategies, such as CTLA-4 inhibitors and combination therapy, are gaining traction alongside immune checkpoint inhibitors. The integration of digital health solutions, including mobile health and clinical decision support, is transforming healthcare outcomes while reducing costs. Precision oncology, value-based healthcare, and personalized treatment plans are becoming increasingly important, as are drug delivery systems and targeted therapies like vegf inhibitors and monoclonal antibodies. Moreover, the adoption of advanced technologies like stereotactic radiosurgery, kinase inhibitors, and PD-1 inhibitors is reshaping the treatment landscape.
- The role of patient engagement, satisfaction, and empowerment in liver cancer care is also growing, with the use of health data analytics, cost-effectiveness analysis, and patient outcomes becoming essential factors in treatment decisions. In the realm of end-of-life care, palliative care and hospice care are increasingly being recognized for their importance in improving patient quality of life. Furthermore, the integration of genetics testing, liquid biopsy, and MTor inhibitors into treatment plans is helping healthcare providers address tumor heterogeneity and optimize treatment strategies. As the market for liver cancer drugs continues to evolve, the focus on cost-effectiveness, patient outcomes, and value-added services will remain key drivers. The integration of digital health, precision oncology, and patient-centric care will continue to shape the market, providing new opportunities for innovation and growth.
How is this Liver Cancer Drugs Industry segmented?
The liver cancer drugs industry research report provides comprehensive data (region-wise segment analysis), with forecasts and estimates in "USD million" for the period 2025-2029, as well as historical data from 2019-2023 for the following segments.
- Type
- Immunotherapy
- Targeted therapy
- Drug Class
- Targeted therapy drugs
- Immunotherapy drugs
- Chemotherapeutics
- Others
- Route Of Administration
- Oral
- Injectable
- Others
- Distribution Channel
- Hospital pharmacies
- Retail pharmacies
- Online pharmacies
- Others
- Geography
- North America
- US
- Canada
- Europe
- France
- Germany
- Italy
- UK
- Middle East and Africa
- APAC
- China
- India
- Japan
- South Korea
- South America
- Rest of World (ROW)
- North America
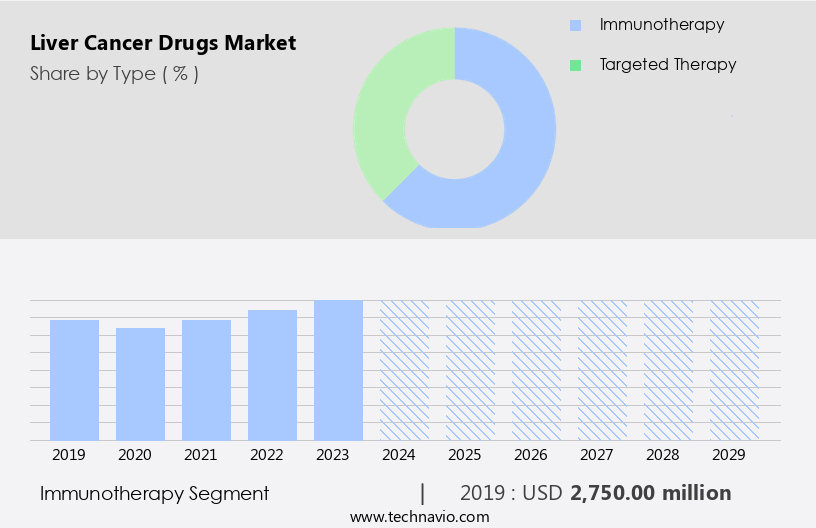
By Type Insights
The immunotherapy segment is estimated to witness significant growth during the forecast period. Immunotherapy, a revolutionary cancer treatment, leverages the body's immune system to identify and eradicate malignant cells, contrasting traditional treatments that directly attack tumors. The immunotherapy market for liver cancer is driven by several factors, including the escalating incidence of liver cancer, advancements in biotechnology, and a deeper comprehension of tumor immunology. Key entities contributing to this segment include research institutions, biotechnology companies, and pharmaceutical giants such as Bristol-Myers Squibb, Merck, and Roche. Merck's KEYTRUDA, a humanized antibody, is a prime example of this innovative approach. It binds to the PD-1 receptor, preventing PD-L1 and PD-L2 from interacting with PD-1, thereby reinstating the immune response and enhancing T-cell activity. Key drivers fueling the immunotherapy segment include the increasing prevalence, advancements in biotechnology, and a deeper comprehension of tumor immunology.
Machine learning and artificial intelligence are also integral components in the development of immunotherapies, aiding in drug discovery, clinical trial design, and personalized medicine for patients with liver cancer. Patient support, drug safety, and patient advocacy are crucial elements in the overall survival and quality of life of liver cancer patients. The tumor microenvironment, molecular profiling, and clinical practice guidelines are essential in comprehending the complexities of liver cancer and designing effective treatment strategies. Drug development, drug pricing, clinical trial management, and drug reimbursement are significant challenges that need to be addressed for the widespread adoption of immunotherapies in liver cancer treatment.
The interplay between hepatitis B, hepatitis C, metastatic liver cancer, and resectable liver cancer necessitates a multi-faceted approach to drug development, including combination therapy, targeted therapy, and adverse event management. The immunotherapy market for liver cancer is a dynamic and evolving landscape, with ongoing research in drug efficacy, drug resistance, and progression-free survival.
Get a glance at the market report of share of various segments Request Free Sample
The Immunotherapy segment was valued at USD 2.75 billion in 2019 and showed a gradual increase during the forecast period.
Regional Analysis
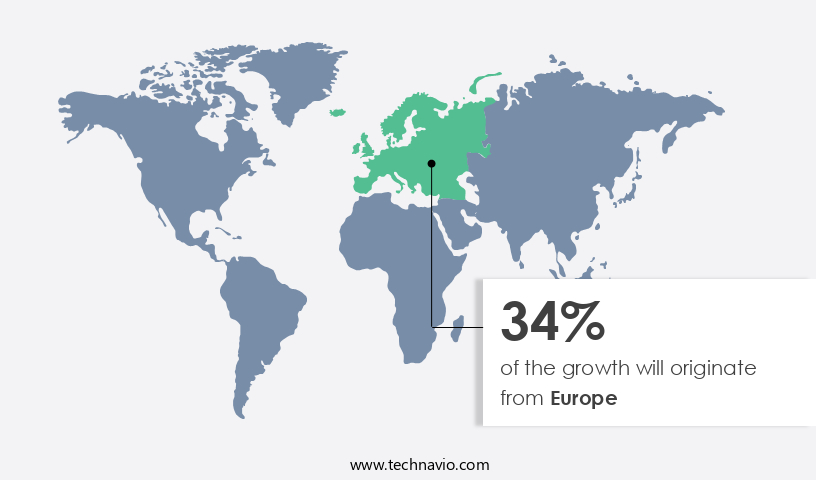
Europe is estimated to contribute 34% to the growth of the global market during the forecast period. Technavio's analysts have elaborately explained the regional trends and drivers that shape the market during the forecast period.
For more insights on the market size of various regions, Request Free Sample
In the North American liver cancer drug market, the rising prevalence of hepatocellular carcinoma is a significant driving factor. Organizations like the Cancer Prevention and Research Institute are spearheading initiatives to promote awareness about liver cancer, advocating for preventative measures and early detection. The American Liver Foundation is another key player, collaborating with pharmaceutical companies to launch public awareness campaigns. These campaigns aim to encourage high-risk individuals to undergo screening tests, enabling early detection and effective control of the disease. Research institutions are leveraging advanced technologies such as machine learning and molecular profiling to enhance drug discovery and development.
Patient advocacy groups are also instrumental in supporting patients, providing education, and advocating for drug approval and reimbursement. Biotechnology companies are investing in personalized medicine and precision medicine approaches to improve drug efficacy and quality of life for liver cancer patients. Clinical research is ongoing to explore targeted therapies, combination therapies, and multi-drug therapies to address drug resistance and improve progression-free survival and overall survival rates. Healthcare providers are adopting healthcare technology solutions to optimize clinical trial management, drug pricing, and patient care. Artificial intelligence and big data are being integrated into drug development processes to enhance drug safety and clinical trial design.
The liver cancer market is characterized by a complex ecosystem involving various stakeholders, including patient support groups, drug safety organizations, clinical research institutions, and regulatory bodies. The market is evolving rapidly, with a focus on improving patient outcomes, reducing adverse events, and addressing the unmet needs of patients with unresectable and metastatic liver cancer.
Market Dynamics
Our researchers analyzed the data with 2024 as the base year, along with the key drivers, trends, and challenges. A holistic analysis of drivers will help companies refine their marketing strategies to gain a competitive advantage.
What are the key market drivers leading to the rise in the adoption of Liver Cancer Drugs Industry?
- The increasing incidence of liver cancer is the key driver of the market. Liver cancer is a significant global health concern, accounting for a considerable number of cancer-related deaths. The primary risk factors for liver cancer include hepatitis B and C infections and underlying cirrhosis. In the US, approximately half of liver cancer patients have hepatitis C, while around 15% have hepatitis B. According to ASCO data, an estimated 41,210 adults (27,980 men and 13,230 women) were diagnosed with primary liver cancer in the US in 2023. Every year, about 31,000 people in the US are diagnosed with this disease. The presence of these risk factors will likely contribute to the continued growth of the liver cancer market.
- Despite advancements in treatment options, including targeted therapies and immunotherapies, the disease remains challenging to diagnose and treat effectively. The market dynamics are influenced by various factors, including the increasing prevalence of risk factors, the growing awareness and early detection efforts, and the development of new and innovative treatment modalities.
What are the market trends shaping the Liver Cancer Drugs Industry?
- Increasing use of monoclonal antibodies is the upcoming market trend. Monoclonal antibodies have emerged as a promising approach in the treatment of liver cancer, which typically does not respond well to chemotherapy. The primary challenge in developing effective liver cancer drugs lies in the lack of learning of tumor-specific targets. To address this, researchers are focusing on creating high-stability and high-affinity antibodies and fragments that can target tumor-specific antigens. Monoclonal antibodies offer several advantages, including their sensitivity and specificity, which minimize the risk of adverse side effects. Their stability is another significant advantage, as it increases their effectiveness.
- The success of monoclonal antibodies hinges on the careful selection of high affinity for tumor-specific antigens through library screening, proteomic biomarker identification, and optimization of antibody engineering to minimize antigenicity and decrease renal clearance rates.
What challenges does the Liver Cancer Drugs Industry face during its growth?
- The only curative option in surgical resection and transplantation is a key challenge affecting the industry's growth. Liver cancer treatment options are primarily determined by the disease's stage and the patient's liver function. Regrettably, disease-modifying drugs to potentially cure liver cancer are currently unavailable in the market or in development. Surgical resection and transplantation remain the only curative modalities for liver cancer. However, achieving a global consensus on surgical treatment recommendations is challenging due to varying healthcare systems worldwide. Surgical resection is an option only for candidates who meet the surgery's prerequisites. Despite its curative potential, liver resection is associated with a high recurrence rate of tumors. The complexities of liver surgery and the associated risks necessitate careful consideration and thorough patient evaluation.
- In summary, the treatment landscape for liver cancer is characterized by a limited number of curative options, with surgical resection and transplantation being the primary choices. The challenges in achieving a global consensus on surgical treatment recommendations highlight the need for continued research and innovation in this area.
Exclusive Customer Landscape
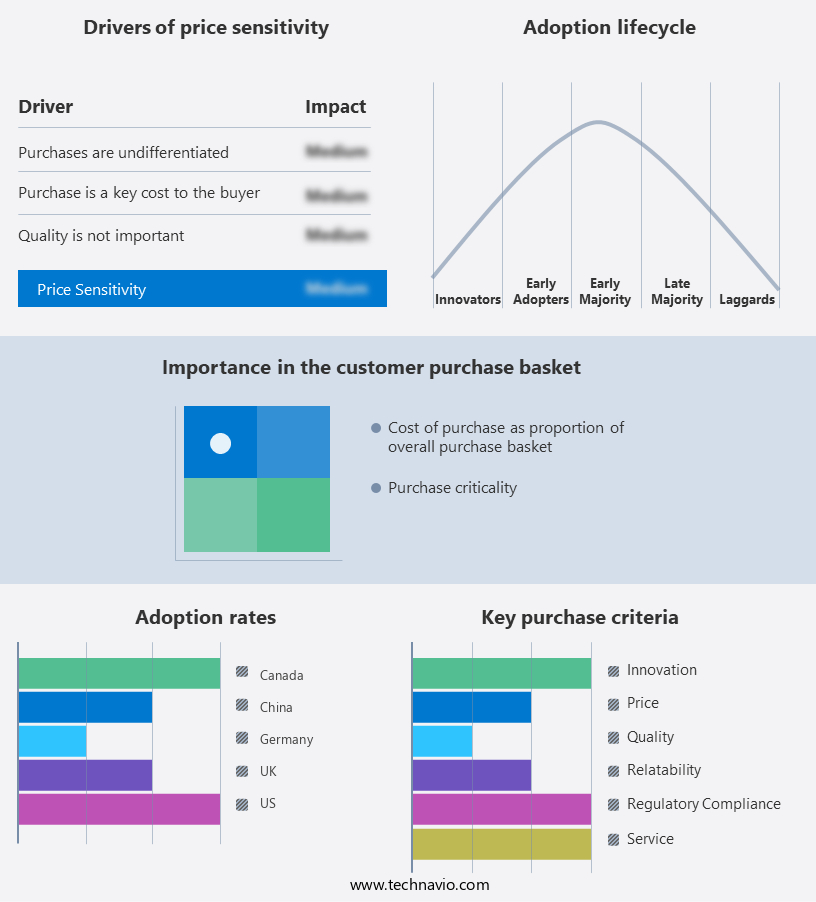
The liver cancer drugs market forecasting report includes the adoption lifecycle of the market, covering from the innovator's stage to the laggard's stage. It focuses on adoption rates in different regions based on penetration. Furthermore, the liver cancer drugs market report also includes key purchase criteria and drivers of price sensitivity to help companies evaluate and develop their market growth analysis strategies.
Customer Landscape
Key Companies & Market Insights
Companies are implementing various strategies, such as strategic alliances, liver cancer drugs market forecast, partnerships, mergers and acquisitions, geographical expansion, and product/service launches, to enhance their presence in the industry.
Alnylam Pharmaceuticals Inc. - The company offers RNAi-based therapeutics, including ALN-VSP, for the treatment of liver cancer.
The industry research and growth report includes detailed analyses of the competitive landscape of the market and information about key companies, including:
- Alnylam Pharmaceuticals Inc.
- AstraZeneca Plc
- Bayer AG
- Bristol Myers Squibb Co.
- Eisai Co. Ltd.
- Eli Lilly and Co.
- Eureka Therapeutics
- Exelixis Inc.
- F. Hoffmann La Roche Ltd.
- Gilead Sciences Inc.
- Jiangsu Hengrui Pharmaceuticals Co. Ltd.
- Lion TCR Pte. Ltd
- Merck and Co. Inc.
- Novartis AG
- Ono Pharmaceutical Co. Ltd.
- Pfizer Inc.
- Q BioMed Inc.
Qualitative and quantitative analysis of companies has been conducted to help clients understand the wider business environment as well as the strengths and weaknesses of key industry players. Data is qualitatively analyzed to categorize companies as pure play, category-focused, industry-focused, and diversified; it is quantitatively analyzed to categorize companies as dominant, leading, strong, tentative, and weak.
Research Analyst Overview
The liver cancer drugs market is witnessing significant advancements as research institutions explore new avenues for treating various stages of liver cancer. One promising area of focus is personalized medicine, which utilizes machine learning algorithms to analyze individual patient data and develop tailored treatment plans. Early-stage liver cancer patients may benefit from such approaches, as personalized treatment can lead to improved drug efficacy and overall survival. In the realm of advanced-stage liver cancer, clinical trial design is a critical factor in bringing new treatments to market. Hepatitis B and C are common risk factors for liver cancer, and ongoing research aims to address the unique challenges posed by these conditions in clinical trials.
Patient support and education are essential components of this process, as healthcare providers strive to ensure that patients are well-informed about their treatment options and potential adverse events. Drug safety is another crucial aspect of liver cancer drug development. Metastatic liver cancer patients often face significant challenges, including drug resistance and the tumor microenvironment's complexities. Precision medicine and targeted therapy are promising approaches to addressing these challenges, with the potential to improve patient outcomes and quality of life. Patient advocacy plays a vital role in advancing the liver cancer drug market. Biotechnology companies are collaborating with patient advocacy groups to develop clinical research initiatives that prioritize patient needs and preferences.
The Liver Cancer Drugs Market is evolving with molecularly targeted agents, focusing on angiogenesis inhibitors and cell cycle inhibitors to enhance clinical efficacy and improve the safety profile of treatment. Innovations in genetic testing and tumor profiling contribute to personalized treatment regimens, helping patients with advanced liver cancer receive optimal care. The industry prioritizes patient access to therapies, offering first-line therapy, second-line therapy, and adjuvant therapy based on individual needs. Emerging solutions such as stem cell therapy and gene therapy complement traditional liver transplantation, driving new possibilities in treatment. The payer landscape and healthcare policy shape affordability, while the regulatory landscape ensures safety and compliance. Investment in intellectual property safeguards innovations, and clinical data management enables precise predictive modeling for better outcomes. With treatment decision support systems advancing, professionals rely on data-driven strategies to improve patient care. The market's future hinges on balancing accessibility, regulation, and groundbreaking therapies, ensuring liver cancer treatment remains innovative and effective.
|
Market Scope |
|
|
Report Coverage |
Details |
|
Page number |
236 |
|
Base year |
2024 |
|
Historic period |
2019-2023 |
|
Forecast period |
2025-2029 |
|
Growth momentum & CAGR |
Accelerate at a CAGR of 10.7% |
|
Market growth 2025-2029 |
USD 3.86 billion |
|
Market structure |
Fragmented |
|
YoY growth 2024-2025(%) |
9.4 |
|
Key countries |
US, Germany, Canada, China, Japan, UK, France, India, Italy, and South Korea |
|
Competitive landscape |
Leading Companies, Market Positioning of Companies, Competitive Strategies, and Industry Risks |
What are the Key Data Covered in this Liver Cancer Drugs Market Research and Growth Report?
- CAGR of the Liver Cancer Drugs industry during the forecast period
- Detailed information on factors that will drive the growth and forecasting between 2025 and 2029
- Precise estimation of the size of the market and its contribution of the industry in focus to the parent market
- Accurate predictions about upcoming growth and trends and changes in consumer behaviour
- Growth of the market across North America, Europe, Asia, and Rest of World (ROW)
- Thorough analysis of the market's competitive landscape and detailed information about companies
- Comprehensive analysis of factors that will challenge the liver cancer drugs market growth and forecasting
We can help! Our analysts can customize this liver cancer drugs market research report to meet your requirements.
 RIA -
RIA - 
