LTE Iot Market Size 2025-2029
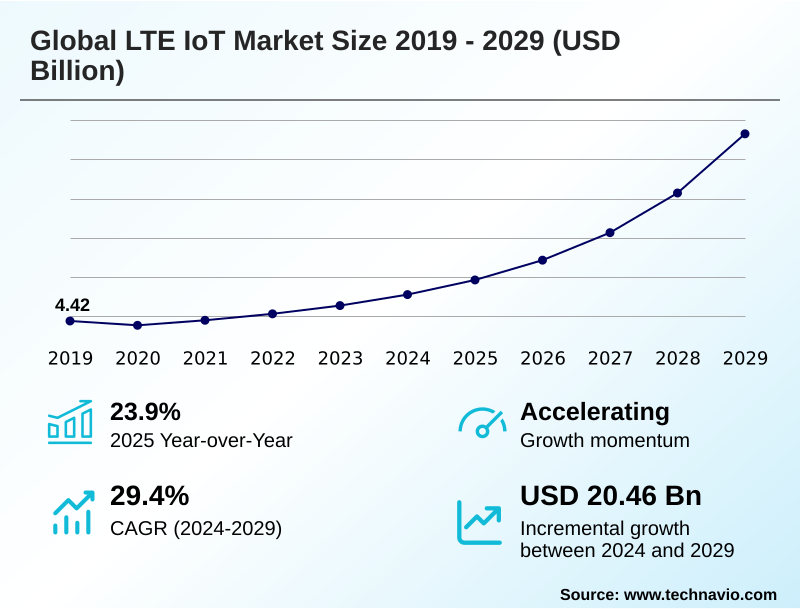
The lte iot market size is valued to increase by USD 20.46 billion, at a CAGR of 29.4% from 2024 to 2029. Proliferation of smart city initiatives and public infrastructure modernization will drive the lte iot market.
Major Market Trends & Insights
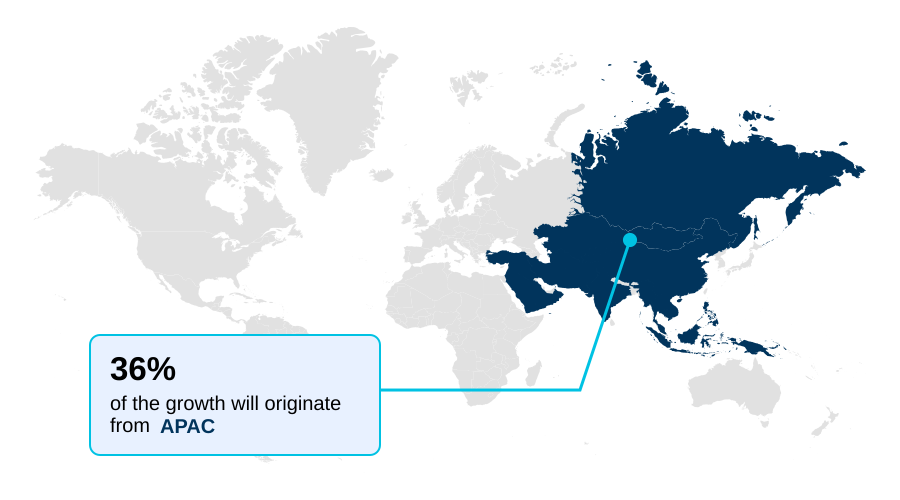
- APAC dominated the market and accounted for a 35.5% growth during the forecast period.
- By Technology - NB-IoT segment was valued at USD 5.21 billion in 2023
- By Application - Smart manufacturing segment accounted for the largest market revenue share in 2023
Market Size & Forecast
- Market Opportunities: USD 23.82 billion
- Market Future Opportunities: USD 20.46 billion
- CAGR from 2024 to 2029 : 29.4%
Market Summary
- The LTE IoT market is undergoing significant expansion, driven by the enterprise-wide push for digital transformation and operational efficiency. Technologies such as NB-IoT and LTE-M are becoming foundational for connecting a massive number of devices, offering a secure and scalable alternative to unlicensed LPWAN solutions.
- This growth is propelled by the rollout of smart city ecosystems and the modernization of public infrastructure, where reliable, low-power connectivity is essential for applications like intelligent utility management and environmental monitoring. A key trend is the integration of AI at the edge, enabling devices to perform local data processing, which reduces latency and data transmission costs.
- For instance, in supply chain logistics, a container equipped with an edge-enabled LTE IoT sensor can analyze temperature and vibration data in real-time, sending alerts only when anomalies are detected, thereby optimizing battery life and focusing bandwidth on critical events.
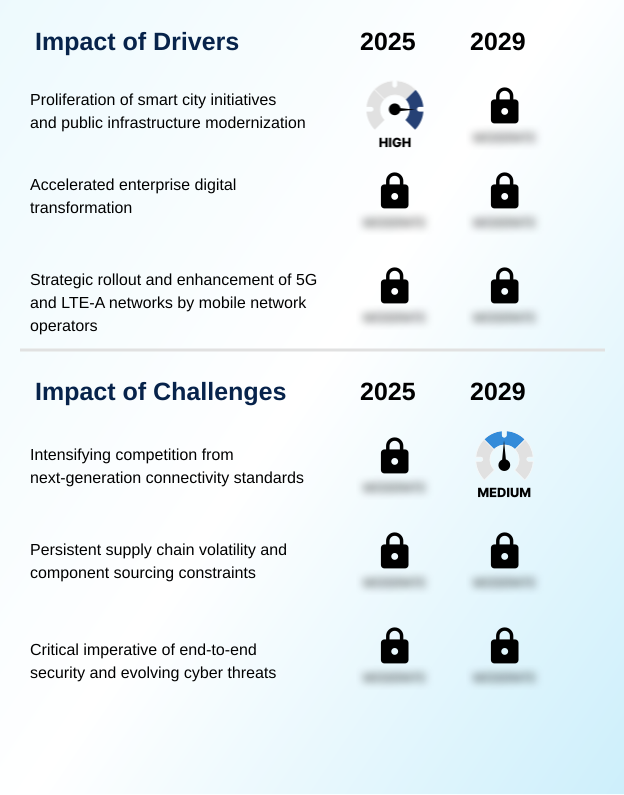
- However, the market faces challenges from the emergence of next-generation standards like 5G RedCap and persistent supply chain volatilities affecting component availability. End-to-end security remains a paramount concern as the scale of deployments increases, necessitating robust architectures to protect critical data and infrastructure from evolving cyber threats.
What will be the Size of the LTE Iot Market during the forecast period?
Get Key Insights on Market Forecast (PDF) Get Free Sample
How is the LTE Iot Market Segmented?
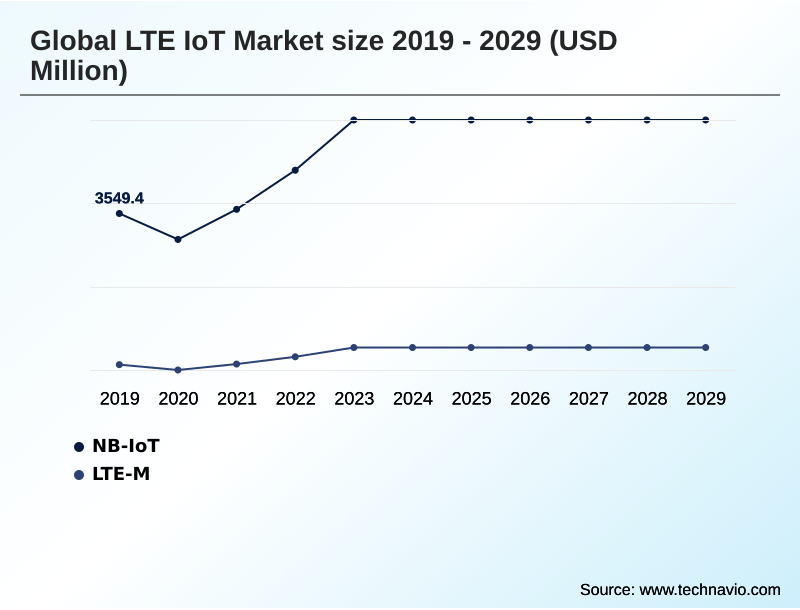
The lte iot industry research report provides comprehensive data (region-wise segment analysis), with forecasts and estimates in "USD million" for the period 2025-2029, as well as historical data from 2019-2023 for the following segments.
- Technology
- NB-IoT
- LTE-M
- Application
- Smart manufacturing
- Smart transportation
- Connected healthcare
- Others
- Service type
- Professional services
- Managed services
- Geography
- Europe
- Germany
- UK
- France
- North America
- US
- Canada
- Mexico
- APAC
- China
- Japan
- India
- Middle East and Africa
- UAE
- Saudi Arabia
- South Africa
- South America
- Brazil
- Argentina
- Rest of World (ROW)
- Europe
By Technology Insights
The nb-iot segment is estimated to witness significant growth during the forecast period.
The NB-IoT segment is engineered for massive Machine-Type Communications, representing a cornerstone of the low-power wide-area networks landscape. Its design prioritizes ultra-low power consumption, deep indoor penetration, and cost-efficiency, making it ideal for large-scale, stationary deployments.
Key applications include smart metering and smart city infrastructure, where devices transmit small data packets infrequently. The technology leverages licensed spectrum to ensure secure and reliable connectivity, a critical differentiator from unlicensed alternatives.
Features like extended discontinuous reception enable battery life spanning over a decade. In dense urban environments, NB-IoT is instrumental for connecting underground utility sensors, achieving up to 99.8% data transmission success in subterranean deployments, thereby ensuring consistent data for asset management.
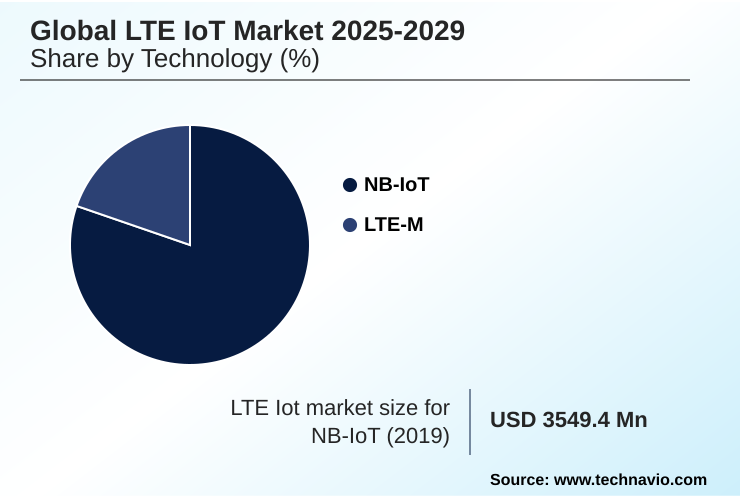
The NB-IoT segment was valued at USD 5.21 billion in 2023 and showed a gradual increase during the forecast period.
Regional Analysis
APAC is estimated to contribute 35.5% to the growth of the global market during the forecast period.Technavio’s analysts have elaborately explained the regional trends and drivers that shape the market during the forecast period.
See How LTE Iot Market Demand is Rising in APAC Get Free Sample
The geographic landscape is marked by distinct regional adoption patterns. In North America, the migration to LTE-M is accelerating, driven by enterprise demand for robust LPWAN solutions for fleet management and supply chain logistics.
Europe is focused on industrial control systems and connected healthcare, leveraging the SIM as a secure element for data protection. APAC leads in sheer volume, with massive deployments in China.
The maquiladora industry in Mexico is a key driver for cross-border asset tracking. In the Middle East, giga-projects are creating ground-up smart city infrastructures.
Meanwhile, South America and sub-Saharan Africa are seeing growth in precision irrigation and public safety applications, where LTE IoT's reach is critical. This diversity showcases the technology's adaptability, with some regions improving logistics efficiency by over 25%.
Market Dynamics
Our researchers analyzed the data with 2024 as the base year, along with the key drivers, trends, and challenges. A holistic analysis of drivers will help companies refine their marketing strategies to gain a competitive advantage.
- Enterprises evaluating connectivity options are increasingly conducting a detailed cost-benefit analysis of private LTE networks versus public offerings, especially for mission-critical industrial applications. The decision often hinges on the specific use case, with the LTE-M versus NB-IoT for mobility debate being central to solution design.
- For mobile asset tracking, LTE-M's handover capabilities are essential, while NB-IoT power consumption optimization techniques are paramount for stationary sensors requiring decade-plus battery life. A key focus is on the migration path from LTE IoT to 5G RedCap, ensuring long-term viability.
- Security remains a top priority, with an emphasis on leveraging SIM for end-to-end device security and implementing robust security protocols for licensed spectrum IoT. Deploying AI models on low-power IoT modules is a growing trend for enabling edge analytics, which can reduce data backhaul costs significantly.
- For example, firms focused on smart grid modernization have found that local processing of grid sensor data reduces irrelevant data transmission by more than half compared to raw data streaming. This is complemented by managed services for global IoT connectivity, which simplify device lifecycle management for remote assets and streamline cross-border roaming solutions for asset tracking.
What are the key market drivers leading to the rise in the adoption of LTE Iot Industry?
- The proliferation of smart city initiatives and the modernization of public infrastructure are key drivers of market growth.
- Market growth is fundamentally driven by the need for scalable and reliable massive Machine-Type Communications (mMTC). The rollout of public land mobile network enhancements and the deployment of private LTE networks for industrial campuses are lowering adoption barriers.
- Enterprises in advanced manufacturing are leveraging cellular IoT modules for digital twin projects, achieving a 15% increase in production line efficiency. Meanwhile, government mandates for advanced metering infrastructure are creating large-scale, predictable demand.
- This is complemented by private sector demand for cross-border interoperability in logistics, where real-time environmental monitoring of cargo is critical.
- In smart agriculture, the use of low-power chipsets for pipeline sensors and condition-based monitoring has reduced water consumption by up to 25%, highlighting the technology's broad applicability.
What are the market trends shaping the LTE Iot Industry?
- The strategic convergence of terrestrial LTE IoT and satellite networks is an emerging trend, driven by the need to ensure ubiquitous connectivity for global applications.
- Market trends are pushing the boundaries of connectivity and intelligence. The convergence of terrestrial networks with non-terrestrial networks, including satellite communication systems and geostationary orbit satellite links, is creating truly ubiquitous coverage. This hybrid approach has improved asset visibility in remote sectors by over 50%.
- Concurrently, the proliferation of powerful system-on-chips is driving the growth of edge computing platforms, enabling on-device AI for anomaly detection and predictive maintenance. This shift transforms devices into intelligent endpoints, with some industrial systems now processing computer vision tasks locally, reducing data transmission by 70%.
- These advancements, guided by standards like 3GPP Release 17, are foundational for the industrial metaverse and are enhancing smart grid automation and connected public transit systems.
What challenges does the LTE Iot Industry face during its growth?
- Intensifying competition from emerging next-generation connectivity standards presents a key challenge to the market's growth trajectory.
- Navigating the technology lifecycle presents a significant market challenge, with the emergence of 5G RedCap creating a complex upgrade path. Ensuring backward compatibility while investing in future standards requires careful planning.
- Security remains a critical concern, necessitating the adoption of zero-trust architectures and robust firmware over-the-air update mechanisms to protect devices like a continuous glucose monitor used for remote patient monitoring. Poorly managed updates can leave networks vulnerable, with unpatched devices being a primary entry point for breaches.
- Furthermore, optimizing device-level power saving mode and idle mode configurations is crucial for meeting long-battery-life promises, as inefficient settings can reduce operational lifespans by as much as 40%. These challenges in security, power management, and future-proofing must be addressed to maintain trust and ensure sustainable growth.
Exclusive Technavio Analysis on Customer Landscape
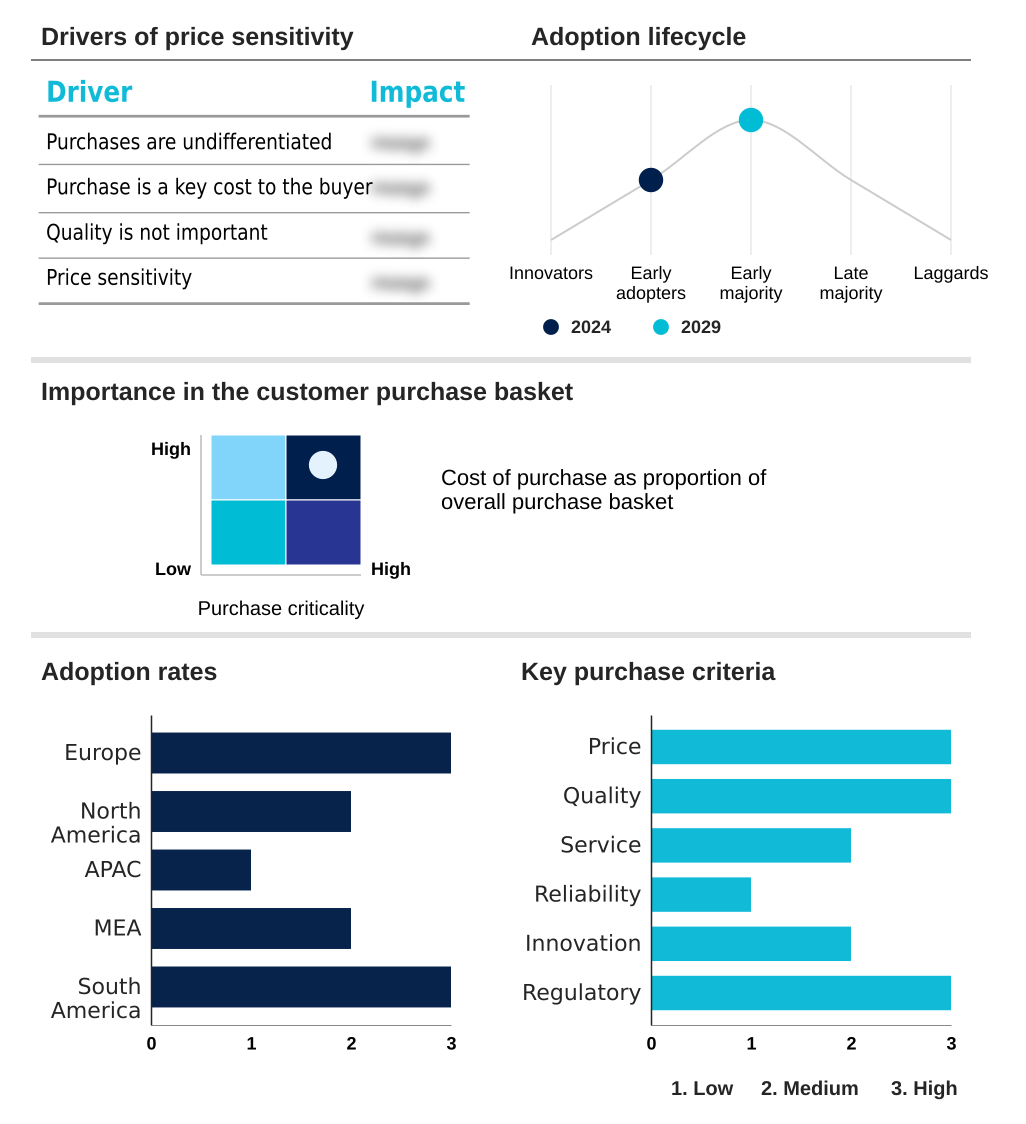
The lte iot market forecasting report includes the adoption lifecycle of the market, covering from the innovator’s stage to the laggard’s stage. It focuses on adoption rates in different regions based on penetration. Furthermore, the lte iot market report also includes key purchase criteria and drivers of price sensitivity to help companies evaluate and develop their market growth analysis strategies.
Customer Landscape of LTE Iot Industry
Competitive Landscape
Companies are implementing various strategies, such as strategic alliances, lte iot market forecast, partnerships, mergers and acquisitions, geographical expansion, and product/service launches, to enhance their presence in the industry.
Accent Advanced Systems SLU - Key offerings focus on providing secure cellular connectivity, integrated device solutions, and enterprise-grade fleet management platforms for scalable deployments.
The industry research and growth report includes detailed analyses of the competitive landscape of the market and information about key companies, including:
- Accent Advanced Systems SLU
- Actility SA
- AT and T Inc.
- Cisco Systems Inc.
- Cradlepoint Inc.
- Huawei Technologies Co. Ltd.
- Intel Corp.
- Link Labs Inc.
- MediaTek Inc.
- Nokia Corp.
- Orange SA
- Qualcomm Inc.
- Renesas Electronics Corp.
- Schneider Electric SE
- Sequans Communications SA
- Sierra Wireless Inc.
- Telefonaktiebolaget Ericsson
- Telit Cinterion
- TELUS Corp.
- Thales Group
Qualitative and quantitative analysis of companies has been conducted to help clients understand the wider business environment as well as the strengths and weaknesses of key industry players. Data is qualitatively analyzed to categorize companies as pure play, category-focused, industry-focused, and diversified; it is quantitatively analyzed to categorize companies as dominant, leading, strong, tentative, and weak.
Recent Development and News in Lte iot market
- In October 2024, the government of India initiated its Revamped Distribution Sector Scheme, aiming to install 250 million smart meters communicating via NB-IoT networks by 2027 to improve national grid efficiency.
- In November 2024, Deutsche Telekom, Qualcomm, and Skylo announced the successful completion of an end-to-end trial sending SMS messages over a GEO satellite, marking the first integration of a European terrestrial mobile network with a satellite network under 3GPP Release 17 specifications.
- In August 2024, Deutsche Telekom IoT GmbH, a subsidiary of Deutsche Telekom, became a member of the Bridge Alliance, joining 35 mobile communication companies to expand flexible IoT and M2M connectivity services across Asia Pacific, the Middle East, Africa, and Europe.
- In April 2025, Vodafone expanded its partnership with Suez to accelerate the global deployment of over two million remote water meters utilizing NB-IoT technology, with the project slated for completion by 2030.
Dive into Technavio’s robust research methodology, blending expert interviews, extensive data synthesis, and validated models for unparalleled LTE Iot Market insights. See full methodology.
| Market Scope | |
|---|---|
| Page number | 297 |
| Base year | 2024 |
| Historic period | 2019-2023 |
| Forecast period | 2025-2029 |
| Growth momentum & CAGR | Accelerate at a CAGR of 29.4% |
| Market growth 2025-2029 | USD 20456.0 million |
| Market structure | Fragmented |
| YoY growth 2024-2025(%) | 23.9% |
| Key countries | Germany, UK, France, Italy, Spain, The Netherlands, US, Canada, Mexico, China, Japan, India, South Korea, Australia, Indonesia, UAE, Saudi Arabia, South Africa, Egypt, Nigeria, Brazil, Argentina and Chile |
| Competitive landscape | Leading Companies, Market Positioning of Companies, Competitive Strategies, and Industry Risks |
Research Analyst Overview
- The LTE IoT market is defined by a landscape of specialized technologies designed for massive Machine-Type Communications. Core offerings like NB-IoT and LTE-M operate on licensed spectrum, providing a foundation for low-power wide-area networks with features like deep indoor penetration and extended discontinuous reception. This enables critical applications such as remote patient monitoring and advanced metering infrastructure.
- A pivotal trend is the convergence with non-terrestrial networks, integrating satellite communication systems for ubiquitous coverage, a factor that directly impacts boardroom decisions on global supply chain strategy. For example, companies adopting hybrid cellular-satellite asset trackers have reported a 40% reduction in lost-asset incidents in remote regions.
- The ecosystem is also advancing through new system-on-chips and embedded MCUs that support edge computing platforms, facilitating the deployment of digital twin projects. Security is paramount, with a shift toward zero-trust architectures and the use of the SIM as a secure element to counter threats.
- The evolution, governed by standards like 3GPP Release 17 and 18, is pushing the industry toward more integrated solutions like cloud-managed networking and away from legacy systems.
What are the Key Data Covered in this LTE Iot Market Research and Growth Report?
-
What is the expected growth of the LTE Iot Market between 2025 and 2029?
-
USD 20.46 billion, at a CAGR of 29.4%
-
-
What segmentation does the market report cover?
-
The report is segmented by Technology (NB-IoT, and LTE-M), Application (Smart manufacturing, Smart transportation, Connected healthcare, and Others), Service Type (Professional services, and Managed services) and Geography (Europe, North America, APAC, Middle East and Africa, South America)
-
-
Which regions are analyzed in the report?
-
Europe, North America, APAC, Middle East and Africa and South America
-
-
What are the key growth drivers and market challenges?
-
Proliferation of smart city initiatives and public infrastructure modernization, Intensifying competition from next-generation connectivity standards
-
-
Who are the major players in the LTE Iot Market?
-
Accent Advanced Systems SLU, Actility SA, AT and T Inc., Cisco Systems Inc., Cradlepoint Inc., Huawei Technologies Co. Ltd., Intel Corp., Link Labs Inc., MediaTek Inc., Nokia Corp., Orange SA, Qualcomm Inc., Renesas Electronics Corp., Schneider Electric SE, Sequans Communications SA, Sierra Wireless Inc., Telefonaktiebolaget Ericsson, Telit Cinterion, TELUS Corp. and Thales Group
-
Market Research Insights
- The market's dynamics are shaped by accelerating digital transformation across key sectors. In advanced manufacturing, the adoption of condition-based monitoring has reduced machinery downtime by up to 25% by leveraging real-time data from connected sensors. Smart transportation and fleet management initiatives are achieving fuel efficiency gains of over 15% through optimized routing based on data from asset tracking devices.
- Connected healthcare is another pivotal area, where remote patient monitoring solutions are helping lower hospital readmission rates. The proliferation of smart city infrastructure, including smart parking sensors and waste management monitoring, is improving urban operational efficiency.
- This is further supported by growth in smart agriculture, where precision irrigation techniques are being deployed to manage water resources more effectively, showcasing the broad impact of scalable, low-power connectivity solutions.
We can help! Our analysts can customize this lte iot market research report to meet your requirements.
 RIA -
RIA - 
