Lubricant Viscosity Grade Improvers Market Analysis APAC, Europe, North America, Middle East and Africa, South America - China, US, Japan, Germany, India - Size and Forecast 2024-2028

Lubricant Viscosity Grade Improvers Market Analysis APAC, Europe, North America, Middle East and Africa, South America - China, US, Japan, Germany, India - Size and Forecast 2024-2028

Published: May 2024 177 Pages SKU: IRTNTR75308

Market Overview at a Glance

$452.7 Mn
Market Opportunity
2.09%
CAGR
2.03
YoY growth 2023-2024(%)

Lubricant Viscosity Grade Improvers Market Size 2024-2028 

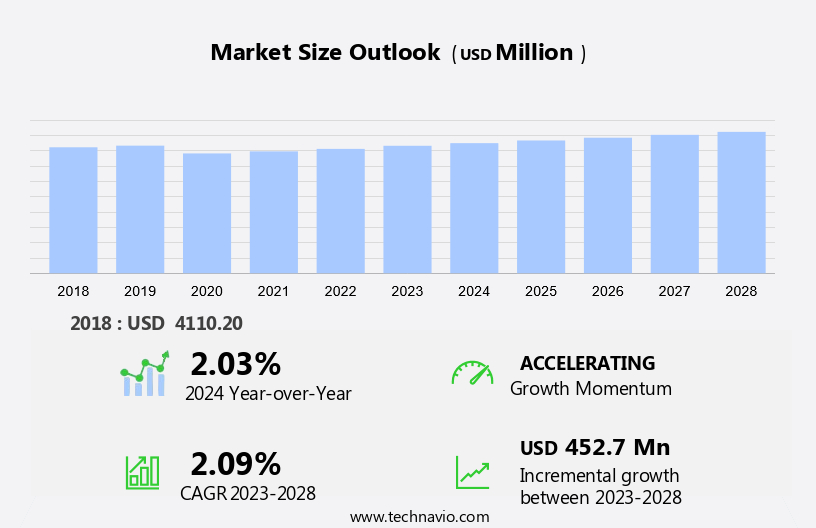
The lubricant viscosity grade improvers market size is forecast to increase by USD 452.7 million at a CAGR of 2.09% between 2023 and 2028. The growth of the market depends on several factors, including increasing demand from end-user industries, the rising need for reliable machinery and effective maintenance, and growing investment in the infrastructure sector in APAC. These elements collectively drive market expansion by addressing industrial needs, ensuring operational efficiency, and capitalizing on regional development. The increasing demand from end-user industries highlights the diverse applications and reliance on market products.

Simultaneously, the rising need for reliable machinery and effective maintenance underscores the importance of minimizing downtime and enhancing productivity. Additionally, growing investment in the infrastructure sector in APAC reflects significant regional growth opportunities and development projects.

Market Analysis

Lubricant Viscosity Grade Improvers Market Size

 Request Free Sample

The market is experiencing significant growth in various industries, including the Automotive and Industrial sectors. This market expansion is driven by the increasing demand for high-performance lubricants in applications such as Automobiles, Braking fluids, Transmission lubricants, and Engine lubricants. Olefin Copolymer, a key additive used in the production of viscosity index improvers, plays a crucial role in enhancing the performance of lubricants. The Automotive Industry's growth, fueled by rising automobile output and the pursuit of improved fuel economy, is a significant factor driving the demand for lubricants with improved viscosity properties. Operating temperatures in machinery and the energy sector also necessitate the use of lubricants with optimal viscosity to ensure efficient performance and prolonged equipment life.

Industrial applications, including the use of lubricants in Drilling fluids, Metalworking fluids, and Quenching oils, further expand the market potential for viscosity grade improvers. The development and adoption of advanced industrial additives and technologies to enhance the viscosity properties of lubricants are expected to fuel market growth in the coming years.

Market Segmentation

The market research report provides comprehensive data (region-wise segment analysis), with forecasts and estimates in "USD million" for the period 2024-2028, as well as historical data from 2018-2022 for the following segments.

  • Application
    • Vehicle lubricants
    • Industrial lubricants
  • Product
    • Polymethacrylate (PMA)
    • Hydrostyrene diene copolymer (HSD)
    • Polyisobutylene (PIB) and others
  • Geography
    • APAC
      • China
      • India
      • Japan
    • Europe
      • Germany
    • North America
      • US
    • Middle East and Africa
    • South America

By Application Insights

The vehicle lubricants segment is estimated to witness significant growth during the forecast period. The market encompasses specialty chemical companies that produce additives to enhance the performance and compatibility of lubricants. These additives, primarily petroleum-based, contribute significantly to energy efficiency and regulatory compliance in various sectors. In the automotive industry, they improve engine performance, protection, and fuel efficiency, while in the marine and aerospace sectors, they ensure equipment performance and sustainability under harsh conditions. In the energy sector, high-lube additives extend service life and ensure temperature resistance, shear stability, and pour point performance in industrial lubricants, drilling and completion fluids, and metalworking fluids. Regulatory standards, such as those related to emissions, necessitate the use of innovative products that offer benefits like friction reduction, film strength, and lubricant formulation requirements.

Polymethacrylate Viscosity Index and other advanced technologies enable these companies to meet the evolving demands for sustainable lubricant solutions in diverse industries. Environmental regulations continue to shape the market, driving the need for lubricants that offer superior performance and environmental sustainability. As awareness of these benefits grows, the demand for viscosity grade improvers is expected to increase, ensuring a strong future for this market.

Lubricant Viscosity Grade Improvers Market Size

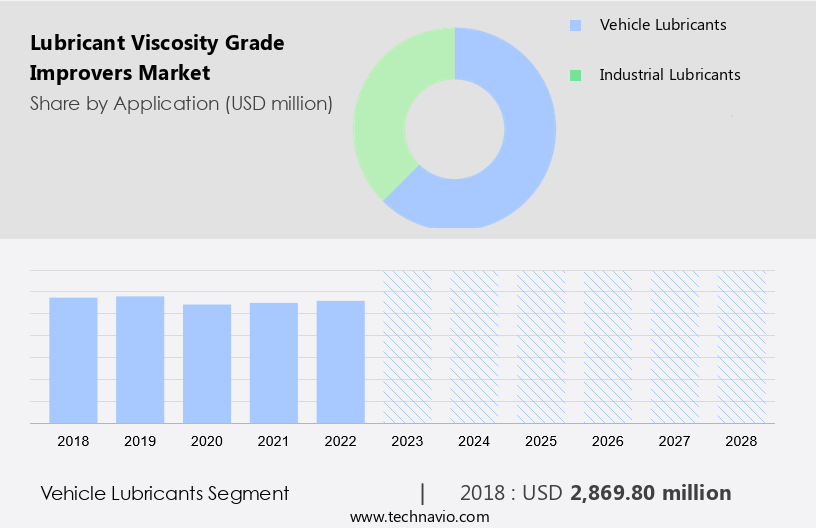
Get a glance at the market share of various segments Request Free Sample

The vehicle lubricants segment accounted for USD 2.87 billion in 2018 and showed a gradual increase during the forecast period.

Regional Insights

North America is estimated to contribute 33% to the growth of the global market during the forecast period. Technavio's analysts have elaborately explained the regional trends and drivers that shape the market during the forecast period.

Lubricant Viscosity Grade Improvers Market Share by Geography

For more insights on the market share of various regions Request Free Sample

The market encompasses specialty chemical companies that produce additives to enhance the performance and compatibility of lubricants. These additives, primarily petroleum-based, contribute significantly to energy efficiency and regulatory compliance in various sectors. In the automotive industry, they improve engine performance, protection, and fuel efficiency, while in the marine and aerospace sectors, they ensure equipment performance and sustainability under harsh conditions. In the energy sector, high-lube additives extend service life and ensure temperature resistance, shear stability, and pour point performance in industrial lubricants, drilling fluids, and metalworking fluids. Regulatory standards, such as those related to emissions, necessitate the use of innovative products that offer benefits like friction reduction, film strength, and lubricant formulation requirements.

Key players in this market, including Oronite, Infineum, Afton, Evonik, Sanyo Chemical, and BPT Chemical, have demonstrated financial performance through sales revenue growth and successful product development. Polymethacrylate Viscosity Index and other advanced technologies enable these companies to meet the evolving demands for sustainable lubricant solutions in diverse industries. Environmental regulations continue to shape the market, driving the need for lubricants that offer superior performance and environmental sustainability. As awareness of these benefits grows, the demand for viscosity grade improvers is expected to increase, ensuring a strong future for this market.

Market Dynamics

Our researchers analyzed the data with 2023 as the base year, along with the key drivers, trends, and challenges. A holistic analysis of drivers will help companies refine their marketing strategies to gain a competitive advantage.

Market Driver

Increasing demand from end-user industries is the key driver of the market. The market experiences significant demand from various industries beyond automotive, including construction, steel and cement, mining, and oil drilling, and marine. In the construction sector, lubricants are indispensable in construction equipment due to their anti-wear properties, resistance to corrosion, superior lubricity, water tolerance, and filterability. These characteristics enable efficient energy transmission in equipment such as crawler excavators, mini excavators, wheeled excavators, wheeled dozers, and skid-steer loaders. In the steel and cement industry, lubricants play a crucial role in enhancing the performance and longevity of machinery. They extend drain intervals, boost lubrication efficiency, fortify wear resistance of friction pairs, and ultimately, extend the lifespan of the equipment.

The demand for lubricant viscosity grade improvers is also driven by the need for quenching oils in the steel industry, which require viscosity modifiers to maintain their optimal performance and ensure consistent fuel economy in automobile output.

Market Trends

The rise in adoption of nanotechnology in viscosity grade improvers is the upcoming trend in the market. Nanotechnology significantly enhances the performance of lubricant viscosity grade improvers in the automotive industry. These additives play a crucial role in improving the flow properties of quenching oils and extending engine life by minimizing friction. Conventional viscosity grade improvers, which are based on large polymer molecules, have a drawback of degrading rapidly, leading to altered viscosity and reduced lubricant efficiency. In contrast, nanotechnology-driven viscosity improvers, incorporating nanoparticles, offer enhanced benefits. By optimizing fuel economy and contributing to increased automobile output, these advanced additives represent a promising development in the lubricant market.

Market Challenge

Fluctuation in crude oil prices is a key challenge affecting the market growth. The market experiences significant challenges due to the volatile pricing of essential raw materials, including quenching oils derived from thermoplastic polymers. These materials have seen price instability since 2015. Furthermore, as lubricant viscosity grade improvers are derived from petroleum and natural gas, their prices are subject to the market fluctuations of these resources. Unpredictable price swings in crude oil and its derivatives can significantly impact the market. In the automotive sector, the use of these quenching oils plays a crucial role in enhancing fuel economy and optimizing automobile output. Consequently, market stability relies heavily on the consistent pricing of these raw materials.

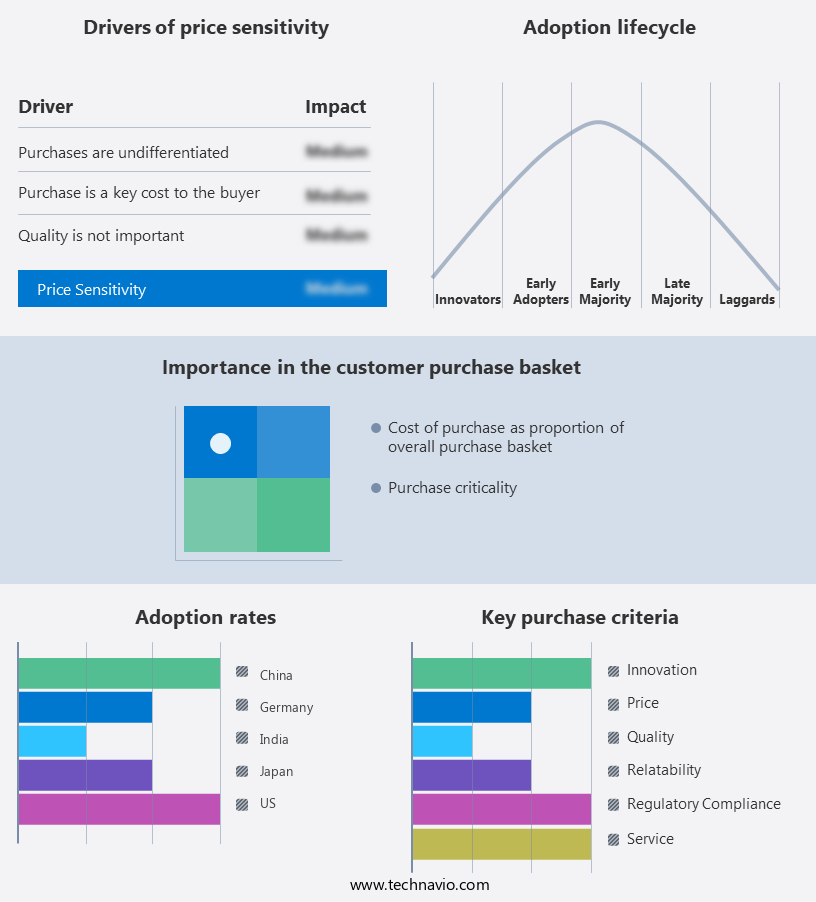
Exclusive Customer Landscape

The market forecasting report includes the adoption lifecycle of the market, covering from the innovator's stage to the laggard's stage. It focuses on adoption rates in different regions based on penetration. Furthermore, the report also includes key purchase criteria and drivers of price sensitivity to help companies evaluate and develop their market growth analysis strategies.

Lubricant Viscosity Grade Improvers Market Share by Geography

 Customer Landscape

Key Companies & Market Insights

Companies are implementing various strategies, such as strategic alliances, partnerships, mergers and acquisitions, geographical expansion, and product/service launches, to enhance their presence in the market.

BPT Chemicals Co. Ltd.: The company offers lubricant viscosity grade improvers such as BPT Viscotech EPC-100, BPT Viscotech OCP-100, and BPT Viscotech SIS-100. Also, the company specializes in the manufacturing of viscosity index improvers.

The market research and growth report includes detailed analyses of the competitive landscape of the market and information about key companies, including:

  • American Hitech Petroleum and Chemicals Inc.
  • Asian Oil Co.
  • BASF SE
  • CHETAS BIOCHEM
  • Chevron Corp.
  • Croda International Plc
  • Eni SpA
  • Evonik Industries AG
  • Goodway Chemicals Pvt. Ltd.
  • Innov Oil Pte Ltd.
  • Jinzhou Kangtai Lubricant Additives Co. Ltd.
  • Lanxess AG
  • Mitsui Chemicals Inc.
  • NewMarket Corp.
  • PETRONAS Chemicals Group Berhad
  • Sanyo Chemical Industries Ltd.
  • Shanghai Minglan Chemical Co. Ltd.
  • Shell plc
  • The Lubrizol Corp.

Qualitative and quantitative analysis of companies has been conducted to help clients understand the wider business environment as well as the strengths and weaknesses of key market players. Data is qualitatively analyzed to categorize companies as pure play, category-focused, industry-focused, and diversified; it is quantitatively analyzed to categorize companies as dominant, leading, strong, tentative, and weak.

Research Analyst Overview

The market plays a crucial role in enhancing the performance of lubricants by adjusting their viscosity properties. These improvers are essential in various industries such as automotive, industrial, and power generation. The demand for lubricant viscosity grade improvers is driven by factors like increasing machinery usage, rising fuel efficiency requirements, and the need for extended oil drain intervals. Lubricant viscosity grade improvers are available in different types, including organic and inorganic. Organic improvers are derived from natural sources, while inorganic improvers are synthetic. The choice of improver type depends on the specific application requirements and the desired viscosity properties.

The market for lubricant viscosity grade improvers is expected to grow significantly due to the increasing demand for high-performance lubricants in various end-use industries. Additionally, the ongoing research and development activities aimed at improving the efficiency and effectiveness of lubricant viscosity grade improvers are expected to further fuel market growth. The key players in the market focus on expanding their product portfolios, enhancing their production capabilities, and exploring new markets to meet the growing demand for these products. Some of the common applications of lubricant viscosity grade improvers include engine oils, gear oils, hydraulic fluids, and turbine oils.

In conclusion, the market is a significant and growing market, driven by the increasing demand for high-performance lubricants in various industries. The market is expected to continue growing due to ongoing research and development activities and the expanding application scope of these products.

Market Scope

Report Coverage

Details

Page number

177

Base year

2023

Historic period

2018-2022

Forecast period

2024-2028

Growth momentum & CAGR

Accelerate at a CAGR of 2.09%

Market growth 2024-2028

USD 452.7 million

Market structure

Fragmented

YoY growth 2023-2024(%)

2.03

Regional analysis

APAC, Europe, North America, Middle East and Africa, and South America

Performing market contribution

North America at 33%

Key countries

China, US, Japan, Germany, and India

Competitive landscape

Leading Companies, Market Positioning of Companies, Competitive Strategies, and Industry Risks

Key companies profiled

American Hitech Petroleum and Chemicals Inc., Asian Oil Co., BASF SE, BPT Chemicals Co. Ltd., CHETAS BIOCHEM, Chevron Corp., Croda International Plc, Eni SpA, Evonik Industries AG, Goodway Chemicals Pvt. Ltd., Innov Oil Pte Ltd., Jinzhou Kangtai Lubricant Additives Co. Ltd., Lanxess AG, Mitsui Chemicals Inc., NewMarket Corp., PETRONAS Chemicals Group Berhad, Sanyo Chemical Industries Ltd., Shanghai Minglan Chemical Co. Ltd., Shell plc, and The Lubrizol Corp.

Market dynamics

Parent market analysis, market growth inducers and obstacles, market forecast, fast-growing and slow-growing segment analysis, COVID-19 impact and recovery analysis and future consumer dynamics, market condition analysis for the forecast period

Customization purview

If our market report has not included the data that you are looking for, you can reach out to our analysts and get segments customized.

Request Free Sample

What are the Key Data Covered in this Market Research and Growth Report?

  • CAGR of the market during the forecast period
  • Detailed information on factors that will drive the market growth and forecasting between 2024 and 2028
  • Precise estimation of the size of the market  and its contribution of the market in focus to the parent market
  • Accurate predictions about upcoming market growth and trends and changes in consumer behaviour
  • Growth of the market across APAC, Europe, North America, Middle East and Africa, and South America
  • Thorough analysis of the market's competitive landscape and detailed information about companies
  • Comprehensive analysis of factors that will challenge the growth of market companies

We can help! Our analysts can customize this market research report to meet your requirements. Get in touch

1 Executive Summary

  • 1.1 Market overview
    • Executive Summary - Chart on Market Overview
    • Executive Summary - Data Table on Market Overview
    • Executive Summary - Chart on Global Market Characteristics
    • Executive Summary - Chart on Market by Geography
    • Executive Summary - Chart on Market Segmentation by Application
    • Executive Summary - Chart on Market Segmentation by Product
    • Executive Summary - Chart on Incremental Growth
    • Executive Summary - Data Table on Incremental Growth
    • Executive Summary - Chart on Company Market Positioning

2 Market Landscape

  • 2.1 Market ecosystem
    • Parent Market
    • Data Table on - Parent Market
  • 2.2 Market characteristics
    • Market characteristics analysis
  • 2.3 Value chain analysis
    • Value Chain Analysis

3 Market Sizing

  • 3.1 Market definition
    • Offerings of companies included in the market definition
  • 3.2 Market segment analysis
    • Market segments
  • 3.3 Market size 2023
    • 3.4 Market outlook: Forecast for 2023-2028
      • Chart on Global - Market size and forecast 2023-2028 ($ million)
      • Data Table on Global - Market size and forecast 2023-2028 ($ million)
      • Chart on Global Market: Year-over-year growth 2023-2028 (%)
      • Data Table on Global Market: Year-over-year growth 2023-2028 (%)

    4 Historic Market Size

    • 4.1 Global Lubricant Viscosity Grade Improvers Market 2018 - 2022
      • Historic Market Size - Data Table on Global Lubricant Viscosity Grade Improvers Market 2018 - 2022 ($ million)
    • 4.2 Application segment analysis 2018 - 2022
      • Historic Market Size - Application Segment 2018 - 2022 ($ million)
    • 4.3 Product segment analysis 2018 - 2022
      • Historic Market Size - Product Segment 2018 - 2022 ($ million)
    • 4.4 Geography segment analysis 2018 - 2022
      • Historic Market Size - Geography Segment 2018 - 2022 ($ million)
    • 4.5 Country segment analysis 2018 - 2022
      • Historic Market Size - Country Segment 2018 - 2022 ($ million)

    5 Five Forces Analysis

    • 5.1 Five forces summary
      • Five forces analysis - Comparison between 2023 and 2028
    • 5.2 Bargaining power of buyers
      • Bargaining power of buyers - Impact of key factors 2023 and 2028
    • 5.3 Bargaining power of suppliers
      • Bargaining power of suppliers - Impact of key factors in 2023 and 2028
    • 5.4 Threat of new entrants
      • Threat of new entrants - Impact of key factors in 2023 and 2028
    • 5.5 Threat of substitutes
      • Threat of substitutes - Impact of key factors in 2023 and 2028
    • 5.6 Threat of rivalry
      • Threat of rivalry - Impact of key factors in 2023 and 2028
    • 5.7 Market condition
      • Chart on Market condition - Five forces 2023 and 2028

    6 Market Segmentation by Application

    • 6.1 Market segments
      • Chart on Application - Market share 2023-2028 (%)
      • Data Table on Application - Market share 2023-2028 (%)
    • 6.2 Comparison by Application
      • Chart on Comparison by Application
      • Data Table on Comparison by Application
    • 6.3 Vehicle lubricants - Market size and forecast 2023-2028
      • Chart on Vehicle lubricants - Market size and forecast 2023-2028 ($ million)
      • Data Table on Vehicle lubricants - Market size and forecast 2023-2028 ($ million)
      • Chart on Vehicle lubricants - Year-over-year growth 2023-2028 (%)
      • Data Table on Vehicle lubricants - Year-over-year growth 2023-2028 (%)
    • 6.4 Industrial lubricants - Market size and forecast 2023-2028
      • Chart on Industrial lubricants - Market size and forecast 2023-2028 ($ million)
      • Data Table on Industrial lubricants - Market size and forecast 2023-2028 ($ million)
      • Chart on Industrial lubricants - Year-over-year growth 2023-2028 (%)
      • Data Table on Industrial lubricants - Year-over-year growth 2023-2028 (%)
    • 6.5 Market opportunity by Application
      • Market opportunity by Application ($ million)
      • Data Table on Market opportunity by Application ($ million)

    7 Market Segmentation by Product

    • 7.1 Market segments
      • Chart on Product - Market share 2023-2028 (%)
      • Data Table on Product - Market share 2023-2028 (%)
    • 7.2 Comparison by Product
      • Chart on Comparison by Product
      • Data Table on Comparison by Product
    • 7.3 Polymethacrylate (PMA) - Market size and forecast 2023-2028
      • Chart on Polymethacrylate (PMA) - Market size and forecast 2023-2028 ($ million)
      • Data Table on Polymethacrylate (PMA) - Market size and forecast 2023-2028 ($ million)
      • Chart on Polymethacrylate (PMA) - Year-over-year growth 2023-2028 (%)
      • Data Table on Polymethacrylate (PMA) - Year-over-year growth 2023-2028 (%)
    • 7.4 Hydrostyrene diene copolymer (HSD) - Market size and forecast 2023-2028
      • Chart on Hydrostyrene diene copolymer (HSD) - Market size and forecast 2023-2028 ($ million)
      • Data Table on Hydrostyrene diene copolymer (HSD) - Market size and forecast 2023-2028 ($ million)
      • Chart on Hydrostyrene diene copolymer (HSD) - Year-over-year growth 2023-2028 (%)
      • Data Table on Hydrostyrene diene copolymer (HSD) - Year-over-year growth 2023-2028 (%)
    • 7.5 Polyisobutylene (PIB) and others - Market size and forecast 2023-2028
      • Chart on Polyisobutylene (PIB) and others - Market size and forecast 2023-2028 ($ million)
      • Data Table on Polyisobutylene (PIB) and others - Market size and forecast 2023-2028 ($ million)
      • Chart on Polyisobutylene (PIB) and others - Year-over-year growth 2023-2028 (%)
      • Data Table on Polyisobutylene (PIB) and others - Year-over-year growth 2023-2028 (%)
    • 7.6 Market opportunity by Product
      • Market opportunity by Product ($ million)
      • Data Table on Market opportunity by Product ($ million)

    8 Customer Landscape

    • 8.1 Customer landscape overview
      • Analysis of price sensitivity, lifecycle, customer purchase basket, adoption rates, and purchase criteria

    9 Geographic Landscape

    • 9.1 Geographic segmentation
      • Chart on Market share by geography 2023-2028 (%)
      • Data Table on Market share by geography 2023-2028 (%)
    • 9.2 Geographic comparison
      • Chart on Geographic comparison
      • Data Table on Geographic comparison
    • 9.3 APAC - Market size and forecast 2023-2028
      • Chart on APAC - Market size and forecast 2023-2028 ($ million)
      • Data Table on APAC - Market size and forecast 2023-2028 ($ million)
      • Chart on APAC - Year-over-year growth 2023-2028 (%)
      • Data Table on APAC - Year-over-year growth 2023-2028 (%)
    • 9.4 Europe - Market size and forecast 2023-2028
      • Chart on Europe - Market size and forecast 2023-2028 ($ million)
      • Data Table on Europe - Market size and forecast 2023-2028 ($ million)
      • Chart on Europe - Year-over-year growth 2023-2028 (%)
      • Data Table on Europe - Year-over-year growth 2023-2028 (%)
    • 9.5 North America - Market size and forecast 2023-2028
      • Chart on North America - Market size and forecast 2023-2028 ($ million)
      • Data Table on North America - Market size and forecast 2023-2028 ($ million)
      • Chart on North America - Year-over-year growth 2023-2028 (%)
      • Data Table on North America - Year-over-year growth 2023-2028 (%)
    • 9.6 Middle East and Africa - Market size and forecast 2023-2028
      • Chart on Middle East and Africa - Market size and forecast 2023-2028 ($ million)
      • Data Table on Middle East and Africa - Market size and forecast 2023-2028 ($ million)
      • Chart on Middle East and Africa - Year-over-year growth 2023-2028 (%)
      • Data Table on Middle East and Africa - Year-over-year growth 2023-2028 (%)
    • 9.7 South America - Market size and forecast 2023-2028
      • Chart on South America - Market size and forecast 2023-2028 ($ million)
      • Data Table on South America - Market size and forecast 2023-2028 ($ million)
      • Chart on South America - Year-over-year growth 2023-2028 (%)
      • Data Table on South America - Year-over-year growth 2023-2028 (%)
    • 9.8 China - Market size and forecast 2023-2028
      • Chart on China - Market size and forecast 2023-2028 ($ million)
      • Data Table on China - Market size and forecast 2023-2028 ($ million)
      • Chart on China - Year-over-year growth 2023-2028 (%)
      • Data Table on China - Year-over-year growth 2023-2028 (%)
    • 9.9 US - Market size and forecast 2023-2028
      • Chart on US - Market size and forecast 2023-2028 ($ million)
      • Data Table on US - Market size and forecast 2023-2028 ($ million)
      • Chart on US - Year-over-year growth 2023-2028 (%)
      • Data Table on US - Year-over-year growth 2023-2028 (%)
    • 9.10 Japan - Market size and forecast 2023-2028
      • Chart on Japan - Market size and forecast 2023-2028 ($ million)
      • Data Table on Japan - Market size and forecast 2023-2028 ($ million)
      • Chart on Japan - Year-over-year growth 2023-2028 (%)
      • Data Table on Japan - Year-over-year growth 2023-2028 (%)
    • 9.11 Germany - Market size and forecast 2023-2028
      • Chart on Germany - Market size and forecast 2023-2028 ($ million)
      • Data Table on Germany - Market size and forecast 2023-2028 ($ million)
      • Chart on Germany - Year-over-year growth 2023-2028 (%)
      • Data Table on Germany - Year-over-year growth 2023-2028 (%)
    • 9.12 India - Market size and forecast 2023-2028
      • Chart on India - Market size and forecast 2023-2028 ($ million)
      • Data Table on India - Market size and forecast 2023-2028 ($ million)
      • Chart on India - Year-over-year growth 2023-2028 (%)
      • Data Table on India - Year-over-year growth 2023-2028 (%)
    • 9.13 Market opportunity by geography
      • Market opportunity by geography ($ million)
      • Data Tables on Market opportunity by geography ($ million)

    10 Drivers, Challenges, and Opportunity/Restraints

    • 10.1 Market drivers
      • 10.2 Market challenges
        • 10.3 Impact of drivers and challenges
          • Impact of drivers and challenges in 2023 and 2028
        • 10.4 Market opportunities/restraints

          11 Competitive Landscape

          • 11.1 Overview
            • 11.2 Competitive Landscape
              • Overview on criticality of inputs and factors of differentiation
            • 11.3 Landscape disruption
              • Overview on factors of disruption
            • 11.4 Industry risks
              • Impact of key risks on business

            12 Competitive Analysis

            • 12.1 Companies profiled
              • Companies covered
            • 12.2 Market positioning of companies
              • Matrix on companies position and classification
            • 12.3 American Hitech Petroleum and Chemicals Inc.
              • American Hitech Petroleum and Chemicals Inc. - Overview
              • American Hitech Petroleum and Chemicals Inc. - Product / Service
              • American Hitech Petroleum and Chemicals Inc. - Key offerings
            • 12.4 BASF SE
              • BASF SE - Overview
              • BASF SE - Business segments
              • BASF SE - Key news
              • BASF SE - Key offerings
              • BASF SE - Segment focus
            • 12.5 BPT Chemicals Co. Ltd.
              • BPT Chemicals Co. Ltd. - Overview
              • BPT Chemicals Co. Ltd. - Product / Service
              • BPT Chemicals Co. Ltd. - Key offerings
            • 12.6 Chevron Corp.
              • Chevron Corp. - Overview
              • Chevron Corp. - Business segments
              • Chevron Corp. - Key news
              • Chevron Corp. - Key offerings
              • Chevron Corp. - Segment focus
            • 12.7 Croda International Plc
              • Croda International Plc - Overview
              • Croda International Plc - Business segments
              • Croda International Plc - Key news
              • Croda International Plc - Key offerings
              • Croda International Plc - Segment focus
            • 12.8 Eni SpA
              • Eni SpA - Overview
              • Eni SpA - Business segments
              • Eni SpA - Key news
              • Eni SpA - Key offerings
              • Eni SpA - Segment focus
            • 12.9 Evonik Industries AG
              • Evonik Industries AG - Overview
              • Evonik Industries AG - Business segments
              • Evonik Industries AG - Key news
              • Evonik Industries AG - Key offerings
              • Evonik Industries AG - Segment focus
            • 12.10 Jinzhou Kangtai Lubricant Additives Co. Ltd.
              • Jinzhou Kangtai Lubricant Additives Co. Ltd. - Overview
              • Jinzhou Kangtai Lubricant Additives Co. Ltd. - Product / Service
              • Jinzhou Kangtai Lubricant Additives Co. Ltd. - Key offerings
            • 12.11 Lanxess AG
              • Lanxess AG - Overview
              • Lanxess AG - Business segments
              • Lanxess AG - Key news
              • Lanxess AG - Key offerings
              • Lanxess AG - Segment focus
            • 12.12 Mitsui Chemicals Inc.
              • Mitsui Chemicals Inc. - Overview
              • Mitsui Chemicals Inc. - Business segments
              • Mitsui Chemicals Inc. - Key offerings
              • Mitsui Chemicals Inc. - Segment focus
            • 12.13 NewMarket Corp.
              • NewMarket Corp. - Overview
              • NewMarket Corp. - Business segments
              • NewMarket Corp. - Key offerings
              • NewMarket Corp. - Segment focus
            • 12.14 PETRONAS Chemicals Group Berhad
              • PETRONAS Chemicals Group Berhad - Overview
              • PETRONAS Chemicals Group Berhad - Business segments
              • PETRONAS Chemicals Group Berhad - Key news
              • PETRONAS Chemicals Group Berhad - Key offerings
              • PETRONAS Chemicals Group Berhad - Segment focus
            • 12.15 Sanyo Chemical Industries Ltd.
              • Sanyo Chemical Industries Ltd. - Overview
              • Sanyo Chemical Industries Ltd. - Business segments
              • Sanyo Chemical Industries Ltd. - Key offerings
              • Sanyo Chemical Industries Ltd. - Segment focus
            • 12.16 Shell plc
              • Shell plc - Overview
              • Shell plc - Business segments
              • Shell plc - Key news
              • Shell plc - Key offerings
              • Shell plc - Segment focus
            • 12.17 The Lubrizol Corp.
              • The Lubrizol Corp. - Overview
              • The Lubrizol Corp. - Product / Service
              • The Lubrizol Corp. - Key offerings

            13 Appendix

            • 13.1 Scope of the report
              • 13.2 Inclusions and exclusions checklist
                • Inclusions checklist
                • Exclusions checklist
              • 13.3 Currency conversion rates for US$
                • Currency conversion rates for US$
              • 13.4 Research methodology
                • Research methodology
              • 13.5 Data procurement
                • Information sources
              • 13.6 Data validation
                • Data validation
              • 13.7 Validation techniques employed for market sizing
                • Validation techniques employed for market sizing
              • 13.8 Data synthesis
                • Data synthesis
              • 13.9 360 degree market analysis
                • 360 degree market analysis
              • 13.10 List of abbreviations
                • List of abbreviations

              Research Methodology

              Technavio presents a detailed picture of the market by way of study, synthesis, and summation of data from multiple sources. The analysts have presented the various facets of the market with a particular focus on identifying the key industry influencers. The data thus presented is comprehensive, reliable, and the result of extensive research, both primary and secondary.

              INFORMATION SOURCES

              Primary sources

              • Manufacturers and suppliers
              • Channel partners
              • Industry experts
              • Strategic decision makers

              Secondary sources

              • Industry journals and periodicals
              • Government data
              • Financial reports of key industry players
              • Historical data
              • Press releases

              DATA ANALYSIS

              Data Synthesis

              • Collation of data
              • Estimation of key figures
              • Analysis of derived insights

              Data Validation

              • Triangulation with data models
              • Reference against proprietary databases
              • Corroboration with industry experts

              REPORT WRITING

              Qualitative

              • Market drivers
              • Market challenges
              • Market trends
              • Five forces analysis

              Quantitative

              • Market size and forecast
              • Market segmentation
              • Geographical insights
              • Competitive landscape

              Interested in this report?

              Get your sample now to see our research methodology and insights!

              Download Now

              Frequently Asked Questions

              Lubricant Viscosity Grade Improvers market growth will increase by $ 452.7 mn during 2024-2028 .

              The Lubricant Viscosity Grade Improvers market is expected to grow at a CAGR of 2.09% during 2024-2028 .

              Lubricant Viscosity Grade Improvers market is segmented by Application( Vehicle lubricants, Industrial lubricants) Product( Polymethacrylate (PMA), Hydrostyrene diene copolymer (HSD), Polyisobutylene (PIB) and others)

              American Hitech Petroleum and Chemicals Inc., Asian Oil Co., BASF SE, BPT Chemicals Co. Ltd., CHETAS BIOCHEM, Chevron Corp., Croda International Plc, Eni SpA, Evonik Industries AG, Goodway Chemicals Pvt. Ltd., Innov Oil Pte Ltd., Jinzhou Kangtai Lubricant Additives Co. Ltd., Lanxess AG, Mitsui Chemicals Inc., NewMarket Corp., PETRONAS Chemicals Group Berhad, Sanyo Chemical Industries Ltd., Shanghai Minglan Chemical Co. Ltd., Shell plc, The Lubrizol Corp. are a few of the key vendors in the Lubricant Viscosity Grade Improvers market.

              North America will register the highest growth rate of 33% among the other regions. Therefore, the Lubricant Viscosity Grade Improvers market in North America is expected to garner significant business opportunities for the vendors during the forecast period.

              China, US, Japan, Germany, India

              • Increasing demand from end-user industriesAlthough the automotive industry is the key consumer of lubricants is the driving factor this market.
              • the global lubricant viscosity grade improvers market is also driven by the construction is the driving factor this market.
              • steel and cement is the driving factor this market.
              • mining and oil drilling is the driving factor this market.
              • and marine industries. Construction industryIn the construction industry is the driving factor this market.
              • lubricants are used in construction equipment owing to their anti-wear characteristics is the driving factor this market.
              • resistance to corrosion is the driving factor this market.
              • excellent lubricity is the driving factor this market.
              • water tolerance is the driving factor this market.
              • and filterability. Lubricants are used in earthmoving equipment such as crawler excavators is the driving factor this market.
              • mini excavators is the driving factor this market.
              • wheeled excavators is the driving factor this market.
              • wheeled dozers is the driving factor this market.
              • and skid-steer loaders because of their excellent energy transmission capacity. Steel and cement industry In the steel and cement industry is the driving factor this market.
              • lubricants are used to increase drain/re-greasing intervals of the equipment is the driving factor this market.
              • lubrication efficiency is the driving factor this market.
              • wear resistance of friction pairs is the driving factor this market.
              • and enhance the lifespan of the equipment. Lubricants are used as hydraulic fluids is the driving factor this market.
              • compressor oils is the driving factor this market.
              • metalworking fluids is the driving factor this market.
              • fire-resistant hydraulic fluids is the driving factor this market.
              • and high-temperature greases in the steel industry for various applications. Equipment such as blast furnaces is the driving factor this market.
              • continuous castings is the driving factor this market.
              • hot/cold rolling mills is the driving factor this market.
              • bearings is the driving factor this market.
              • pulleys is the driving factor this market.
              • cranes is the driving factor this market.
              • lifts is the driving factor this market.
              • and engines require lubricants to reduce downtime and increase operational efficiency. Mining and oil drillingIn the mining and oil drilling industry is the driving factor this market.
              • lubricants are used in diesel engine oils is the driving factor this market.
              • air compressor oils is the driving factor this market.
              • gear and axle lubricants is the driving factor this market.
              • transmission fluids is the driving factor this market.
              • and gear and circulating oils. Thus is the driving factor this market.
              • the growth of the above-mentioned industries is expected to boost the growth of the lubricant viscosity grade improvers market during the forecast period. is the driving factor this market.

              The Lubricant Viscosity Grade Improvers market vendors should focus on grabbing business opportunities from the Vehicle lubricants segment as it accounted for the largest market share in the base year.