Machine Customers Market Analysis, Size, and Forecast 2026-2030: North America (US, Canada, and Mexico), APAC (China, India, and Japan), Europe (Germany, UK, and France), South America (Brazil and Argentina), Middle East and Africa (Saudi Arabia, UAE, and South Africa), and Rest of World (ROW)

Machine Customers Market Analysis, Size, and Forecast 2026-2030:
North America (US, Canada, and Mexico), APAC (China, India, and Japan), Europe (Germany, UK, and France), South America (Brazil and Argentina), Middle East and Africa (Saudi Arabia, UAE, and South Africa), and Rest of World (ROW)

Published: May 2026 315 Pages SKU: IRTNTR81474

Market Overview at a Glance

$1.52 B
Market Opportunity
9.4%
CAGR 2025 - 2030
33.8%
North America Growth
$757 Mn
Consumer devices segment 2024

Machine Customers Market Size 2026-2030

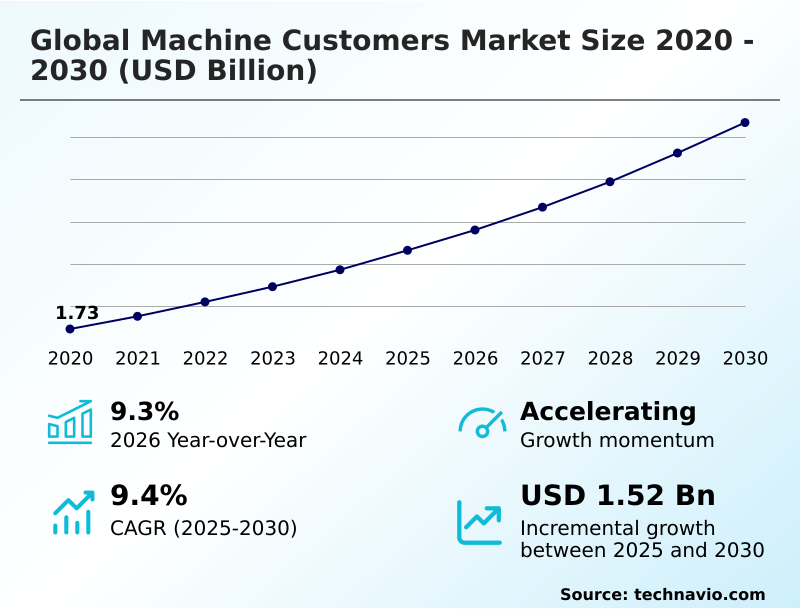
The machine customers market size is valued to increase by USD 1.52 billion, at a CAGR of 9.4% from 2025 to 2030. Expansion of internet of things and edge computing architecture will drive the machine customers market.

Major Market Trends & Insights

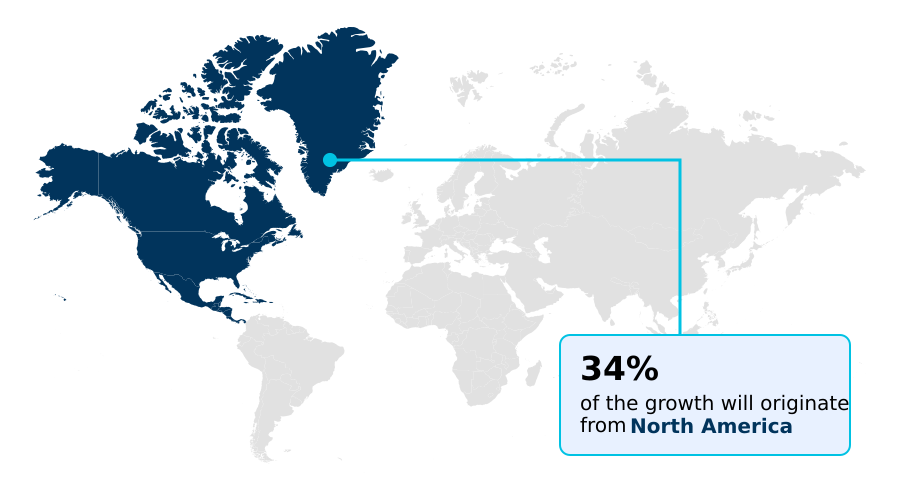
  • North America dominated the market and accounted for a 33.8% growth during the forecast period.
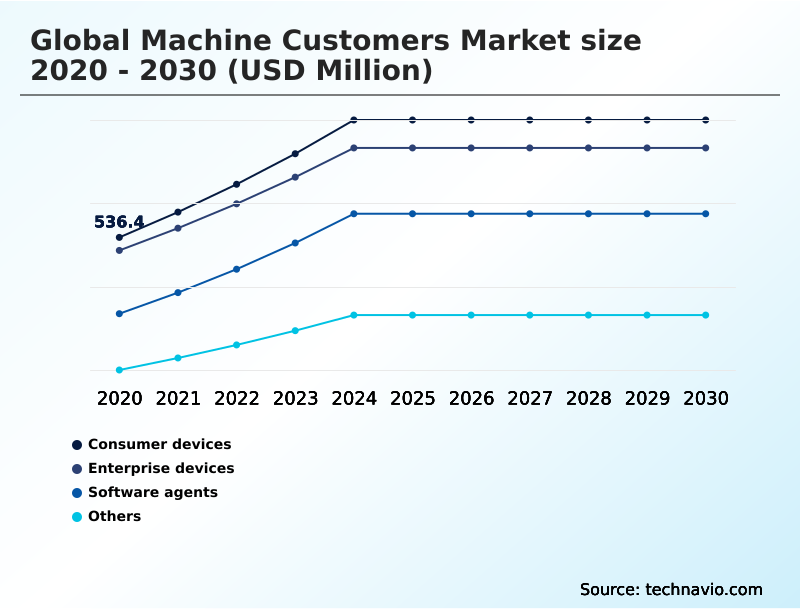
  • By Type - Consumer devices segment was valued at USD 757 million in 2024
  • By Technology - IoT and sensors segment accounted for the largest market revenue share in 2024

Market Size & Forecast

  • Market Opportunities: USD 2.44 billion
  • Market Future Opportunities: USD 1.52 billion
  • CAGR from 2025 to 2030 : 9.4%

Market Summary

  • The machine customers market signifies a fundamental commercial shift where non-human entities, powered by AI, autonomously execute economic transactions. These custobots leverage data-driven insights and predefined parameters, moving beyond passive roles to become active participants in commerce.
  • This paradigm, built on advanced sensors, machine learning, and secure payment gateways, is altering traditional B2C and B2B models by prioritizing efficiency and data accuracy over conventional marketing.
  • For instance, in a manufacturing setting, a smart factory's AI can monitor equipment wear, predict a potential failure, and autonomously order a replacement part from a pre-approved supplier, scheduling delivery to align with maintenance cycles. This scenario minimizes downtime and manual intervention.
  • As digital assistants and autonomous systems mature, the capacity of machines to act as independent buyers will increasingly define global trade, demanding a redesign of sales strategies and digital infrastructure to serve these algorithmic buyers.

What will be the Size of the Machine Customers Market during the forecast period?

Get Key Insights on Market Forecast (PDF) Get Free Sample

How is the Machine Customers Market Segmented?

The machine customers industry research report provides comprehensive data (region-wise segment analysis), with forecasts and estimates in "USD million" for the period 2026-2030, as well as historical data from 2020-2024 for the following segments.

  • Type
    • Consumer devices
    • Enterprise devices
    • Software agents
    • Others
  • Technology
    • IoT and sensors
    • AI and ML
    • NLP
    • Others
  • End-user
    • IFSI
    • Retail and e-commerce
    • Telecommunications and IT
    • Others
  • Geography
    • North America
      • US
      • Canada
      • Mexico
    • APAC
      • China
      • India
      • Japan
    • Europe
      • Germany
      • UK
      • France
    • South America
      • Brazil
      • Argentina
    • Middle East and Africa
      • Saudi Arabia
      • UAE
      • South Africa
    • Rest of World (ROW)

By Type Insights

The consumer devices segment is estimated to witness significant growth during the forecast period.

The consumer devices segment is shifting toward proactive economic agency, where personal technology executes transactions autonomously. This landscape includes smart appliances and wearables utilizing artificial intelligence for automated replenishment and resource management based on utility-based decision logic.

The primary appeal is convenience, with predictive maintenance algorithms and autonomous negotiation strategies minimizing user effort. The integration of a digital wallet for things and secure machine identity enables this data-driven operation, allowing for real-time responsiveness to consumption patterns.

This delegated financial authority removes friction from inventory management, with some platforms enabling a 15% reduction in household waste through automated negotiation protocols and hyper-personalized decision logic. This is supported by a robust digital payment infrastructure and machine wallet authentication.

Get Free Sample

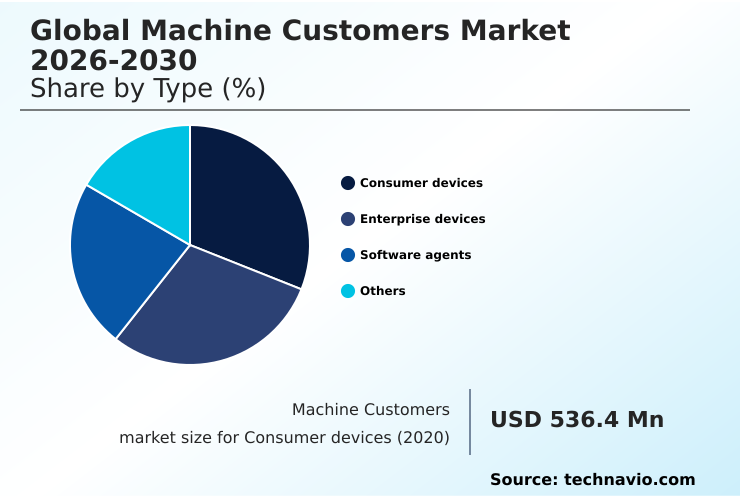
The Consumer devices segment was valued at USD 757 million in 2024 and showed a gradual increase during the forecast period.

Get Free Sample

Regional Analysis

North America is estimated to contribute 33.8% to the growth of the global market during the forecast period.Technavio’s analysts have elaborately explained the regional trends and drivers that shape the market during the forecast period.

See How Machine Customers Market Demand is Rising in North America Get Free Sample

The geographic landscape is led by North America, which accounts for over 33% of the market opportunity, driven by its concentration of AI and cloud providers.

The region's mature corporate ecosystem rapidly adopts autonomous sustainable procurement and workflow automation platforms, with deployments in logistics showing a 40% reduction in contract negotiation times.

Meanwhile, the APAC region is the fastest-growing, supported by massive investments in the industrial internet of things and smart city infrastructure that leverage AI computing platforms.

Europe focuses on creating a unified digital market, emphasizing environmental, social, and governance standards and certified carbon-neutral manufacturing.

This is advanced by standardized edge-processing architecture and the development of a cross-platform machine customer interface, supported by a digital currency bridge and open-source procurement framework.

Market Dynamics

Our researchers analyzed the data with 2025 as the base year, along with the key drivers, trends, and challenges. A holistic analysis of drivers will help companies refine their marketing strategies to gain a competitive advantage.

  • The evolution of the machine customers market hinges on the successful implementation of autonomous procurement for industrial supply chains. This requires establishing legal frameworks for autonomous economic agents to manage the complexities of managing legal liability in algorithmic decision-making.
  • A key component is the use of AI agents for complex multi-company comparisons, which allows for greater efficiency but also raises the need for robust cybersecurity for automated transactional chains. As global commerce becomes more automated, standardizing machine identity for cross-border trade is paramount, necessitating the creation of interoperable machine customer interfaces.
  • The challenge intensifies with concerns over data privacy in machine commerce and the rise of adversarial machine learning threats in procurement. The role of NLP in machine customer interactions is crucial for bridging the gap with human-centric systems. Concurrently, developing open-source frameworks for machine customers can foster innovation and prevent vendor lock-in.
  • To enable these interactions, securing digital wallets for IoT devices and using blockchain for transparent machine transactions are foundational. This paves the way for programmable finance for secure machine-to-machine payments. Integrating ESG standards in automated procurement is also becoming a core requirement, moving beyond mere efficiency.
  • These advancements enable real-time price negotiation by AI agents and facilitate autonomous replenishment in smart home ecosystems, all underpinned by the critical task of delegating financial authority to software agents and regulating autonomous agents in global commerce. In this landscape, systems with embedded regulatory compliance show adoption rates 50% higher than those without.

What are the key market drivers leading to the rise in the adoption of Machine Customers Industry?

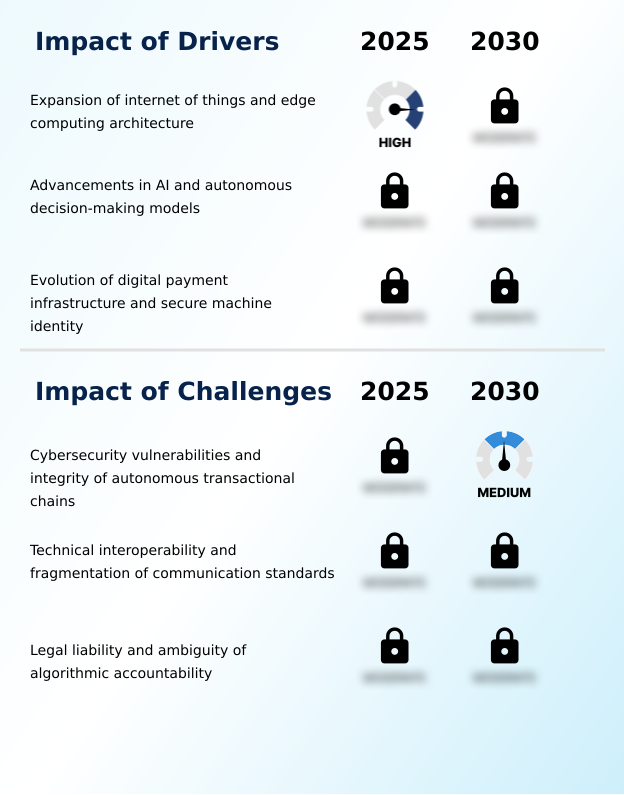
  • The expansion of the Internet of Things and edge computing architectures is a key driver for market growth.

  • Market growth is significantly driven by the expansion of edge computing architecture, which enables autonomous decision-making models to operate with low latency.
  • This is supported by a new generation of machine-to-machine payment protocols and automated industrial payments built on distributed ledger technology, which reduces transaction settlement times by over 50%.
  • The establishment of legal and technical standards, including decentralized identifiers and cryptographic certificates, is crucial for secure machine-led economic activity. These standards are being debated in legislative assemblies for economic agents.
  • The push for technical interoperability is encouraging the adoption of multi-model AI strategies, while advancements in autonomous software agents allow them to navigate complex digital environments, overcoming previous barriers related to algorithmic accountability and the legal personhood of autonomous agents.

What are the market trends shaping the Machine Customers Industry?

  • The market is witnessing a significant transition toward hyper-personalization. This shift is characterized by an evolution toward utility-based decision logic for autonomous agents.

  • Key trends are reshaping commerce as utility-based decision logic and sustainable procurement metrics become central to autonomous purchasing. This shift relies on robust machine identity frameworks and the adoption of programmable finance, enabling real-time price parity and smart contract execution.
  • Using generative and predictive models, agents can perform complex multi-company comparisons, achieving procurement efficiencies up to 22% greater than manual methods. The rise of decentralized agent management and autonomous fleet procurement is accelerating this transition. As part of this, the sovereign identity protocol and the issuance of cryptographic machine certificates are critical for building trust.
  • Furthermore, the integration of ethical compliance modules into procurement logic is becoming standard, with some systems improving adherence to ESG goals by 35%.

What challenges does the Machine Customers Industry face during its growth?

  • Addressing cybersecurity vulnerabilities and ensuring the integrity of autonomous transactional chains are key challenges affecting industry growth.

  • Significant challenges hinder market adoption, primarily stemming from cybersecurity threats targeting autonomous procurement systems. The proliferation of adversarial machine learning and specialized malware exploits that target automated bidding logic creates substantial risk for autonomous transactional chains. Systems without robust defenses have shown vulnerability, with unauthorized transactions increasing by 60% in simulated attacks. This necessitates a stronger digital payment infrastructure.
  • Furthermore, the legal and regulatory landscape remains ambiguous, with ongoing debates in legislative assemblies for economic agents concerning algorithmic accountability and the legal personhood of autonomous agents. The lack of technical interoperability, exacerbated by unresolved data privacy conflicts, fragments the market and makes the scaling of autonomous software agents and algorithmic economic agents difficult.

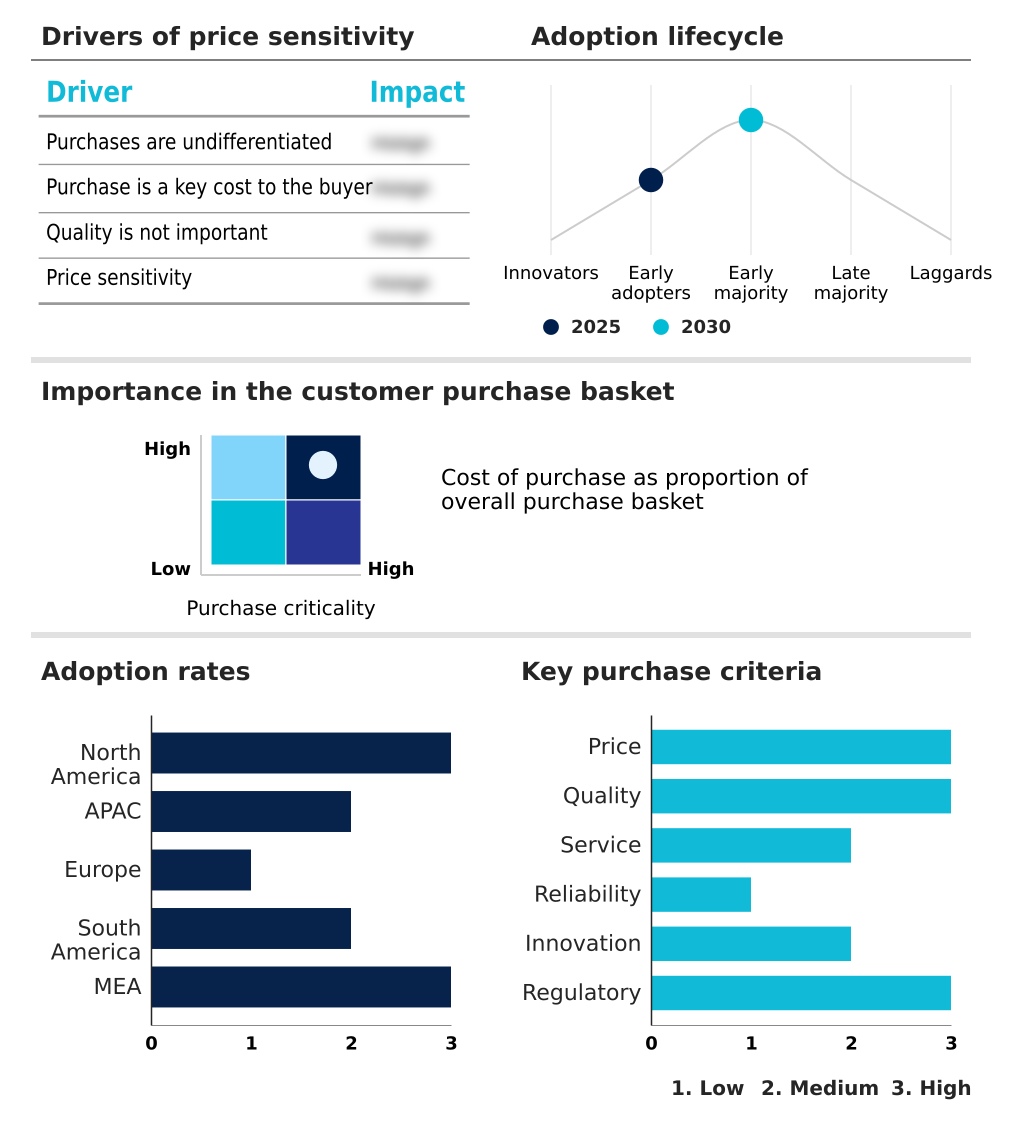
Exclusive Technavio Analysis on Customer Landscape

The machine customers market forecasting report includes the adoption lifecycle of the market, covering from the innovator’s stage to the laggard’s stage. It focuses on adoption rates in different regions based on penetration. Furthermore, the machine customers market report also includes key purchase criteria and drivers of price sensitivity to help companies evaluate and develop their market growth analysis strategies.

Customer Landscape of Machine Customers Industry

Competitive Landscape

Companies are implementing various strategies, such as strategic alliances, machine customers market forecast, partnerships, mergers and acquisitions, geographical expansion, and product/service launches, to enhance their presence in the industry.

Ada Support Inc. - Delivers AI-powered customer service automation through conversational platforms, enabling machine-driven brand interactions.

The industry research and growth report includes detailed analyses of the competitive landscape of the market and information about key companies, including:

  • Ada Support Inc.
  • Amazon Web Services Inc.
  • Gartner Inc.
  • Google LLC
  • Hewlett Packard Enterprise Co.
  • Honeywell International Inc.
  • IBM Corp.
  • Intel Corp.
  • Microsoft Corp.
  • NVIDIA Corp.
  • Oracle Corp.
  • PTC Inc.
  • Robert Bosch GmbH
  • Rockwell Automation Inc.
  • Salesforce Inc.
  • Samsung Electronics Co. Ltd.
  • SAP SE
  • ServiceNow Inc.
  • Siemens AG
  • Tesla Inc.

Qualitative and quantitative analysis of companies has been conducted to help clients understand the wider business environment as well as the strengths and weaknesses of key industry players. Data is qualitatively analyzed to categorize companies as pure play, category-focused, industry-focused, and diversified; it is quantitatively analyzed to categorize companies as dominant, leading, strong, tentative, and weak.

Recent Development and News in Machine customers market

  • In August 2025, a significant technology alliance for open standards officially postponed the release of its proposed cross-platform machine customer interface, citing unresolved data privacy conflicts between member nations.
  • In November 2025, a prominent international standards organization finalized a new framework for cryptographic machine certificates to ensure the authenticity of autonomous purchasing agents in cross-border trade.
  • In April 2025, a global consortium of hardware manufacturers introduced a new standardized edge-processing architecture designed to facilitate autonomous micro-transactions between industrial sensors and third-party logistics providers.
  • In May 2025, a major international financial services provider released a dedicated protocol for machine wallet authentication, enabling IoT devices to maintain sovereign digital identities for autonomous purchasing.

Dive into Technavio’s robust research methodology, blending expert interviews, extensive data synthesis, and validated models for unparalleled Machine Customers Market insights. See full methodology.

Market Scope
Page number 315
Base year 2025
Historic period 2020-2024
Forecast period 2026-2030
Growth momentum & CAGR Accelerate at a CAGR of 9.4%
Market growth 2026-2030 USD 1515.2 million
Market structure Fragmented
YoY growth 2025-2026(%) 9.3%
Key countries US, Canada, Mexico, China, India, Japan, South Korea, Australia, Singapore, Germany, UK, France, Italy, Spain, The Netherlands, Brazil, Argentina, Chile, Saudi Arabia, UAE, South Africa, Israel and Turkey
Competitive landscape Leading Companies, Market Positioning of Companies, Competitive Strategies, and Industry Risks

Request Free Sample

Research Analyst Overview

  • The machine customers market is defined by the rise of autonomous procurement systems and algorithmic economic agents that are fundamentally reshaping commerce. This evolution is built upon an edge computing architecture and sophisticated generative and predictive models that enable real-time responsiveness and data-driven operation.
  • Core to this shift is the establishment of machine identity frameworks, which use decentralized identifiers and cryptographic certificates to grant delegated financial authority to autonomous software agents. This is facilitated by a new digital payment infrastructure, including machine-to-machine payment protocols and digital wallets for things, often secured by distributed ledger technology.
  • The trend toward utility-based decision logic forces a boardroom-level pivot from brand-focused marketing to providing structured, machine-readable data. Predictive maintenance algorithms and automated replenishment systems now handle procurement, reducing manual processing times by over 30%.
  • These autonomous AI systems leverage intelligent automation platforms and workflow automation platforms, running on powerful AI computing platforms, to execute smart contracts, conduct multi-company comparisons, and employ autonomous negotiation strategies, all while navigating complex sustainable procurement metrics and automated green procurement standards via a cross-platform machine customer interface.

What are the Key Data Covered in this Machine Customers Market Research and Growth Report?

  • What is the expected growth of the Machine Customers Market between 2026 and 2030?

    • USD 1.52 billion, at a CAGR of 9.4%

  • What segmentation does the market report cover?

    • The report is segmented by Type (Consumer devices, Enterprise devices, Software agents, and Others), Technology (IoT and sensors, AI and ML, NLP, and Others), End-user (IFSI, Retail and e-commerce, Telecommunications and IT, and Others) and Geography (North America, APAC, Europe, South America, Middle East and Africa)

  • Which regions are analyzed in the report?

    • North America, APAC, Europe, South America and Middle East and Africa

  • What are the key growth drivers and market challenges?

    • Expansion of internet of things and edge computing architecture, Cybersecurity vulnerabilities and integrity of autonomous transactional chains

  • Who are the major players in the Machine Customers Market?

    • Ada Support Inc., Amazon Web Services Inc., Gartner Inc., Google LLC, Hewlett Packard Enterprise Co., Honeywell International Inc., IBM Corp., Intel Corp., Microsoft Corp., NVIDIA Corp., Oracle Corp., PTC Inc., Robert Bosch GmbH, Rockwell Automation Inc., Salesforce Inc., Samsung Electronics Co. Ltd., SAP SE, ServiceNow Inc., Siemens AG and Tesla Inc.

Market Research Insights

  • The market's dynamics are shaped by a move toward autonomous decision-making models, where machines handle procurement without human intervention, improving efficiency by over 20%. This requires a robust digital payment infrastructure and frameworks for secure machine identity to facilitate transactions.
  • The adoption of utility-based decision logic allows machines to prioritize objective metrics, which can increase cost savings by 15% compared to human-led purchasing. However, establishing clear algorithmic accountability and technical interoperability remains a challenge.
  • Efforts to create a cross-platform machine customer interface are underway to break down proprietary ecosystems, while new legal frameworks are being debated to address the legal personhood of autonomous agents and ensure trust in autonomous transactional chains.

We can help! Our analysts can customize this machine customers market research report to meet your requirements.

Get in touch

1. Executive Summary

1.1 Market overview

Executive Summary - Chart on Market Overview
Executive Summary - Data Table on Market Overview
Executive Summary - Chart on Global Market Characteristics
Executive Summary - Chart on Market by Geography
Executive Summary - Chart on Market Segmentation by Type
Executive Summary - Chart on Market Segmentation by Technology
Executive Summary - Chart on Market Segmentation by End-user
Executive Summary - Chart on Incremental Growth
Executive Summary - Data Table on Incremental Growth
Executive Summary - Chart on Company Market Positioning

2. Technavio Analysis

2.1 Analysis of price sensitivity, lifecycle, customer purchase basket, adoption rates, and purchase criteria

2.2 Criticality of inputs and Factors of differentiation

Chart on Overview on criticality of inputs and factors of differentiation

2.3 Factors of disruption

Chart on Overview on factors of disruption

2.4 Impact of drivers and challenges

Chart on Impact of drivers and challenges in 2025 and 2030

3. Market Landscape

3.1 Market ecosystem

Chart on Parent Market
Data Table on - Parent Market

3.2 Market characteristics

Chart on Market characteristics analysis

3.3 Value chain analysis

Chart on Value chain analysis

4. Market Sizing

4.1 Market definition

Data Table on Offerings of companies included in the market definition

4.2 Market segment analysis

Market segments

4.3 Market size 2025

4.4 Market outlook: Forecast for 2025-2030

Chart on Global - Market size and forecast 2025-2030 ($ million)
Data Table on Global - Market size and forecast 2025-2030 ($ million)
Chart on Global Market: Year-over-year growth 2025-2030 (%)
Data Table on Global Market: Year-over-year growth 2025-2030 (%)

5. Historic Market Size

5.1 Global Machine Customers Market 2020 - 2024

Historic Market Size - Data Table on Global Machine Customers Market 2020 - 2024 ($ million)

5.2 Type segment analysis 2020 - 2024

Historic Market Size - Type Segment 2020 - 2024 ($ million)

5.3 Technology segment analysis 2020 - 2024

Historic Market Size - Technology Segment 2020 - 2024 ($ million)

5.4 End-user segment analysis 2020 - 2024

Historic Market Size - End-user Segment 2020 - 2024 ($ million)

5.5 Geography segment analysis 2020 - 2024

Historic Market Size - Geography Segment 2020 - 2024 ($ million)

5.6 Country segment analysis 2020 - 2024

Historic Market Size - Country Segment 2020 - 2024 ($ million)

6. Qualitative Analysis

6.1 Impact of AI on Global Machine Customers Market

6.2 Impact of geopolitical conflicts on Global Machine Customers Market

7. Five Forces Analysis

7.1 Five forces summary

Five forces analysis - Comparison between 2025 and 2030

7.2 Bargaining power of buyers

Bargaining power of buyers - Impact of key factors 2025 and 2030

7.3 Bargaining power of suppliers

Bargaining power of suppliers - Impact of key factors in 2025 and 2030

7.4 Threat of new entrants

Threat of new entrants - Impact of key factors in 2025 and 2030

7.5 Threat of substitutes

Threat of substitutes - Impact of key factors in 2025 and 2030

7.6 Threat of rivalry

Threat of rivalry - Impact of key factors in 2025 and 2030

7.7 Market condition

Chart on Market condition - Five forces 2025 and 2030

8. Market Segmentation by Type

8.1 Market segments

Chart on Type - Market share 2025-2030 (%)
Data Table on Type - Market share 2025-2030 (%)

8.2 Comparison by Type

Chart on Comparison by Type
Data Table on Comparison by Type

8.3 Consumer devices - Market size and forecast 2025-2030

Chart on Consumer devices - Market size and forecast 2025-2030 ($ million)
Data Table on Consumer devices - Market size and forecast 2025-2030 ($ million)
Chart on Consumer devices - Year-over-year growth 2025-2030 (%)
Data Table on Consumer devices - Year-over-year growth 2025-2030 (%)

8.4 Enterprise devices - Market size and forecast 2025-2030

Chart on Enterprise devices - Market size and forecast 2025-2030 ($ million)
Data Table on Enterprise devices - Market size and forecast 2025-2030 ($ million)
Chart on Enterprise devices - Year-over-year growth 2025-2030 (%)
Data Table on Enterprise devices - Year-over-year growth 2025-2030 (%)

8.5 Software agents - Market size and forecast 2025-2030

Chart on Software agents - Market size and forecast 2025-2030 ($ million)
Data Table on Software agents - Market size and forecast 2025-2030 ($ million)
Chart on Software agents - Year-over-year growth 2025-2030 (%)
Data Table on Software agents - Year-over-year growth 2025-2030 (%)

8.6 Others - Market size and forecast 2025-2030

Chart on Others - Market size and forecast 2025-2030 ($ million)
Data Table on Others - Market size and forecast 2025-2030 ($ million)
Chart on Others - Year-over-year growth 2025-2030 (%)
Data Table on Others - Year-over-year growth 2025-2030 (%)

8.7 Market opportunity by Type

Market opportunity by Type ($ million)
Data Table on Market opportunity by Type ($ million)

9. Market Segmentation by Technology

9.1 Market segments

Chart on Technology - Market share 2025-2030 (%)
Data Table on Technology - Market share 2025-2030 (%)

9.2 Comparison by Technology

Chart on Comparison by Technology
Data Table on Comparison by Technology

9.3 IoT and sensors - Market size and forecast 2025-2030

Chart on IoT and sensors - Market size and forecast 2025-2030 ($ million)
Data Table on IoT and sensors - Market size and forecast 2025-2030 ($ million)
Chart on IoT and sensors - Year-over-year growth 2025-2030 (%)
Data Table on IoT and sensors - Year-over-year growth 2025-2030 (%)

9.4 AI and ML - Market size and forecast 2025-2030

Chart on AI and ML - Market size and forecast 2025-2030 ($ million)
Data Table on AI and ML - Market size and forecast 2025-2030 ($ million)
Chart on AI and ML - Year-over-year growth 2025-2030 (%)
Data Table on AI and ML - Year-over-year growth 2025-2030 (%)

9.5 NLP - Market size and forecast 2025-2030

Chart on NLP - Market size and forecast 2025-2030 ($ million)
Data Table on NLP - Market size and forecast 2025-2030 ($ million)
Chart on NLP - Year-over-year growth 2025-2030 (%)
Data Table on NLP - Year-over-year growth 2025-2030 (%)

9.6 Others - Market size and forecast 2025-2030

Chart on Others - Market size and forecast 2025-2030 ($ million)
Data Table on Others - Market size and forecast 2025-2030 ($ million)
Chart on Others - Year-over-year growth 2025-2030 (%)
Data Table on Others - Year-over-year growth 2025-2030 (%)

9.7 Market opportunity by Technology

Market opportunity by Technology ($ million)
Data Table on Market opportunity by Technology ($ million)

10. Market Segmentation by End-user

10.1 Market segments

Chart on End-user - Market share 2025-2030 (%)
Data Table on End-user - Market share 2025-2030 (%)

10.2 Comparison by End-user

Chart on Comparison by End-user
Data Table on Comparison by End-user

10.3 IFSI - Market size and forecast 2025-2030

Chart on IFSI - Market size and forecast 2025-2030 ($ million)
Data Table on IFSI - Market size and forecast 2025-2030 ($ million)
Chart on IFSI - Year-over-year growth 2025-2030 (%)
Data Table on IFSI - Year-over-year growth 2025-2030 (%)

10.4 Retail and e-commerce - Market size and forecast 2025-2030

Chart on Retail and e-commerce - Market size and forecast 2025-2030 ($ million)
Data Table on Retail and e-commerce - Market size and forecast 2025-2030 ($ million)
Chart on Retail and e-commerce - Year-over-year growth 2025-2030 (%)
Data Table on Retail and e-commerce - Year-over-year growth 2025-2030 (%)

10.5 Telecommunications and IT - Market size and forecast 2025-2030

Chart on Telecommunications and IT - Market size and forecast 2025-2030 ($ million)
Data Table on Telecommunications and IT - Market size and forecast 2025-2030 ($ million)
Chart on Telecommunications and IT - Year-over-year growth 2025-2030 (%)
Data Table on Telecommunications and IT - Year-over-year growth 2025-2030 (%)

10.6 Others - Market size and forecast 2025-2030

Chart on Others - Market size and forecast 2025-2030 ($ million)
Data Table on Others - Market size and forecast 2025-2030 ($ million)
Chart on Others - Year-over-year growth 2025-2030 (%)
Data Table on Others - Year-over-year growth 2025-2030 (%)

10.7 Market opportunity by End-user

Market opportunity by End-user ($ million)
Data Table on Market opportunity by End-user ($ million)

11. Customer Landscape

11.1 Customer landscape overview

Analysis of price sensitivity, lifecycle, customer purchase basket, adoption rates, and purchase criteria

12. Geographic Landscape

12.1 Geographic segmentation

Chart on Market share by geography 2025-2030 (%)
Data Table on Market share by geography 2025-2030 (%)

12.2 Geographic comparison

Chart on Geographic comparison
Data Table on Geographic comparison

12.3 North America - Market size and forecast 2025-2030

Chart on North America - Market size and forecast 2025-2030 ($ million)
Data Table on North America - Market size and forecast 2025-2030 ($ million)
Chart on North America - Year-over-year growth 2025-2030 (%)
Data Table on North America - Year-over-year growth 2025-2030 (%)
Chart on Regional Comparison - North America
Data Table on Regional Comparison - North America

12.3.1 US - Market size and forecast 2025-2030

Chart on US - Market size and forecast 2025-2030 ($ million)
Data Table on US - Market size and forecast 2025-2030 ($ million)
Chart on US - Year-over-year growth 2025-2030 (%)
Data Table on US - Year-over-year growth 2025-2030 (%)

12.3.2 Canada - Market size and forecast 2025-2030

Chart on Canada - Market size and forecast 2025-2030 ($ million)
Data Table on Canada - Market size and forecast 2025-2030 ($ million)
Chart on Canada - Year-over-year growth 2025-2030 (%)
Data Table on Canada - Year-over-year growth 2025-2030 (%)

12.3.3 Mexico - Market size and forecast 2025-2030

Chart on Mexico - Market size and forecast 2025-2030 ($ million)
Data Table on Mexico - Market size and forecast 2025-2030 ($ million)
Chart on Mexico - Year-over-year growth 2025-2030 (%)
Data Table on Mexico - Year-over-year growth 2025-2030 (%)

12.4 APAC - Market size and forecast 2025-2030

Chart on APAC - Market size and forecast 2025-2030 ($ million)
Data Table on APAC - Market size and forecast 2025-2030 ($ million)
Chart on APAC - Year-over-year growth 2025-2030 (%)
Data Table on APAC - Year-over-year growth 2025-2030 (%)
Chart on Regional Comparison - APAC
Data Table on Regional Comparison - APAC

12.4.1 China - Market size and forecast 2025-2030

Chart on China - Market size and forecast 2025-2030 ($ million)
Data Table on China - Market size and forecast 2025-2030 ($ million)
Chart on China - Year-over-year growth 2025-2030 (%)
Data Table on China - Year-over-year growth 2025-2030 (%)

12.4.2 India - Market size and forecast 2025-2030

Chart on India - Market size and forecast 2025-2030 ($ million)
Data Table on India - Market size and forecast 2025-2030 ($ million)
Chart on India - Year-over-year growth 2025-2030 (%)
Data Table on India - Year-over-year growth 2025-2030 (%)

12.4.3 Japan - Market size and forecast 2025-2030

Chart on Japan - Market size and forecast 2025-2030 ($ million)
Data Table on Japan - Market size and forecast 2025-2030 ($ million)
Chart on Japan - Year-over-year growth 2025-2030 (%)
Data Table on Japan - Year-over-year growth 2025-2030 (%)

12.4.4 South Korea - Market size and forecast 2025-2030

Chart on South Korea - Market size and forecast 2025-2030 ($ million)
Data Table on South Korea - Market size and forecast 2025-2030 ($ million)
Chart on South Korea - Year-over-year growth 2025-2030 (%)
Data Table on South Korea - Year-over-year growth 2025-2030 (%)

12.4.5 Australia - Market size and forecast 2025-2030

Chart on Australia - Market size and forecast 2025-2030 ($ million)
Data Table on Australia - Market size and forecast 2025-2030 ($ million)
Chart on Australia - Year-over-year growth 2025-2030 (%)
Data Table on Australia - Year-over-year growth 2025-2030 (%)

12.4.6 Singapore - Market size and forecast 2025-2030

Chart on Singapore - Market size and forecast 2025-2030 ($ million)
Data Table on Singapore - Market size and forecast 2025-2030 ($ million)
Chart on Singapore - Year-over-year growth 2025-2030 (%)
Data Table on Singapore - Year-over-year growth 2025-2030 (%)

12.5 Europe - Market size and forecast 2025-2030

Chart on Europe - Market size and forecast 2025-2030 ($ million)
Data Table on Europe - Market size and forecast 2025-2030 ($ million)
Chart on Europe - Year-over-year growth 2025-2030 (%)
Data Table on Europe - Year-over-year growth 2025-2030 (%)
Chart on Regional Comparison - Europe
Data Table on Regional Comparison - Europe

12.5.1 Germany - Market size and forecast 2025-2030

Chart on Germany - Market size and forecast 2025-2030 ($ million)
Data Table on Germany - Market size and forecast 2025-2030 ($ million)
Chart on Germany - Year-over-year growth 2025-2030 (%)
Data Table on Germany - Year-over-year growth 2025-2030 (%)

12.5.2 UK - Market size and forecast 2025-2030

Chart on UK - Market size and forecast 2025-2030 ($ million)
Data Table on UK - Market size and forecast 2025-2030 ($ million)
Chart on UK - Year-over-year growth 2025-2030 (%)
Data Table on UK - Year-over-year growth 2025-2030 (%)

12.5.3 France - Market size and forecast 2025-2030

Chart on France - Market size and forecast 2025-2030 ($ million)
Data Table on France - Market size and forecast 2025-2030 ($ million)
Chart on France - Year-over-year growth 2025-2030 (%)
Data Table on France - Year-over-year growth 2025-2030 (%)

12.5.4 Italy - Market size and forecast 2025-2030

Chart on Italy - Market size and forecast 2025-2030 ($ million)
Data Table on Italy - Market size and forecast 2025-2030 ($ million)
Chart on Italy - Year-over-year growth 2025-2030 (%)
Data Table on Italy - Year-over-year growth 2025-2030 (%)

12.5.5 Spain - Market size and forecast 2025-2030

Chart on Spain - Market size and forecast 2025-2030 ($ million)
Data Table on Spain - Market size and forecast 2025-2030 ($ million)
Chart on Spain - Year-over-year growth 2025-2030 (%)
Data Table on Spain - Year-over-year growth 2025-2030 (%)

12.5.6 The Netherlands - Market size and forecast 2025-2030

Chart on The Netherlands - Market size and forecast 2025-2030 ($ million)
Data Table on The Netherlands - Market size and forecast 2025-2030 ($ million)
Chart on The Netherlands - Year-over-year growth 2025-2030 (%)
Data Table on The Netherlands - Year-over-year growth 2025-2030 (%)

12.6 South America - Market size and forecast 2025-2030

Chart on South America - Market size and forecast 2025-2030 ($ million)
Data Table on South America - Market size and forecast 2025-2030 ($ million)
Chart on South America - Year-over-year growth 2025-2030 (%)
Data Table on South America - Year-over-year growth 2025-2030 (%)
Chart on Regional Comparison - South America
Data Table on Regional Comparison - South America

12.6.1 Brazil - Market size and forecast 2025-2030

Chart on Brazil - Market size and forecast 2025-2030 ($ million)
Data Table on Brazil - Market size and forecast 2025-2030 ($ million)
Chart on Brazil - Year-over-year growth 2025-2030 (%)
Data Table on Brazil - Year-over-year growth 2025-2030 (%)

12.6.2 Argentina - Market size and forecast 2025-2030

Chart on Argentina - Market size and forecast 2025-2030 ($ million)
Data Table on Argentina - Market size and forecast 2025-2030 ($ million)
Chart on Argentina - Year-over-year growth 2025-2030 (%)
Data Table on Argentina - Year-over-year growth 2025-2030 (%)

12.6.3 Chile - Market size and forecast 2025-2030

Chart on Chile - Market size and forecast 2025-2030 ($ million)
Data Table on Chile - Market size and forecast 2025-2030 ($ million)
Chart on Chile - Year-over-year growth 2025-2030 (%)
Data Table on Chile - Year-over-year growth 2025-2030 (%)

12.7 Middle East and Africa - Market size and forecast 2025-2030

Chart on Middle East and Africa - Market size and forecast 2025-2030 ($ million)
Data Table on Middle East and Africa - Market size and forecast 2025-2030 ($ million)
Chart on Middle East and Africa - Year-over-year growth 2025-2030 (%)
Data Table on Middle East and Africa - Year-over-year growth 2025-2030 (%)
Chart on Regional Comparison - Middle East and Africa
Data Table on Regional Comparison - Middle East and Africa

12.7.1 Saudi Arabia - Market size and forecast 2025-2030

Chart on Saudi Arabia - Market size and forecast 2025-2030 ($ million)
Data Table on Saudi Arabia - Market size and forecast 2025-2030 ($ million)
Chart on Saudi Arabia - Year-over-year growth 2025-2030 (%)
Data Table on Saudi Arabia - Year-over-year growth 2025-2030 (%)

12.7.2 UAE - Market size and forecast 2025-2030

Chart on UAE - Market size and forecast 2025-2030 ($ million)
Data Table on UAE - Market size and forecast 2025-2030 ($ million)
Chart on UAE - Year-over-year growth 2025-2030 (%)
Data Table on UAE - Year-over-year growth 2025-2030 (%)

12.7.3 South Africa - Market size and forecast 2025-2030

Chart on South Africa - Market size and forecast 2025-2030 ($ million)
Data Table on South Africa - Market size and forecast 2025-2030 ($ million)
Chart on South Africa - Year-over-year growth 2025-2030 (%)
Data Table on South Africa - Year-over-year growth 2025-2030 (%)

12.7.4 Israel - Market size and forecast 2025-2030

Chart on Israel - Market size and forecast 2025-2030 ($ million)
Data Table on Israel - Market size and forecast 2025-2030 ($ million)
Chart on Israel - Year-over-year growth 2025-2030 (%)
Data Table on Israel - Year-over-year growth 2025-2030 (%)

12.7.5 Turkey - Market size and forecast 2025-2030

Chart on Turkey - Market size and forecast 2025-2030 ($ million)
Data Table on Turkey - Market size and forecast 2025-2030 ($ million)
Chart on Turkey - Year-over-year growth 2025-2030 (%)
Data Table on Turkey - Year-over-year growth 2025-2030 (%)

12.8 Market opportunity by geography

Market opportunity by geography ($ million)
Data Tables on Market opportunity by geography ($ million)

13. Drivers, Challenges, and Opportunity

13.1 Market drivers

Expansion of internet of things and edge computing architecture
Advancements in AI and autonomous decision-making models
Evolution of digital payment infrastructure and secure machine identity

13.2 Market challenges

Cybersecurity vulnerabilities and integrity of autonomous transactional chains
Technical interoperability and fragmentation of communication standards
Legal liability and ambiguity of algorithmic accountability

13.3 Impact of drivers and challenges

Impact of drivers and challenges in 2025 and 2030

13.4 Market opportunities

Hyper-personalization and transition toward utility-based decision logic
Convergence of autonomous sustainable procurement and industrial internet of things
Standardization of programmable finance and machine identity frameworks

14. Competitive Landscape

14.1 Overview

14.2

Overview on criticality of inputs and factors of differentiation

14.3 Landscape disruption

Overview on factors of disruption

14.4 Industry risks

Impact of key risks on business

15. Competitive Analysis

15.1 Companies profiled

Companies covered

15.2 Company ranking index

15.3 Market positioning of companies

Matrix on companies position and classification

15.4 Ada Support Inc.

Ada Support Inc. - Overview
Ada Support Inc. - Product / Service
Ada Support Inc. - Key offerings
SWOT

15.5 Amazon Web Services Inc.

Amazon Web Services Inc. - Overview
Amazon Web Services Inc. - Product / Service
Amazon Web Services Inc. - Key offerings
SWOT

15.6 Gartner Inc.

Gartner Inc. - Overview
Gartner Inc. - Business segments
Gartner Inc. - Key offerings
Gartner Inc. - Segment focus
SWOT

15.7 Google LLC

Google LLC - Overview
Google LLC - Product / Service
Google LLC - Key offerings
SWOT

15.8 Honeywell International Inc.

Honeywell International Inc. - Overview
Honeywell International Inc. - Business segments
Honeywell International Inc. - Key news
Honeywell International Inc. - Key offerings
Honeywell International Inc. - Segment focus
SWOT

15.9 IBM Corp.

IBM Corp. - Overview
IBM Corp. - Business segments
IBM Corp. - Key news
IBM Corp. - Key offerings
IBM Corp. - Segment focus
SWOT

15.10 Microsoft Corp.

Microsoft Corp. - Overview
Microsoft Corp. - Business segments
Microsoft Corp. - Key news
Microsoft Corp. - Key offerings
Microsoft Corp. - Segment focus
SWOT

15.11 NVIDIA Corp.

NVIDIA Corp. - Overview
NVIDIA Corp. - Business segments
NVIDIA Corp. - Key news
NVIDIA Corp. - Key offerings
NVIDIA Corp. - Segment focus
SWOT

15.12 Oracle Corp.

Oracle Corp. - Overview
Oracle Corp. - Business segments
Oracle Corp. - Key news
Oracle Corp. - Key offerings
Oracle Corp. - Segment focus
SWOT

15.13 PTC Inc.

PTC Inc. - Overview
PTC Inc. - Business segments
PTC Inc. - Key offerings
PTC Inc. - Segment focus
SWOT

15.14 Robert Bosch GmbH

Robert Bosch GmbH - Overview
Robert Bosch GmbH - Product / Service
Robert Bosch GmbH - Key offerings
SWOT

15.15 Rockwell Automation Inc.

Rockwell Automation Inc. - Overview
Rockwell Automation Inc. - Business segments
Rockwell Automation Inc. - Key news
Rockwell Automation Inc. - Key offerings
Rockwell Automation Inc. - Segment focus
SWOT

15.16 Salesforce Inc.

Salesforce Inc. - Overview
Salesforce Inc. - Business segments
Salesforce Inc. - Key news
Salesforce Inc. - Key offerings
Salesforce Inc. - Segment focus
SWOT

15.17 SAP SE

SAP SE - Overview
SAP SE - Business segments
SAP SE - Key news
SAP SE - Key offerings
SAP SE - Segment focus
SWOT

15.18 ServiceNow Inc.

ServiceNow Inc. - Overview
ServiceNow Inc. - Product / Service
ServiceNow Inc. - Key news
ServiceNow Inc. - Key offerings
SWOT

16. Appendix

16.1 Scope of the report

Market definition
Objectives
Notes and caveats

16.2 Inclusions and exclusions checklist

Inclusions checklist
Exclusions checklist

16.3 Currency conversion rates for US$

16.4 Research methodology

16.5 Data procurement

Information sources

16.6 Data validation

16.7 Validation techniques employed for market sizing

16.8 Data synthesis

16.9 360 degree market analysis

16.10 List of abbreviations

Research Methodology

Technavio presents a detailed picture of the market by way of study, synthesis, and summation of data from multiple sources. The analysts have presented the various facets of the market with a particular focus on identifying the key industry influencers. The data thus presented is comprehensive, reliable, and the result of extensive research, both primary and secondary.

INFORMATION SOURCES

Primary sources

  • Manufacturers and suppliers
  • Channel partners
  • Industry experts
  • Strategic decision makers

Secondary sources

  • Industry journals and periodicals
  • Government data
  • Financial reports of key industry players
  • Historical data
  • Press releases

DATA ANALYSIS

Data Synthesis

  • Collation of data
  • Estimation of key figures
  • Analysis of derived insights

Data Validation

  • Triangulation with data models
  • Reference against proprietary databases
  • Corroboration with industry experts

REPORT WRITING

Qualitative

  • Market drivers
  • Market challenges
  • Market trends
  • Five forces analysis

Quantitative

  • Market size and forecast
  • Market segmentation
  • Geographical insights
  • Competitive landscape

Interested in this report?

Get your sample now to see our research methodology and insights!

Download Now

Frequently Asked Questions

Machine Customers market growth will increase by USD 1515.2 million during 2026-2030.

The Machine Customers market is expected to grow at a CAGR of 9.4% during 2026-2030.

Machine Customers market is segmented by Type (Consumer devices, Enterprise devices, Software agents, Others) Technology (IoT and sensors, AI and ML, NLP, Others) End-user (IFSI, Retail and e-commerce, Telecommunications and IT, Others)

Ada Support Inc., Amazon Web Services Inc., Gartner Inc., Google LLC, Hewlett Packard Enterprise Co., Honeywell International Inc., IBM Corp., Intel Corp., Microsoft Corp., NVIDIA Corp., Oracle Corp., PTC Inc., Robert Bosch GmbH, Rockwell Automation Inc., Salesforce Inc., Samsung Electronics Co. Ltd., SAP SE, ServiceNow Inc., Siemens AG, Tesla Inc. are a few of the key vendors in the Machine Customers market.

North America will register the highest growth rate of 33.8% among the other regions. Therefore, the Machine Customers market in North America is expected to garner significant business opportunities for the vendors during the forecast period.

US, Canada, Mexico, China, India, Japan, South Korea, Australia, Singapore, Germany, UK, France, Italy, Spain, The Netherlands, Brazil, Argentina, Chile, Saudi Arabia, UAE, South Africa, Israel, Turkey

  • Expansion of internet of things and edge computing architecture is the driving factor this market.

The Machine Customers market vendors should focus on grabbing business opportunities from the Type segment as it accounted for the largest market share in the base year.
RIA - Research AI Assistant
Ask RIA