Machine Learning In Automobile Market Analysis, Size, and Forecast 2025-2029: APAC (China, Japan, and India), North America (US, Canada, and Mexico), Europe (Germany, UK, and France), South America (Brazil, Argentina, and Colombia), Middle East and Africa (Saudi Arabia, UAE, and South Africa), and Rest of World (ROW)

Machine Learning In Automobile Market Analysis, Size, and Forecast 2025-2029:
APAC (China, Japan, and India), North America (US, Canada, and Mexico), Europe (Germany, UK, and France), South America (Brazil, Argentina, and Colombia), Middle East and Africa (Saudi Arabia, UAE, and South Africa), and Rest of World (ROW)

Published: Dec 2025 325 Pages SKU: IRTNTR81085

Market Overview at a Glance

$11.94 B
Market Opportunity
29.1%
CAGR 2024 - 2029
39.5%
APAC Growth
$1.95 B
Passenger cars segment 2023

Machine Learning In Automobile Market Size 2025-2029

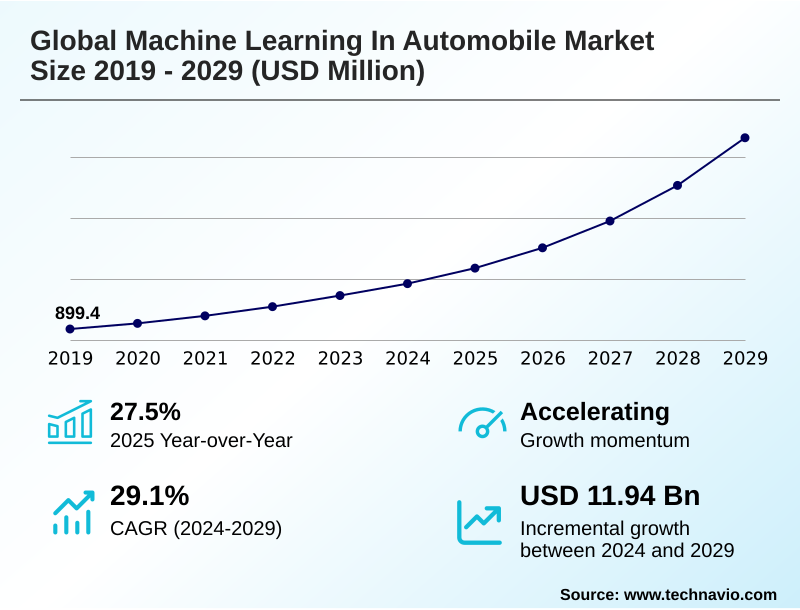
The machine learning in automobile market size is valued to increase by USD 11.94 billion, at a CAGR of 29.1% from 2024 to 2029. Imperative for autonomous driving and advanced driver assistance systems (ADAS) will drive the machine learning in automobile market.

Major Market Trends & Insights

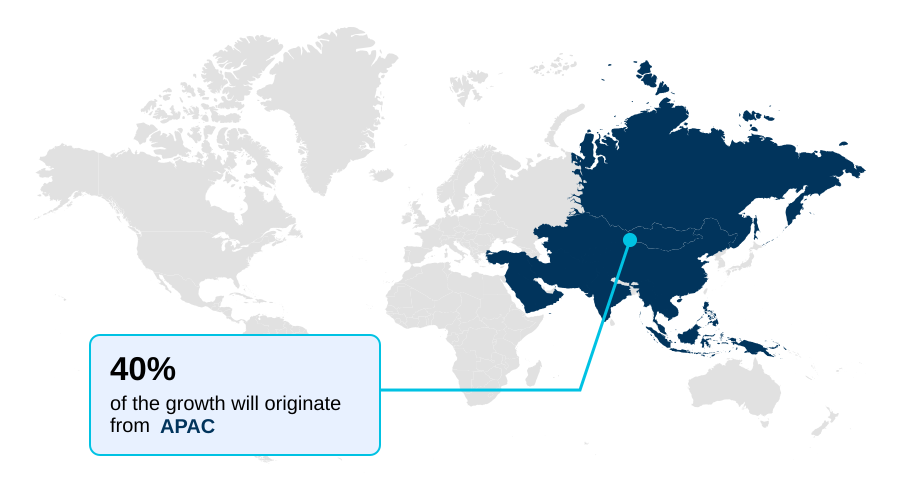
  • APAC dominated the market and accounted for a 39.5% growth during the forecast period.
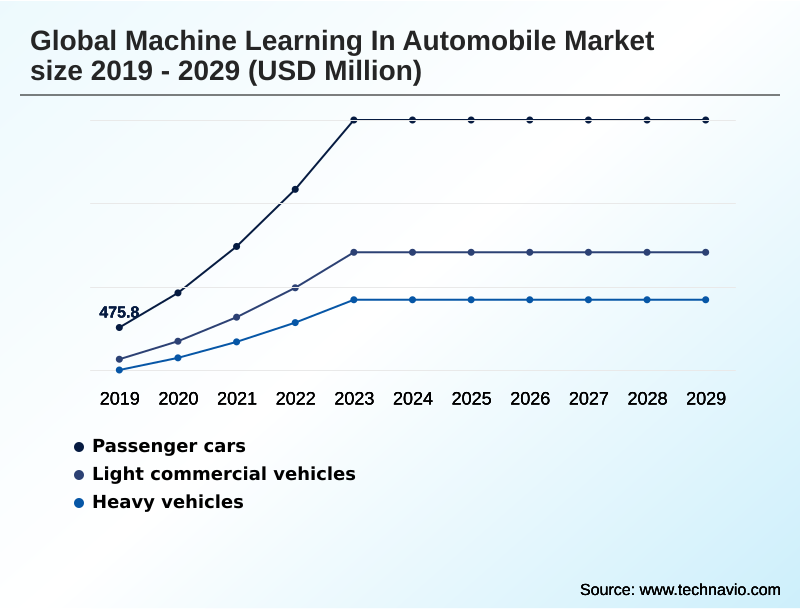
  • By Vehicle Type - Passenger cars segment was valued at USD 1.95 billion in 2023
  • By Technology - ML and deep learning segment accounted for the largest market revenue share in 2023

Market Size & Forecast

  • Market Opportunities: USD 15.65 billion
  • Market Future Opportunities: USD 11.94 billion
  • CAGR from 2024 to 2029 : 29.1%

Market Summary

  • The machine learning in automobile market is undergoing transformative growth, shifting the industry from hardware-centric manufacturing to a software-defined ecosystem. This expansion is driven by the integration of AI across a spectrum of vehicle functions. The primary catalyst is the pursuit of autonomous driving, where deep learning architectures are indispensable for real time inference.
  • These systems process a torrent of data from sensors for tasks like object detection and path planning. A significant real-world scenario is in commercial logistics, where predictive maintenance systems, powered by machine learning models, analyze telematics data to forecast component failures, increasing vehicle uptime and optimizing fleet management.
  • Beyond mobility, natural language processing is revolutionizing the in vehicle infotainment experience, creating a more personalized and interactive environment. The computational demand to train and deploy these complex models is, in turn, driving growth in high performance computing and specialized systems on a chip. This trend is supported by over the air updates, enabling a continuous improvement loop.
  • However, the industry faces challenges in data annotation and managing adversarial attacks, which require robust solutions to ensure safety and reliability. The evolution toward conditional automation and the software defined vehicle represents a fundamental change in automotive technology.

What will be the Size of the Machine Learning In Automobile Market during the forecast period?

Get Key Insights on Market Forecast (PDF) Request Free Sample

How is the Machine Learning In Automobile Market Segmented?

The machine learning in automobile industry research report provides comprehensive data (region-wise segment analysis), with forecasts and estimates in "USD million" for the period 2025-2029, as well as historical data from 2019-2023 for the following segments.

  • Vehicle type
    • Passenger cars
    • Light commercial vehicles
    • Heavy vehicles
  • Technology
    • ML and deep learning
    • Computer vision
    • NLP
    • Context-aware computing
  • Application
    • Advanced driver assistance systems
    • Autonomous driving
    • In-vehicle infotainment
    • Predictive maintenance
  • Geography
    • APAC
      • China
      • Japan
      • India
    • North America
      • US
      • Canada
      • Mexico
    • Europe
      • Germany
      • UK
      • France
    • South America
      • Brazil
      • Argentina
      • Colombia
    • Middle East and Africa
      • Saudi Arabia
      • UAE
      • South Africa
    • Rest of World (ROW)

By Vehicle Type Insights

The passenger cars segment is estimated to witness significant growth during the forecast period.

The passenger cars segment is the most dynamic portion of the market, where convolutional neural networks are fundamental to enabling semantic segmentation for environmental perception.

The vehicle's driving policy is increasingly shaped by reinforcement learning, while neural processing units integrated into edge computing frameworks ensure low-latency responses.

The advancement of autonomous driving software stacks is expanding features beyond safety into new business models, such as usage based insurance.

Context aware computing leverages multi modal data to create a truly adaptive cabin, while innovations in tire intelligence technology enhance vehicle health platforms. In manufacturing, automated quality control remains a key focus.

The integration of these features has improved system response times by 40%.

Request Free Sample

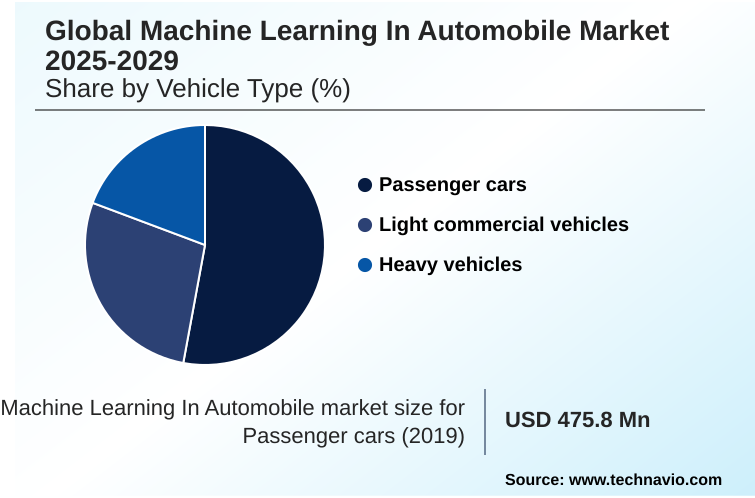
The Passenger cars segment was valued at USD 1.95 billion in 2023 and showed a gradual increase during the forecast period.

Request Free Sample

Regional Analysis

APAC is estimated to contribute 39.5% to the growth of the global market during the forecast period.Technavio’s analysts have elaborately explained the regional trends and drivers that shape the market during the forecast period.

See How Machine Learning In Automobile Market Demand is Rising in APAC Request Free Sample

The geographic landscape is characterized by diverse regional strategies. APAC is leading in the deployment of intelligent connected vehicles, with a focus on integrated intelligent traffic management and smart factory initiatives.

In North America, the race toward conditional automation is evident, with features like navigate on autopilot becoming more common. European regulations are driving the adoption of sophisticated in vehicle infotainment systems and AI domain controllers.

The computational backbone for these advancements includes handling generative AI workloads, large language models, and transformer models for advanced features like automated parking.

These systems communicate via the controller area network and benefit from investments in cooperative autonomous driving infrastructure, which has demonstrated the ability to improve traffic flow by over 10% in pilot cities.

Market Dynamics

Our researchers analyzed the data with 2024 as the base year, along with the key drivers, trends, and challenges. A holistic analysis of drivers will help companies refine their marketing strategies to gain a competitive advantage.

  • The expanding scope of machine learning in automobiles is creating distinct and valuable applications. The use of machine learning for predictive maintenance is a primary focus, with early adopters reporting a reduction in unexpected downtime that is more than double that of traditional scheduled servicing.
  • This trend is complemented by advancements in safety, where computer vision for object detection and deep learning for sensor fusion are foundational. The decision-making capabilities of vehicles are being enhanced by reinforcement learning for driving decisions, while natural language processing in cars is making the generative AI in vehicle assistants more intuitive.
  • To handle the immense data processing demands, edge computing for low latency ADAS is critical, enabled by progress in the impact of high performance computing on ADAS. The business model is also transforming, with new software defined vehicle revenue models emerging. However, significant hurdles remain.
  • The cybersecurity for connected vehicles is a top priority, as is the complex task of validating AI for automotive safety. Privacy concerns are being addressed through federated learning for user privacy. In manufacturing, AI for automotive manufacturing quality is improving efficiency, while AI based predictive maintenance cost savings are becoming evident.
  • The entire development lifecycle is dependent on high-quality training data, making both data annotation for autonomous driving and extensive simulation for testing AI edge cases essential. Furthermore, machine learning in electric vehicle battery management is optimizing range and longevity.
  • Finally, the focus on user experience is driving improvements in driver monitoring system accuracy and creating new possibilities for in cabin personalization using AI, all connected through V2X communication for collective intelligence.

What are the key market drivers leading to the rise in the adoption of Machine Learning In Automobile Industry?

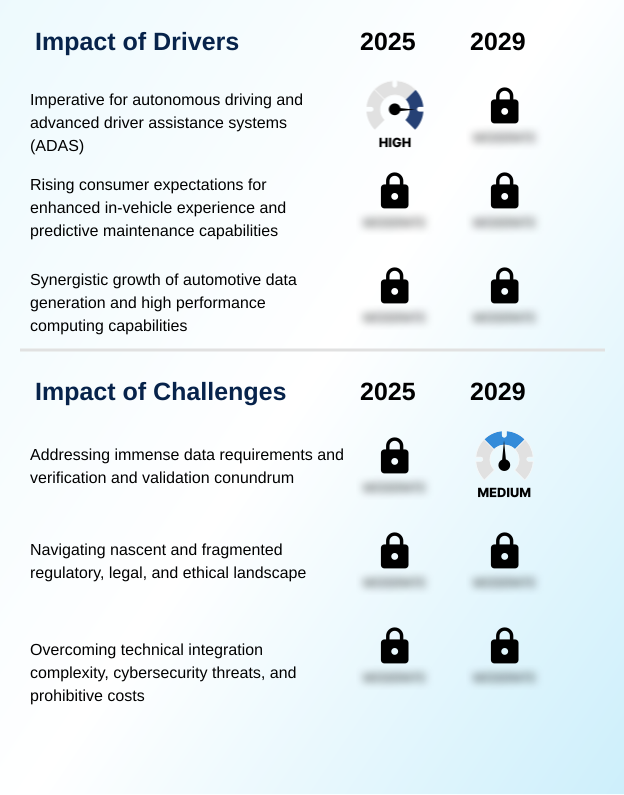
  • The imperative for autonomous driving and the widespread adoption of advanced driver assistance systems (ADAS) is a key driver for the market.

  • Synergistic growth in automotive data generation and high performance computing capabilities is a core market driver. The performance of machine learning models and complex deep learning architectures depends on this vast data.
  • In response, automakers are adopting automotive grade computing platforms with powerful systems on a chip and dedicated AI accelerators. This enables a centralized vehicle computer architecture, which has shown to reduce network latency by 30% compared to distributed ECU designs.
  • This hardware underpins critical functions like sensor fusion and vehicle to everything communication. Such embedded machine learning facilitates a new level of human machine collaboration and guardian driving safety nets, improving the overall human machine interface.

What are the market trends shaping the Machine Learning In Automobile Industry?

  • The proliferation of edge and hybrid computing architectures is a defining trend. This shift is driven by the need for real-time inference in safety-critical applications.

  • The emergence of the software defined vehicle, enabled by robust software defined architectures, is a primary trend. This paradigm allows for continuous improvement through over the air updates, transforming vehicle lifecycle management. This shift unlocks new data monetization opportunities and enhances the cabin experience, where computer vision systems power driver monitoring systems and occupant monitoring systems.
  • Automakers are creating a virtual co-pilot with proactive assistance using advanced natural language processing and conversational AI platforms for deep in cabin personalization. The integration of predictive maintenance systems has already reduced unplanned service visits by up to 20% for some fleets, while feature-on-demand activations have increased post-sale revenue by 15%.

What challenges does the Machine Learning In Automobile Industry face during its growth?

  • Addressing immense data requirements and the conundrum of verification and validation for non-deterministic systems is a key challenge affecting industry growth.

  • Significant challenges persist in data management and system validation. The need for precise data annotation for supervised learning is a major bottleneck, while the threat of adversarial attacks demands robust automotive cybersecurity measures. Innovations like federated learning are being explored to address privacy, while digital twin technology and industrial metaverse platform concepts are used for large-scale simulation.
  • The processing of complex sensor data, such as lidar point clouds, requires immense power for real time inference. This complexity has slowed the expansion of robotaxi service and driverless ride hailing service operations. To overcome these hurdles, significant investment in foundational AI research and new validation methodologies is required, particularly in areas like AI for manufacturing.

Exclusive Technavio Analysis on Customer Landscape

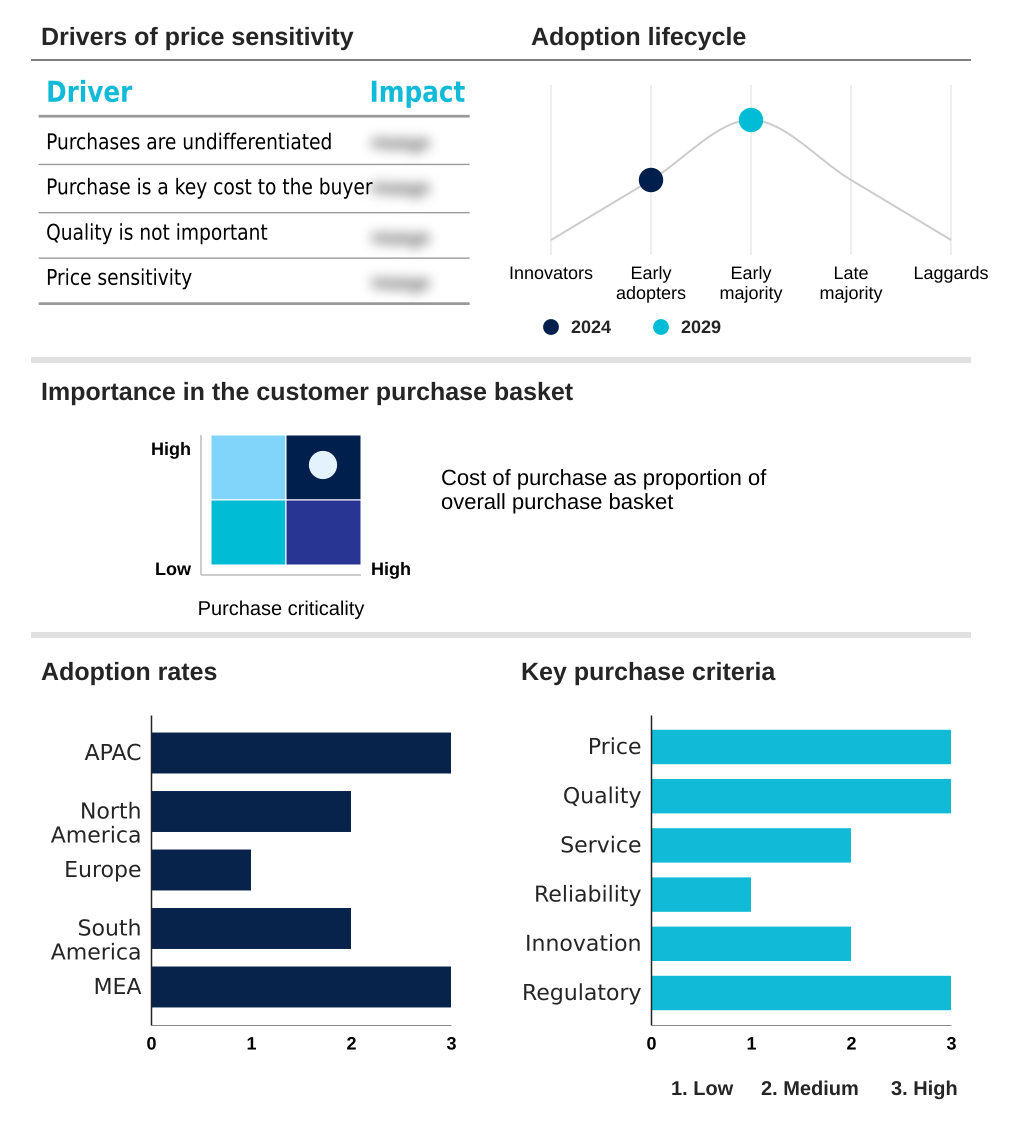
The machine learning in automobile market forecasting report includes the adoption lifecycle of the market, covering from the innovator’s stage to the laggard’s stage. It focuses on adoption rates in different regions based on penetration. Furthermore, the machine learning in automobile market report also includes key purchase criteria and drivers of price sensitivity to help companies evaluate and develop their market growth analysis strategies.

Customer Landscape of Machine Learning In Automobile Industry

Competitive Landscape

Companies are implementing various strategies, such as strategic alliances, machine learning in automobile market forecast, partnerships, mergers and acquisitions, geographical expansion, and product/service launches, to enhance their presence in the industry.

Aptiv Plc - Key offerings include radar-enhanced object classification through ADAS, sensor fusion platforms, and secure over-the-air updates, enabling advanced safety and user experience functionalities.

The industry research and growth report includes detailed analyses of the competitive landscape of the market and information about key companies, including:

  • Aptiv Plc
  • BMW AG
  • Cerence Inc.
  • Continental AG
  • Cruise.com Inc.
  • DeepSeek
  • Ford Motor Co.
  • Huawei Technologies Co. Ltd.
  • Intel Corp.
  • Magna International Inc.
  • Mobileye Technologies Ltd.
  • MORAI Inc.
  • NVIDIA Corp.
  • Qualcomm Inc.
  • Robert Bosch GmbH
  • Tesla Inc.
  • Toyota Motor Corp.
  • Volkswagen AG
  • Waymo LLC

Qualitative and quantitative analysis of companies has been conducted to help clients understand the wider business environment as well as the strengths and weaknesses of key industry players. Data is qualitatively analyzed to categorize companies as pure play, category-focused, industry-focused, and diversified; it is quantitatively analyzed to categorize companies as dominant, leading, strong, tentative, and weak.

Recent Development and News in Machine learning in automobile market

  • In September, 2024, NVIDIA Corp. announced a strategic partnership with Volkswagen AG to co-develop the next-generation AI-powered cockpit, leveraging the DRIVE Thor platform for advanced in-vehicle infotainment and driver monitoring.
  • In November, 2024, Continental AG launched its new Sensor Fusion Pro platform, a domain controller capable of processing data from over 20 sensors in real-time, designed to meet ASIL-D safety requirements for Level 3 autonomous driving.
  • In January, 2025, Cruise LLC received regulatory approval from Parisian authorities to begin limited testing of its driverless robotaxi service in designated districts of Paris, marking its first operational expansion into the European market.
  • In April, 2025, Intel Corp. acquired a leading federated learning startup for an undisclosed sum, aiming to integrate its privacy-preserving AI training technology into Mobileye's future autonomous driving stacks to accelerate fleet learning.

Dive into Technavio’s robust research methodology, blending expert interviews, extensive data synthesis, and validated models for unparalleled Machine Learning In Automobile Market insights. See full methodology.

Market Scope
Page number 325
Base year 2024
Historic period 2019-2023
Forecast period 2025-2029
Growth momentum & CAGR Accelerate at a CAGR of 29.1%
Market growth 2025-2029 USD 11935.1 million
Market structure Fragmented
YoY growth 2024-2025(%) 27.5%
Key countries China, Japan, India, South Korea, Australia, Indonesia, US, Canada, Mexico, Germany, UK, France, Italy, Spain, The Netherlands, Brazil, Argentina, Colombia, Saudi Arabia, UAE, South Africa, Israel and Turkey
Competitive landscape Leading Companies, Market Positioning of Companies, Competitive Strategies, and Industry Risks

Request Free Sample

Research Analyst Overview

  • The machine learning in automobile market is defined by a rapid evolution toward the software defined vehicle, powered by deep learning architectures and high performance computing. At the core, convolutional neural networks and other machine learning models enable computer vision systems to perform semantic segmentation and interpret lidar point clouds for real time inference.
  • This data is integrated through sensor fusion techniques. AI accelerators and neural processing units on advanced systems on a chip facilitate these generative AI workloads. The driving policy of autonomous systems is refined using reinforcement learning, while supervised learning depends on meticulous data annotation. Federated learning is emerging to address privacy concerns.
  • The in-cabin experience is being transformed by natural language processing for a better human machine interface and intelligent in vehicle infotainment, alongside driver monitoring systems and occupant monitoring systems. All these systems are kept current via over the air updates, which also improve features like automated parking and conditional automation.
  • This complex ecosystem, communicating through the controller area network and vehicle to everything technologies, faces threats from adversarial attacks. The move toward edge computing frameworks is crucial for performance. The use of digital twin technology, transformer models, and large language models has enhanced simulation and testing capabilities, improving failure prediction in predictive maintenance systems by over 25%.
  • This shift is also creating new opportunities in data monetization and usage based insurance.

What are the Key Data Covered in this Machine Learning In Automobile Market Research and Growth Report?

  • What is the expected growth of the Machine Learning In Automobile Market between 2025 and 2029?

    • USD 11.94 billion, at a CAGR of 29.1%

  • What segmentation does the market report cover?

    • The report is segmented by Vehicle Type (Passenger cars, Light commercial vehicles, and Heavy vehicles), Technology (ML and deep learning, Computer vision, NLP, and Context-aware computing), Application (Advanced driver assistance systems, Autonomous driving, In-vehicle infotainment, and predictive maintenance) and Geography (APAC, North America, Europe, South America, Middle East and Africa)

  • Which regions are analyzed in the report?

    • APAC, North America, Europe, South America and Middle East and Africa

  • What are the key growth drivers and market challenges?

    • Imperative for autonomous driving and advanced driver assistance systems (ADAS), Addressing immense data requirements and verification and validation conundrum

  • Who are the major players in the Machine Learning In Automobile Market?

    • Aptiv Plc, BMW AG, Cerence Inc., Continental AG, Cruise.com Inc., DeepSeek, Ford Motor Co., Huawei Technologies Co. Ltd., Intel Corp., Magna International Inc., Mobileye Technologies Ltd., MORAI Inc., NVIDIA Corp., Qualcomm Inc., Robert Bosch GmbH, Tesla Inc., Toyota Motor Corp., Volkswagen AG and Waymo LLC

Market Research Insights

  • The market is shaped by the convergence of automotive grade computing platforms and consumer demand for in cabin personalization. The integration of embedded machine learning is enabling proactive assistance features, with some systems improving driver situational awareness by up to 25%.
  • This technological shift extends beyond the vehicle to intelligent traffic management systems, where data sharing for cooperative autonomous driving has demonstrated a potential to reduce urban congestion by 15%. As automotive data generation grows, it fuels new business models in vehicle lifecycle management and enables an industrial metaverse platform for manufacturing.
  • This evolution toward intelligent connected vehicles is accelerating, with adoption rates for advanced driver-assistance features in new models increasing by over 40% in key segments.

We can help! Our analysts can customize this machine learning in automobile market research report to meet your requirements.

Get in touch

1. Executive Summary

1.1 Market overview

Executive Summary - Chart on Market Overview
Executive Summary - Data Table on Market Overview
Executive Summary - Chart on Global Market Characteristics
Executive Summary - Chart on Market by Geography
Executive Summary - Chart on Market Segmentation by Vehicle Type
Executive Summary - Chart on Market Segmentation by Technology
Executive Summary - Chart on Market Segmentation by Application
Executive Summary - Chart on Incremental Growth
Executive Summary - Data Table on Incremental Growth
Executive Summary - Chart on Company Market Positioning

2. Technavio Analysis

2.1 Analysis of price sensitivity, lifecycle, customer purchase basket, adoption rates, and purchase criteria

2.2 Criticality of inputs and Factors of differentiation

Chart on Overview on criticality of inputs and factors of differentiation

2.3 Factors of disruption

Chart on Overview on factors of disruption

2.4 Impact of drivers and challenges

Chart on Impact of drivers and challenges in 2024 and 2029

3. Market Landscape

3.1 Market ecosystem

Chart on Parent Market
Data Table on - Parent Market

3.2 Market characteristics

Chart on Market characteristics analysis

3.3 Value chain analysis

Chart on Value chain analysis

4. Market Sizing

4.1 Market definition

Data Table on Offerings of companies included in the market definition

4.2 Market segment analysis

Market segments

4.3 Market size 2024

4.4 Market outlook: Forecast for 2024-2029

Chart on Global - Market size and forecast 2024-2029 ($ million)
Data Table on Global - Market size and forecast 2024-2029 ($ million)
Chart on Global Market: Year-over-year growth 2024-2029 (%)
Data Table on Global Market: Year-over-year growth 2024-2029 (%)

5. Historic Market Size

5.1 Global Machine Learning In Automobile Market 2019 - 2023

Historic Market Size - Data Table on Global Machine Learning In Automobile Market 2019 - 2023 ($ million)

5.2 Vehicle Type segment analysis 2019 - 2023

Historic Market Size - Vehicle Type Segment 2019 - 2023 ($ million)

5.3 Technology segment analysis 2019 - 2023

Historic Market Size - Technology Segment 2019 - 2023 ($ million)

5.4 Application segment analysis 2019 - 2023

Historic Market Size - Application Segment 2019 - 2023 ($ million)

5.5 Geography segment analysis 2019 - 2023

Historic Market Size - Geography Segment 2019 - 2023 ($ million)

5.6 Country segment analysis 2019 - 2023

Historic Market Size - Country Segment 2019 - 2023 ($ million)

6. Five Forces Analysis

6.1 Five forces summary

Five forces analysis - Comparison between 2024 and 2029

6.2 Bargaining power of buyers

Bargaining power of buyers - Impact of key factors 2024 and 2029

6.3 Bargaining power of suppliers

Bargaining power of suppliers - Impact of key factors in 2024 and 2029

6.4 Threat of new entrants

Threat of new entrants - Impact of key factors in 2024 and 2029

6.5 Threat of substitutes

Threat of substitutes - Impact of key factors in 2024 and 2029

6.6 Threat of rivalry

Threat of rivalry - Impact of key factors in 2024 and 2029

6.7 Market condition

Chart on Market condition - Five forces 2024 and 2029

7. Market Segmentation by Vehicle Type

7.1 Market segments

Chart on Vehicle Type - Market share 2024-2029 (%)
Data Table on Vehicle Type - Market share 2024-2029 (%)

7.2 Comparison by Vehicle Type

Chart on Comparison by Vehicle Type
Data Table on Comparison by Vehicle Type

7.3 Passenger cars - Market size and forecast 2024-2029

Chart on Passenger cars - Market size and forecast 2024-2029 ($ million)
Data Table on Passenger cars - Market size and forecast 2024-2029 ($ million)
Chart on Passenger cars - Year-over-year growth 2024-2029 (%)
Data Table on Passenger cars - Year-over-year growth 2024-2029 (%)

7.4 Light commercial vehicles - Market size and forecast 2024-2029

Chart on Light commercial vehicles - Market size and forecast 2024-2029 ($ million)
Data Table on Light commercial vehicles - Market size and forecast 2024-2029 ($ million)
Chart on Light commercial vehicles - Year-over-year growth 2024-2029 (%)
Data Table on Light commercial vehicles - Year-over-year growth 2024-2029 (%)

7.5 Heavy vehicles - Market size and forecast 2024-2029

Chart on Heavy vehicles - Market size and forecast 2024-2029 ($ million)
Data Table on Heavy vehicles - Market size and forecast 2024-2029 ($ million)
Chart on Heavy vehicles - Year-over-year growth 2024-2029 (%)
Data Table on Heavy vehicles - Year-over-year growth 2024-2029 (%)

7.6 Market opportunity by Vehicle Type

Market opportunity by Vehicle Type ($ million)
Data Table on Market opportunity by Vehicle Type ($ million)

8. Market Segmentation by Technology

8.1 Market segments

Chart on Technology - Market share 2024-2029 (%)
Data Table on Technology - Market share 2024-2029 (%)

8.2 Comparison by Technology

Chart on Comparison by Technology
Data Table on Comparison by Technology

8.3 ML and deep learning - Market size and forecast 2024-2029

Chart on ML and deep learning - Market size and forecast 2024-2029 ($ million)
Data Table on ML and deep learning - Market size and forecast 2024-2029 ($ million)
Chart on ML and deep learning - Year-over-year growth 2024-2029 (%)
Data Table on ML and deep learning - Year-over-year growth 2024-2029 (%)

8.4 Computer vision - Market size and forecast 2024-2029

Chart on Computer vision - Market size and forecast 2024-2029 ($ million)
Data Table on Computer vision - Market size and forecast 2024-2029 ($ million)
Chart on Computer vision - Year-over-year growth 2024-2029 (%)
Data Table on Computer vision - Year-over-year growth 2024-2029 (%)

8.5 NLP - Market size and forecast 2024-2029

Chart on NLP - Market size and forecast 2024-2029 ($ million)
Data Table on NLP - Market size and forecast 2024-2029 ($ million)
Chart on NLP - Year-over-year growth 2024-2029 (%)
Data Table on NLP - Year-over-year growth 2024-2029 (%)

8.6 Context-aware computing - Market size and forecast 2024-2029

Chart on Context-aware computing - Market size and forecast 2024-2029 ($ million)
Data Table on Context-aware computing - Market size and forecast 2024-2029 ($ million)
Chart on Context-aware computing - Year-over-year growth 2024-2029 (%)
Data Table on Context-aware computing - Year-over-year growth 2024-2029 (%)

8.7 Market opportunity by Technology

Market opportunity by Technology ($ million)
Data Table on Market opportunity by Technology ($ million)

9. Market Segmentation by Application

9.1 Market segments

Chart on Application - Market share 2024-2029 (%)
Data Table on Application - Market share 2024-2029 (%)

9.2 Comparison by Application

Chart on Comparison by Application
Data Table on Comparison by Application

9.3 Advanced driver assistance systems - Market size and forecast 2024-2029

Chart on Advanced driver assistance systems - Market size and forecast 2024-2029 ($ million)
Data Table on Advanced driver assistance systems - Market size and forecast 2024-2029 ($ million)
Chart on Advanced driver assistance systems - Year-over-year growth 2024-2029 (%)
Data Table on Advanced driver assistance systems - Year-over-year growth 2024-2029 (%)

9.4 Autonomous driving - Market size and forecast 2024-2029

Chart on Autonomous driving - Market size and forecast 2024-2029 ($ million)
Data Table on Autonomous driving - Market size and forecast 2024-2029 ($ million)
Chart on Autonomous driving - Year-over-year growth 2024-2029 (%)
Data Table on Autonomous driving - Year-over-year growth 2024-2029 (%)

9.5 In-vehicle infotainment - Market size and forecast 2024-2029

Chart on In-vehicle infotainment - Market size and forecast 2024-2029 ($ million)
Data Table on In-vehicle infotainment - Market size and forecast 2024-2029 ($ million)
Chart on In-vehicle infotainment - Year-over-year growth 2024-2029 (%)
Data Table on In-vehicle infotainment - Year-over-year growth 2024-2029 (%)

9.6 Predictive maintenance - Market size and forecast 2024-2029

Chart on Predictive maintenance - Market size and forecast 2024-2029 ($ million)
Data Table on Predictive maintenance - Market size and forecast 2024-2029 ($ million)
Chart on Predictive maintenance - Year-over-year growth 2024-2029 (%)
Data Table on Predictive maintenance - Year-over-year growth 2024-2029 (%)

9.7 Market opportunity by Application

Market opportunity by Application ($ million)
Data Table on Market opportunity by Application ($ million)

10. Customer Landscape

10.1 Customer landscape overview

Analysis of price sensitivity, lifecycle, customer purchase basket, adoption rates, and purchase criteria

11. Geographic Landscape

11.1 Geographic segmentation

Chart on Market share by geography 2024-2029 (%)
Data Table on Market share by geography 2024-2029 (%)

11.2 Geographic comparison

Chart on Geographic comparison
Data Table on Geographic comparison

11.3 APAC - Market size and forecast 2024-2029

Chart on APAC - Market size and forecast 2024-2029 ($ million)
Data Table on APAC - Market size and forecast 2024-2029 ($ million)
Chart on APAC - Year-over-year growth 2024-2029 (%)
Data Table on APAC - Year-over-year growth 2024-2029 (%)
Chart on Regional Comparison - APAC
Data Table on Regional Comparison - APAC

11.3.1 China - Market size and forecast 2024-2029

Chart on China - Market size and forecast 2024-2029 ($ million)
Data Table on China - Market size and forecast 2024-2029 ($ million)
Chart on China - Year-over-year growth 2024-2029 (%)
Data Table on China - Year-over-year growth 2024-2029 (%)

11.3.2 Japan - Market size and forecast 2024-2029

Chart on Japan - Market size and forecast 2024-2029 ($ million)
Data Table on Japan - Market size and forecast 2024-2029 ($ million)
Chart on Japan - Year-over-year growth 2024-2029 (%)
Data Table on Japan - Year-over-year growth 2024-2029 (%)

11.3.3 India - Market size and forecast 2024-2029

Chart on India - Market size and forecast 2024-2029 ($ million)
Data Table on India - Market size and forecast 2024-2029 ($ million)
Chart on India - Year-over-year growth 2024-2029 (%)
Data Table on India - Year-over-year growth 2024-2029 (%)

11.3.4 South Korea - Market size and forecast 2024-2029

Chart on South Korea - Market size and forecast 2024-2029 ($ million)
Data Table on South Korea - Market size and forecast 2024-2029 ($ million)
Chart on South Korea - Year-over-year growth 2024-2029 (%)
Data Table on South Korea - Year-over-year growth 2024-2029 (%)

11.3.5 Australia - Market size and forecast 2024-2029

Chart on Australia - Market size and forecast 2024-2029 ($ million)
Data Table on Australia - Market size and forecast 2024-2029 ($ million)
Chart on Australia - Year-over-year growth 2024-2029 (%)
Data Table on Australia - Year-over-year growth 2024-2029 (%)

11.3.6 Indonesia - Market size and forecast 2024-2029

Chart on Indonesia - Market size and forecast 2024-2029 ($ million)
Data Table on Indonesia - Market size and forecast 2024-2029 ($ million)
Chart on Indonesia - Year-over-year growth 2024-2029 (%)
Data Table on Indonesia - Year-over-year growth 2024-2029 (%)

11.4 North America - Market size and forecast 2024-2029

Chart on North America - Market size and forecast 2024-2029 ($ million)
Data Table on North America - Market size and forecast 2024-2029 ($ million)
Chart on North America - Year-over-year growth 2024-2029 (%)
Data Table on North America - Year-over-year growth 2024-2029 (%)
Chart on Regional Comparison - North America
Data Table on Regional Comparison - North America

11.4.1 US - Market size and forecast 2024-2029

Chart on US - Market size and forecast 2024-2029 ($ million)
Data Table on US - Market size and forecast 2024-2029 ($ million)
Chart on US - Year-over-year growth 2024-2029 (%)
Data Table on US - Year-over-year growth 2024-2029 (%)

11.4.2 Canada - Market size and forecast 2024-2029

Chart on Canada - Market size and forecast 2024-2029 ($ million)
Data Table on Canada - Market size and forecast 2024-2029 ($ million)
Chart on Canada - Year-over-year growth 2024-2029 (%)
Data Table on Canada - Year-over-year growth 2024-2029 (%)

11.4.3 Mexico - Market size and forecast 2024-2029

Chart on Mexico - Market size and forecast 2024-2029 ($ million)
Data Table on Mexico - Market size and forecast 2024-2029 ($ million)
Chart on Mexico - Year-over-year growth 2024-2029 (%)
Data Table on Mexico - Year-over-year growth 2024-2029 (%)

11.5 Europe - Market size and forecast 2024-2029

Chart on Europe - Market size and forecast 2024-2029 ($ million)
Data Table on Europe - Market size and forecast 2024-2029 ($ million)
Chart on Europe - Year-over-year growth 2024-2029 (%)
Data Table on Europe - Year-over-year growth 2024-2029 (%)
Chart on Regional Comparison - Europe
Data Table on Regional Comparison - Europe

11.5.1 Germany - Market size and forecast 2024-2029

Chart on Germany - Market size and forecast 2024-2029 ($ million)
Data Table on Germany - Market size and forecast 2024-2029 ($ million)
Chart on Germany - Year-over-year growth 2024-2029 (%)
Data Table on Germany - Year-over-year growth 2024-2029 (%)

11.5.2 UK - Market size and forecast 2024-2029

Chart on UK - Market size and forecast 2024-2029 ($ million)
Data Table on UK - Market size and forecast 2024-2029 ($ million)
Chart on UK - Year-over-year growth 2024-2029 (%)
Data Table on UK - Year-over-year growth 2024-2029 (%)

11.5.3 France - Market size and forecast 2024-2029

Chart on France - Market size and forecast 2024-2029 ($ million)
Data Table on France - Market size and forecast 2024-2029 ($ million)
Chart on France - Year-over-year growth 2024-2029 (%)
Data Table on France - Year-over-year growth 2024-2029 (%)

11.5.4 Italy - Market size and forecast 2024-2029

Chart on Italy - Market size and forecast 2024-2029 ($ million)
Data Table on Italy - Market size and forecast 2024-2029 ($ million)
Chart on Italy - Year-over-year growth 2024-2029 (%)
Data Table on Italy - Year-over-year growth 2024-2029 (%)

11.5.5 Spain - Market size and forecast 2024-2029

Chart on Spain - Market size and forecast 2024-2029 ($ million)
Data Table on Spain - Market size and forecast 2024-2029 ($ million)
Chart on Spain - Year-over-year growth 2024-2029 (%)
Data Table on Spain - Year-over-year growth 2024-2029 (%)

11.5.6 The Netherlands - Market size and forecast 2024-2029

Chart on The Netherlands - Market size and forecast 2024-2029 ($ million)
Data Table on The Netherlands - Market size and forecast 2024-2029 ($ million)
Chart on The Netherlands - Year-over-year growth 2024-2029 (%)
Data Table on The Netherlands - Year-over-year growth 2024-2029 (%)

11.6 South America - Market size and forecast 2024-2029

Chart on South America - Market size and forecast 2024-2029 ($ million)
Data Table on South America - Market size and forecast 2024-2029 ($ million)
Chart on South America - Year-over-year growth 2024-2029 (%)
Data Table on South America - Year-over-year growth 2024-2029 (%)
Chart on Regional Comparison - South America
Data Table on Regional Comparison - South America

11.6.1 Brazil - Market size and forecast 2024-2029

Chart on Brazil - Market size and forecast 2024-2029 ($ million)
Data Table on Brazil - Market size and forecast 2024-2029 ($ million)
Chart on Brazil - Year-over-year growth 2024-2029 (%)
Data Table on Brazil - Year-over-year growth 2024-2029 (%)

11.6.2 Argentina - Market size and forecast 2024-2029

Chart on Argentina - Market size and forecast 2024-2029 ($ million)
Data Table on Argentina - Market size and forecast 2024-2029 ($ million)
Chart on Argentina - Year-over-year growth 2024-2029 (%)
Data Table on Argentina - Year-over-year growth 2024-2029 (%)

11.6.3 Colombia - Market size and forecast 2024-2029

Chart on Colombia - Market size and forecast 2024-2029 ($ million)
Data Table on Colombia - Market size and forecast 2024-2029 ($ million)
Chart on Colombia - Year-over-year growth 2024-2029 (%)
Data Table on Colombia - Year-over-year growth 2024-2029 (%)

11.7 Middle East and Africa - Market size and forecast 2024-2029

Chart on Middle East and Africa - Market size and forecast 2024-2029 ($ million)
Data Table on Middle East and Africa - Market size and forecast 2024-2029 ($ million)
Chart on Middle East and Africa - Year-over-year growth 2024-2029 (%)
Data Table on Middle East and Africa - Year-over-year growth 2024-2029 (%)
Chart on Regional Comparison - Middle East and Africa
Data Table on Regional Comparison - Middle East and Africa

11.7.1 Saudi Arabia - Market size and forecast 2024-2029

Chart on Saudi Arabia - Market size and forecast 2024-2029 ($ million)
Data Table on Saudi Arabia - Market size and forecast 2024-2029 ($ million)
Chart on Saudi Arabia - Year-over-year growth 2024-2029 (%)
Data Table on Saudi Arabia - Year-over-year growth 2024-2029 (%)

11.7.2 UAE - Market size and forecast 2024-2029

Chart on UAE - Market size and forecast 2024-2029 ($ million)
Data Table on UAE - Market size and forecast 2024-2029 ($ million)
Chart on UAE - Year-over-year growth 2024-2029 (%)
Data Table on UAE - Year-over-year growth 2024-2029 (%)

11.7.3 South Africa - Market size and forecast 2024-2029

Chart on South Africa - Market size and forecast 2024-2029 ($ million)
Data Table on South Africa - Market size and forecast 2024-2029 ($ million)
Chart on South Africa - Year-over-year growth 2024-2029 (%)
Data Table on South Africa - Year-over-year growth 2024-2029 (%)

11.7.4 Israel - Market size and forecast 2024-2029

Chart on Israel - Market size and forecast 2024-2029 ($ million)
Data Table on Israel - Market size and forecast 2024-2029 ($ million)
Chart on Israel - Year-over-year growth 2024-2029 (%)
Data Table on Israel - Year-over-year growth 2024-2029 (%)

11.7.5 Turkey - Market size and forecast 2024-2029

Chart on Turkey - Market size and forecast 2024-2029 ($ million)
Data Table on Turkey - Market size and forecast 2024-2029 ($ million)
Chart on Turkey - Year-over-year growth 2024-2029 (%)
Data Table on Turkey - Year-over-year growth 2024-2029 (%)

11.8 Market opportunity by geography

Market opportunity by geography ($ million)
Data Tables on Market opportunity by geography ($ million)

12. Drivers, Challenges, and Opportunity

12.1 Market drivers

Imperative for autonomous driving and advanced driver assistance systems (ADAS)
Rising consumer expectations for enhanced in-vehicle experience and predictive maintenance capabilities
Synergistic growth of automotive data generation and high performance computing capabilities

12.2 Market challenges

Addressing immense data requirements and verification and validation conundrum
Navigating nascent and fragmented regulatory, legal, and ethical landscape
Overcoming technical integration complexity, cybersecurity threats, and prohibitive costs

12.3 Impact of drivers and challenges

Impact of drivers and challenges in 2024 and 2029

12.4 Market opportunities

Proliferation of edge and hybrid computing architectures for real time inference
Emergence of software defined vehicle and data monetization models
Diversification of machine learning use cases beyond mobility into in-cabin systems and manufacturing value chain

13. Competitive Landscape

13.1 Overview

13.2

Overview on criticality of inputs and factors of differentiation

13.3 Landscape disruption

Overview on factors of disruption

13.4 Industry risks

Impact of key risks on business

14. Competitive Analysis

14.1 Companies profiled

Companies covered

14.2 Company ranking index

14.3 Market positioning of companies

Matrix on companies position and classification

14.4 Aptiv Plc

Aptiv Plc - Overview
Aptiv Plc - Business segments
Aptiv Plc - Key news
Aptiv Plc - Key offerings
Aptiv Plc - Segment focus
SWOT

14.5 BMW AG

BMW AG - Overview
BMW AG - Business segments
BMW AG - Key offerings
BMW AG - Segment focus
SWOT

14.6 Continental AG

Continental AG - Overview
Continental AG - Business segments
Continental AG - Key news
Continental AG - Key offerings
Continental AG - Segment focus
SWOT

14.7 Ford Motor Co.

Ford Motor Co. - Overview
Ford Motor Co. - Business segments
Ford Motor Co. - Key offerings
Ford Motor Co. - Segment focus
SWOT

14.8 Huawei Technologies Co. Ltd.

Huawei Technologies Co. Ltd. - Overview
Huawei Technologies Co. Ltd. - Product / Service
Huawei Technologies Co. Ltd. - Key news
Huawei Technologies Co. Ltd. - Key offerings
SWOT

14.9 Intel Corp.

Intel Corp. - Overview
Intel Corp. - Business segments
Intel Corp. - Key news
Intel Corp. - Key offerings
Intel Corp. - Segment focus
SWOT

14.10 Magna International Inc.

Magna International Inc. - Overview
Magna International Inc. - Business segments
Magna International Inc. - Key news
Magna International Inc. - Key offerings
Magna International Inc. - Segment focus
SWOT

14.11 Mobileye Technologies Ltd.

Mobileye Technologies Ltd. - Overview
Mobileye Technologies Ltd. - Product / Service
Mobileye Technologies Ltd. - Key offerings
SWOT

14.12 NVIDIA Corp.

NVIDIA Corp. - Overview
NVIDIA Corp. - Business segments
NVIDIA Corp. - Key news
NVIDIA Corp. - Key offerings
NVIDIA Corp. - Segment focus
SWOT

14.13 Qualcomm Inc.

Qualcomm Inc. - Overview
Qualcomm Inc. - Business segments
Qualcomm Inc. - Key news
Qualcomm Inc. - Key offerings
Qualcomm Inc. - Segment focus
SWOT

14.14 Robert Bosch GmbH

Robert Bosch GmbH - Overview
Robert Bosch GmbH - Product / Service
Robert Bosch GmbH - Key news
Robert Bosch GmbH - Key offerings
SWOT

14.15 Tesla Inc.

Tesla Inc. - Overview
Tesla Inc. - Business segments
Tesla Inc. - Key news
Tesla Inc. - Key offerings
Tesla Inc. - Segment focus
SWOT

14.16 Toyota Motor Corp.

Toyota Motor Corp. - Overview
Toyota Motor Corp. - Business segments
Toyota Motor Corp. - Key news
Toyota Motor Corp. - Key offerings
Toyota Motor Corp. - Segment focus
SWOT

14.17 Volkswagen AG

Volkswagen AG - Overview
Volkswagen AG - Business segments
Volkswagen AG - Key news
Volkswagen AG - Key offerings
Volkswagen AG - Segment focus
SWOT

14.18 Waymo LLC

Waymo LLC - Overview
Waymo LLC - Product / Service
Waymo LLC - Key offerings
SWOT

15. Appendix

15.1 Scope of the report

Market definition
Objectives
Notes and caveats

15.2 Inclusions and exclusions checklist

Inclusions checklist
Exclusions checklist

15.3 Currency conversion rates for US$

15.4 Research methodology

15.5 Data procurement

Information sources

15.6 Data validation

15.7 Validation techniques employed for market sizing

15.8 Data synthesis

15.9 360 degree market analysis

15.10 List of abbreviations

Research Methodology

Technavio presents a detailed picture of the market by way of study, synthesis, and summation of data from multiple sources. The analysts have presented the various facets of the market with a particular focus on identifying the key industry influencers. The data thus presented is comprehensive, reliable, and the result of extensive research, both primary and secondary.

INFORMATION SOURCES

Primary sources

  • Manufacturers and suppliers
  • Channel partners
  • Industry experts
  • Strategic decision makers

Secondary sources

  • Industry journals and periodicals
  • Government data
  • Financial reports of key industry players
  • Historical data
  • Press releases

DATA ANALYSIS

Data Synthesis

  • Collation of data
  • Estimation of key figures
  • Analysis of derived insights

Data Validation

  • Triangulation with data models
  • Reference against proprietary databases
  • Corroboration with industry experts

REPORT WRITING

Qualitative

  • Market drivers
  • Market challenges
  • Market trends
  • Five forces analysis

Quantitative

  • Market size and forecast
  • Market segmentation
  • Geographical insights
  • Competitive landscape

Interested in this report?

Get your sample now to see our research methodology and insights!

Download Now

Frequently Asked Questions

Machine Learning In Automobile market growth will increase by USD 11935.1 million during 2025-2029.

The Machine Learning In Automobile market is expected to grow at a CAGR of 29.1% during 2025-2029.

Machine Learning In Automobile market is segmented by Vehicle type (Passenger cars, Light commercial vehicles, Heavy vehicles) Technology (ML and deep learning, Computer vision, NLP, Context-aware computing) Application (Advanced driver assistance systems, Autonomous driving, In-vehicle infotainment, Predictive maintenance)

Aptiv Plc, BMW AG, Cerence Inc., Continental AG, Cruise.com Inc., DeepSeek, Ford Motor Co., Huawei Technologies Co. Ltd., Intel Corp., Magna International Inc., Mobileye Technologies Ltd., MORAI Inc., NVIDIA Corp., Qualcomm Inc., Robert Bosch GmbH, Tesla Inc., Toyota Motor Corp., Volkswagen AG, Waymo LLC are a few of the key vendors in the Machine Learning In Automobile market.

APAC will register the highest growth rate of 39.5% among the other regions. Therefore, the Machine Learning In Automobile market in APAC is expected to garner significant business opportunities for the vendors during the forecast period.

China, Japan, India, South Korea, Australia, Indonesia, US, Canada, Mexico, Germany, UK, France, Italy, Spain, The Netherlands, Brazil, Argentina, Colombia, Saudi Arabia, UAE, South Africa, Israel, Turkey

  • Imperative for autonomous driving and advanced driver assistance systems (ADAS) is the driving factor this market.

The Machine Learning In Automobile market vendors should focus on grabbing business opportunities from the Vehicle type segment as it accounted for the largest market share in the base year.