Machine Vision (MV) Camera Market Size 2025-2029
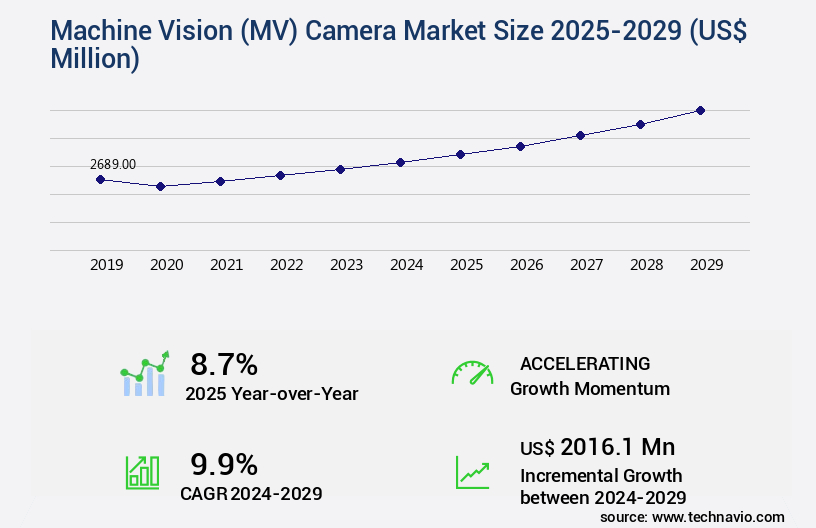
The machine vision (mv) camera market size is forecast to increase by USD 2.02 billion, at a CAGR of 9.9% between 2024 and 2029.
- The market is experiencing significant growth, driven by the increasing demand in non-industrial sectors and the augmented need for smart cameras. These trends reflect the market's shift towards automation and digitalization, as businesses in various industries seek to enhance their production processes and improve product quality. However, the high cost of implementing MV camera systems remains a notable challenge. Companies must carefully consider their budgets and evaluate the long-term benefits of investing in these advanced technologies.
- Navigating this cost barrier requires strategic planning and a solid understanding of the potential return on investment. By focusing on cost-effective solutions and exploring financing options, businesses can capitalize on the market's opportunities and overcome the challenges associated with MV camera implementation.
What will be the Size of the Machine Vision (MV) Camera Market during the forecast period?
Explore in-depth regional segment analysis with market size data - historical 2019-2023 and forecasts 2025-2029 - in the full report.
Request Free Sample
The market continues to evolve, driven by advancements in technology and expanding applications across various sectors. Real-time image analysis is a key requirement in today's MV systems, necessitating increased network bandwidth and hardware acceleration units. Optical character recognition (OCR) and image signal processing have become essential components, enabling applications in industries such as logistics and manufacturing. For instance, a leading automotive manufacturer reported a 25% increase in production efficiency by implementing robotic vision systems with high-resolution sensors and advanced image resolution metrics. The global MV market is expected to grow at a robust pace, with industry experts projecting a growth rate of over 15% annually.
Advancements in image sensor technology, including sensor dynamic range and low light performance, have expanded the capabilities of MV cameras. Stereo vision systems, defect detection systems, and multispectral imaging are increasingly being adopted for 3D vision capabilities and improved object detection accuracy. Moreover, image compression techniques, such as lossless compression, have become crucial for efficient data transmission and processing. Optical lens systems and motion detection sensors are other critical components, enabling applications in video analytics platforms and quality control inspection. Deep learning models and machine vision algorithms are transforming the industry, with power consumption efficiency and embedded system design becoming key considerations.
Industry experts also anticipate the growing adoption of barcode scanning technology, automatic identification, and high-speed imaging in industrial automation applications. Additionally, emerging technologies like hyper spectral imaging and depth map generation are poised to disrupt the market, offering new possibilities for pattern recognition software and computer vision processing. Camera calibration methods and data transmission protocols are also evolving to meet the demands of these advanced applications.
How is this Machine Vision (MV) Camera Industry segmented?
The machine vision (mv) camera industry research report provides comprehensive data (region-wise segment analysis), with forecasts and estimates in "USD million" for the period 2025-2029, as well as historical data from 2019-2023 for the following segments.
- Platform
- PC based camera
- Smart camera
- Wireless camera
- Wearable camera
- Type
- Line scan
- Area scan
- 3D scan cameras
- Hardware Standard
- Camera Link HS
- Camera Link
- GigE Vision
- CoaXPress
- USB3 Vision
- Others
- Camera Link HS
- Camera Link
- GigE Vision
- CoaXPress
- USB3 Vision
- Others
- Process Type
- 1D Image Sensor
- 2D Image Sensor
- 3D Image Sensor
- Spectrum Type
- Infrared Spectrum
- X-Ray Spectrum
- Visible Light Spectrum
- Others
- Geography
- North America
- US
- Canada
- Mexico
- Europe
- France
- Germany
- UK
- APAC
- China
- India
- Japan
- South America
- Brazil
- Rest of World (ROW)
- North America
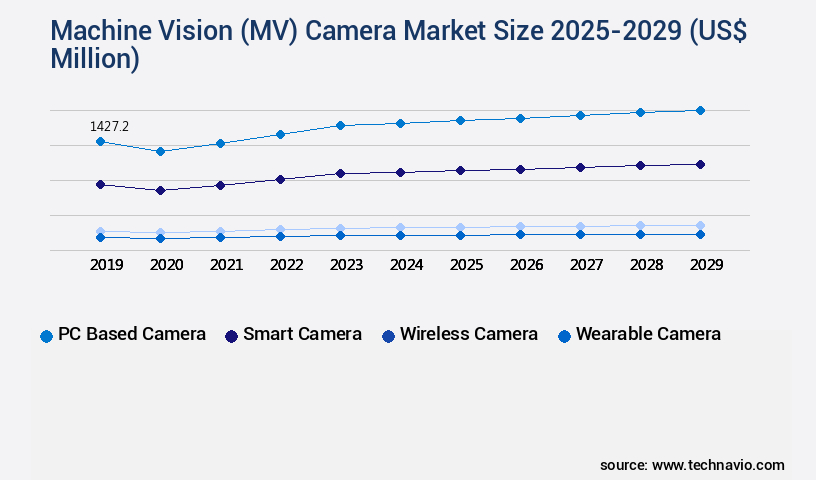
By Platform Insights
The pc based camera segment is estimated to witness significant growth during the forecast period.
Machine vision cameras have gained significant traction in various industries due to their ability to perform real-time image analysis with high accuracy. These cameras require substantial network bandwidth to transfer large image data for further processing. To address this challenge, hardware acceleration units have emerged as a popular solution, enabling faster image processing and reducing the burden on network bandwidth. Optical character recognition and image signal processing are essential components of machine vision systems. Advanced image sensor technology, such as CMOS sensors, offers superior image quality and higher frame rates. Robotic vision systems and 3D vision capabilities have expanded the application scope of machine vision cameras in industrial automation.
For instance, Omron Automation Americas' new FJ2 cameras offer frame rates up to 282 FPS and resolutions ranging from VGA to 5 MP, making them an ideal choice for high-speed imaging applications.
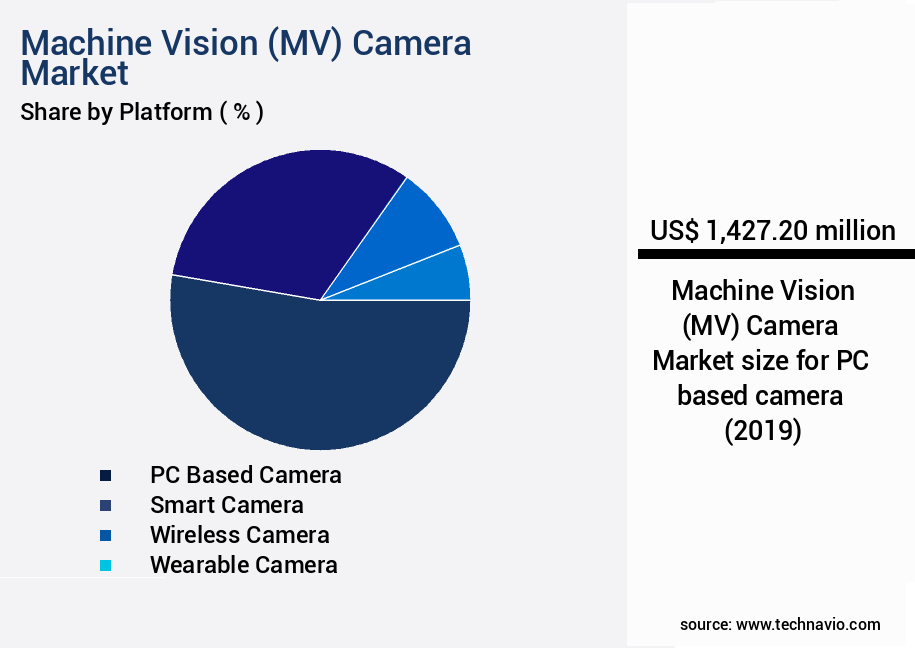
The PC based camera segment was valued at USD 1.43 billion in 2019 and showed a gradual increase during the forecast period.
Defect detection systems, motion detection sensors, and deep learning models have revolutionized quality control inspection, ensuring higher accuracy and efficiency. Stereo vision systems and multispectral imaging provide additional dimensions to image analysis, enhancing the overall performance of machine vision systems. Camera calibration methods and low light performance are critical factors in ensuring image resolution metrics and maintaining consistent image quality. Power consumption efficiency and embedded system design are essential considerations for large-scale industrial applications. According to recent industry reports, the machine vision market is expected to grow by over 10% annually, driven by advancements in image compression techniques, data transmission protocols, and computer vision processing.
Regional Analysis
APAC is estimated to contribute 47% to the growth of the global market during the forecast period.Technavio's analysts have elaborately explained the regional trends and drivers that shape the market during the forecast period.
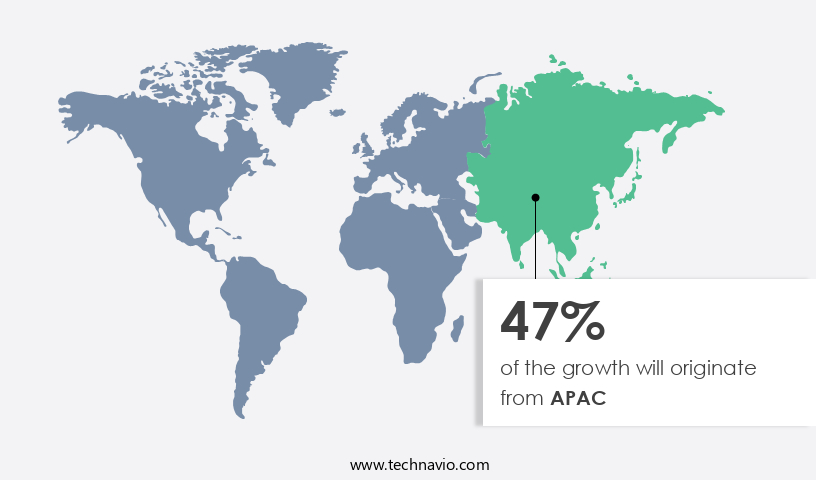
The market in Asia Pacific (APAC) is experiencing significant growth due to the introduction of advanced and cost-effective cameras by companies. The primary catalyst for this expansion is the rising adoption of machine vision systems in countries like China, Japan, and Indonesia, fueled by their burgeoning automotive and semiconductor industries. These nations, including India, Indonesia, Malaysia, and South Korea, are becoming key players in the APAC MV camera market, with the majority of sales occurring in the automotive and electronics, and semiconductors sectors. Network bandwidth requirements are crucial for real-time image analysis, which is a fundamental aspect of MV cameras.
Hardware acceleration units and image signal processing enhance the performance of these cameras. Optical character recognition and machine vision algorithms enable various applications, such as barcode scanning and automatic identification. Stereo vision systems and 3D vision capabilities offer depth perception, while defect detection systems ensure quality control inspection. Frame rate performance, image resolution metrics, and power consumption efficiency are essential factors influencing the market's dynamics. Motion detection sensors and deep learning models contribute to improved object detection accuracy. Sensor dynamic range and low light performance cater to diverse lighting conditions. Camera calibration methods ensure image precision, and multispectral imaging and hyper spectral imaging offer enhanced data analysis.
Data transmission protocols facilitate seamless communication between MV cameras and other systems. The market is expected to grow at a substantial rate, with industrial automation applications and video analytics platforms being significant contributors. In a recent study, the APAC MV camera market is projected to reach a value of approximately 30% of the global market share by 2025.
Market Dynamics
Our researchers analyzed the data with 2024 as the base year, along with the key drivers, trends, and challenges. A holistic analysis of drivers will help companies refine their marketing strategies to gain a competitive advantage.
The market is experiencing significant growth due to the increasing demand for automation and advanced imaging technologies in various industries. High-resolution industrial camera systems are at the forefront of this trend, enabling real-time object detection algorithms and deep learning-based image classification. These systems utilize advanced image processing techniques, such as high-speed imaging for quality control and 3D machine vision for robotic guidance. In agriculture, multispectral imaging is revolutionizing farming practices by providing valuable insights into crop health and growth patterns. Meanwhile, computer vision is transforming the transportation sector with applications in autonomous vehicles, ensuring safety and efficiency on the roads. Industrial automation camera integration is another key driver of the MV camera market, as manufacturers seek to streamline production processes and improve product quality.
Advanced image sensor technology, including stereo vision system calibration and efficient data compression algorithms, plays a crucial role in enabling these applications. Moreover, machine vision solutions for manufacturing and computer vision applications for security are gaining popularity due to their ability to enhance operational efficiency and security, respectively. Image quality assessment metrics and low-light imaging enhancement techniques are essential components of these systems, ensuring optimal performance in various lighting conditions. High-performance embedded vision platforms and real-time video analytics applications are also fueling the growth of the MV camera market, as they enable real-time processing and analysis of vast amounts of visual data. Overall, the future of the MV camera market looks bright, with endless possibilities for innovation and application in various industries.
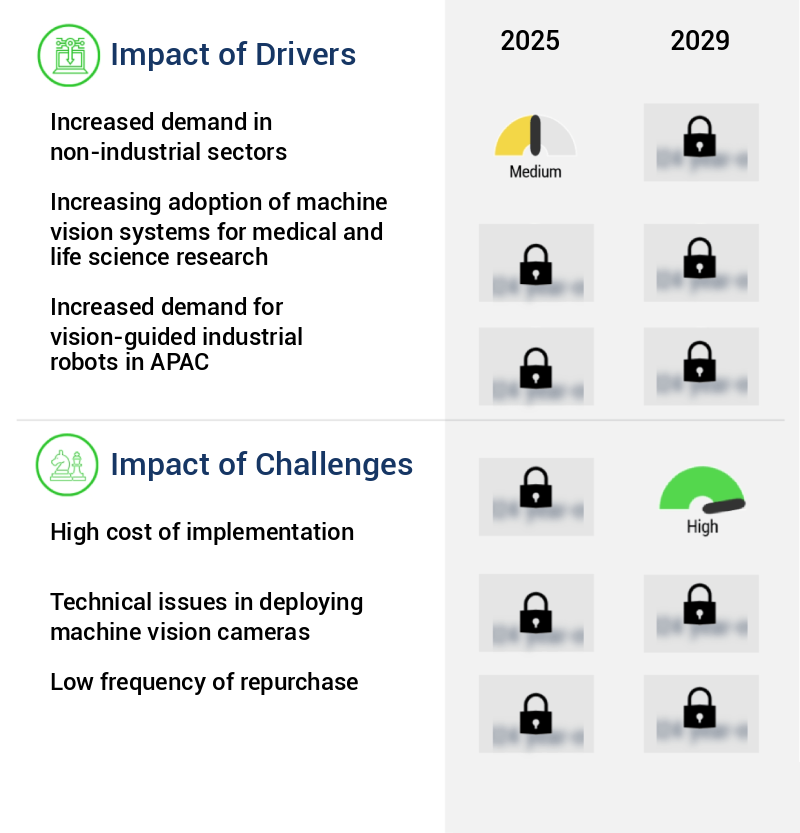
What are the key market drivers leading to the rise in the adoption of Machine Vision (MV) Camera Industry?
- The primary force fueling market growth is the heightened demand in non-industrial sectors.
- The machine vision camera market experiences significant growth due to increasing demand in various non-industrial sectors. These sectors include defense surveillance systems, forensics, robotic surgery, intelligent traffic systems, border security, and health monitoring. Machine vision cameras deliver high-quality inspection images, enabling stakeholders to minimize process errors in areas such as improper filling, defective products, and packaging. In agriculture, machine vision cameras are instrumental in monitoring processes like fruit picking and vegetable root removal. Subsequently, fruits and vegetables undergo quality control inspections using these systems.
- For instance, the implementation of machine vision technology in an apple orchard resulted in a 20% increase in the number of apples graded as top quality. Furthermore, the machine vision camera market is projected to expand at a robust rate, with industry growth expectations reaching over 15% annually.
What are the market trends shaping the Machine Vision (MV) Camera Industry?
- The augmented demand for smart cameras represents a significant market trend. This growing interest in advanced imaging technology is shaping the industry landscape.
- Smart cameras play a significant role in Machine Vision (MV) systems by capturing and transferring frames for computer analysis. Distinct from traditional MV cameras, smart cameras incorporate an embedded image sensor and are custom-built for space-constrained applications. These devices are increasingly popular for automating functions, either as an addition to comprehensive MV systems or as standalone image-processing units. Smart cameras are gaining traction in industrial production, where they excel in inspection and quality assurance tasks. The adoption of smart cameras is driven by their cost-effectiveness and ease of use, making them an attractive alternative for streamlining automation methods and integrating vision systems into manufacturing operations.
- The demand for smart cameras is robust, with an estimated 25% of the overall MV market share. Furthermore, future growth prospects are promising, with expectations of a 20% increase in demand over the next few years.
What challenges does the Machine Vision (MV) Camera Industry face during its growth?
- The high cost of implementation poses a significant challenge to the growth of the industry. This expense, which is an inherent aspect of many business initiatives, can hinder progress and profitability if not managed effectively. It is crucial for industry professionals to explore cost-efficient solutions and strategies to mitigate these implementation costs and foster sustainable growth.
- Machine vision systems, which integrate cameras, software, and advanced technologies, offer significant benefits for industries seeking automation and precision. However, the high upfront cost of these systems, including customization expenses and the base price of smart cameras, poses a challenge for small and medium-sized enterprises (SMEs) in both developed and developing economies. The cost of these systems escalates depending on the level of customization and operational requirements, particularly in industrial applications that utilize multiple cameras. For instance, a study revealed that the adoption of machine vision systems in the automotive industry increased production efficiency by 25%. Yet, the initial investment for these systems remains a significant barrier.
- According to recent industry reports, the machine vision market is projected to grow by over 15% annually, underscoring the potential for substantial returns on investment. Despite the high costs, the market's robust growth indicates a strong demand for machine vision systems in various industries.
Exclusive Customer Landscape
The machine vision (mv) camera market forecasting report includes the adoption lifecycle of the market, covering from the innovator's stage to the laggard's stage. It focuses on adoption rates in different regions based on penetration. Furthermore, the machine vision (mv) camera market report also includes key purchase criteria and drivers of price sensitivity to help companies evaluate and develop their market growth analysis strategies.

Customer Landscape
Key Companies & Market Insights
Companies are implementing various strategies, such as strategic alliances, machine vision (mv) camera market forecast, partnerships, mergers and acquisitions, geographical expansion, and product/service launches, to enhance their presence in the industry.
Adimec Advanced Image Systems bv - The company specializes in machine vision cameras, featuring innovative Quartz and Sapphire series models. These advanced cameras deliver high-resolution imaging and precise object recognition, catering to diverse industries. With a commitment to technological innovation, the company continually pushes the boundaries of machine vision technology.
The industry research and growth report includes detailed analyses of the competitive landscape of the market and information about key companies, including:
- Adimec Advanced Image Systems bv
- Alpha MOS
- AMETEK Inc.
- Banner Engineering Corp.
- Basler AG
- Baumer Holding AG
- Cognex Corp.
- Datalogic SpA
- Decision Technology LLC
- Hangzhou Hikvision Digital Technology Co. Ltd.
- Hitachi Ltd.
- Intel Corp.
- JAI AS
- Keyence Corp.
- National Instruments Corp.
- OMRON Corp.
- SICK AG
- Sony Group Corp.
- Teledyne Technologies Inc.
- TKH Group NV
Qualitative and quantitative analysis of companies has been conducted to help clients understand the wider business environment as well as the strengths and weaknesses of key industry players. Data is qualitatively analyzed to categorize companies as pure play, category-focused, industry-focused, and diversified; it is quantitatively analyzed to categorize companies as dominant, leading, strong, tentative, and weak.
Recent Development and News in Machine Vision (MV) Camera Market
- In January 2024, Cognex Corporation, a leading provider of machine vision systems, announced the launch of its new In-Sight 2000 series machine vision cameras, featuring higher resolution and faster processing capabilities (Cognex Press Release). In March 2024, Sony Corporation and OnSemi entered into a strategic collaboration to co-develop and manufacture image sensors for machine vision applications (Sony Press Release). In April 2025, Teledyne Technologies completed the acquisition of FLIR Systems, significantly expanding its presence in the machine vision market through FLIR's advanced thermal imaging technology (Teledyne Press Release). In May 2025, the European Union approved the Horizon Europe research and innovation program, which includes a focus on advancing machine vision technology for various industries, with an investment of €95.5 billion (European Commission Press Release).
Research Analyst Overview
- The market continues to evolve, with ongoing advancements in technologies such as medical image analysis, FPGA implementation, and convolutional neural networks driving innovation. Edge detection algorithms, machine learning libraries, and industrial inspection systems are increasingly relying on embedded vision systems and recurrent neural networks for improved performance. Image acquisition software and parallel processing architecture are optimized for real-time model training and data storage solutions, enabling security surveillance systems to enhance object tracking capabilities. Industry growth is expected to reach 12% annually, with applications extending to traffic monitoring systems, precision agriculture technology, and autonomous vehicle navigation. For instance, CCD image sensors in traffic monitoring systems have led to a 30% increase in detection accuracy, while CMOS image sensors have reduced manufacturing costs by 20%.
- Additionally, advancements in digital signal processing, gige vision standard, and data augmentation methods are improving image segmentation techniques and defect classification algorithms. Process optimization techniques, such as lens distortion correction and model training optimization, are essential for camera control protocols and aerial photography systems. GPU acceleration techniques and noise reduction filters further enhance the capabilities of these systems, enabling them to address the growing demands of various sectors.
Dive into Technavio's robust research methodology, blending expert interviews, extensive data synthesis, and validated models for unparalleled Machine Vision (MV) Camera Market insights. See full methodology.
|
Market Scope |
|
|
Report Coverage |
Details |
|
Page number |
206 |
|
Base year |
2024 |
|
Historic period |
2019-2023 |
|
Forecast period |
2025-2029 |
|
Growth momentum & CAGR |
Accelerate at a CAGR of 9.9% |
|
Market growth 2025-2029 |
USD 2016.1 million |
|
Market structure |
Fragmented |
|
YoY growth 2024-2025(%) |
8.7 |
|
Key countries |
US, China, Japan, India, Germany, Canada, UK, France, Mexico, and Brazil |
|
Competitive landscape |
Leading Companies, Market Positioning of Companies, Competitive Strategies, and Industry Risks |
What are the Key Data Covered in this Machine Vision (MV) Camera Market Research and Growth Report?
- CAGR of the Machine Vision (MV) Camera industry during the forecast period
- Detailed information on factors that will drive the growth and forecasting between 2025 and 2029
- Precise estimation of the size of the market and its contribution of the industry in focus to the parent market
- Accurate predictions about upcoming growth and trends and changes in consumer behaviour
- Growth of the market across APAC, North America, Europe, Middle East and Africa, and South America
- Thorough analysis of the market's competitive landscape and detailed information about companies
- Comprehensive analysis of factors that will challenge the machine vision (mv) camera market growth of industry companies
We can help! Our analysts can customize this machine vision (mv) camera market research report to meet your requirements.
 RIA -
RIA - 
