Magnesite Market Analysis, Size, and Forecast 2025-2029: North America (US and Canada), Europe (France, Germany, Italy, and UK), APAC (China, India, and Japan), South America (Brazil), and Rest of World (ROW)

Magnesite Market Analysis, Size, and Forecast 2025-2029:
North America (US and Canada), Europe (France, Germany, Italy, and UK), APAC (China, India, and Japan), South America (Brazil), and Rest of World (ROW)

Published: Dec 2024 197 Pages SKU: IRTNTR45773

Market Overview at a Glance

$3.41 B
Market Opportunity
5.9%
CAGR
5.5
YoY growth 2024-2025(%)

Magnesite Market Size 2025-2029

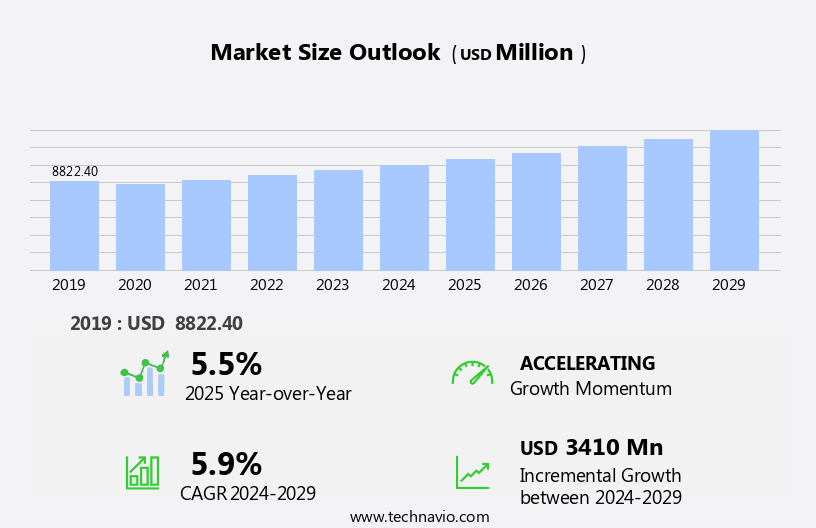
The magnesite market size is forecast to increase by USD 3.41 billion, at a CAGR of 5.9% between 2024 and 2029. The market is driven by the expanding demand from the steel industry, where magnesite is extensively used as a refractory material due to its high melting point and resistance to heat. This trend is expected to continue as steel production increases globally, particularly in emerging economies.

Major Market Trends & Insights

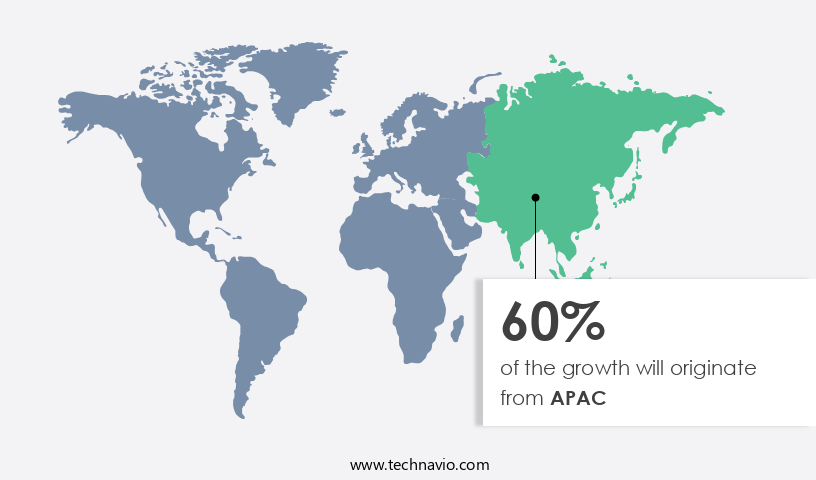
  • APAC dominated the market and contributed 60% to the growth during the forecast period.
  • The market is expected to grow significantly in Europe region as well over the forecast period.
  • Based on the Product, the Magnesite ore segment led the market and was valued at USD 4.34 million of the global revenue in 2023.
  • Based on the Application, the refractory segment accounted for the largest market revenue share in 2023.

Market Size & Forecast

  • Future Opportunities: USD 3.41 Billion
  • CAGR (2024-2029): 5.9%
  • APAC: Largest market in 2023

Another significant trend is the adoption of lightweight materials in the automotive industry, which presents an opportunity for magnesite as it is used in the production of magnesium alloys, known for their high strength-to-weight ratio. However, the market faces challenges from available substitutes for magnesite, such as olivine and chromite, which offer similar properties and can be sourced more economically in certain regions. Companies operating in the market must navigate these challenges by focusing on product innovation, cost competitiveness, and strategic partnerships to maintain their market position.

What will be the Size of the Magnesite Market during the forecast period?

Magnesite Market Size

Explore in-depth regional segment analysis with market size data - historical 2019-2023 and forecasts 2025-2029 - in the full report.  
Request Free Sample

The market continues to evolve, driven by the diverse applications of this versatile mineral across various sectors. Magnesite ore processing techniques have advanced significantly, leading to the production of high-purity magnesite and refined magnesite products such as caustic calcined magnesite. The magnesite microstructure and chemical composition play a crucial role in determining its properties, which are essential for its use in refractories, steelmaking, agriculture, and other industries. Magnesite refractories, for instance, exhibit remarkable compressive strength and thermal conductivity, making them indispensable in high-temperature applications. In steelmaking, magnesite is used as a flux to reduce impurities and improve the quality of the final product.

Meanwhile, in agriculture, magnesite is used as a soil conditioner to enhance crop growth. The magnesite mining techniques have also evolved to ensure efficient extraction and processing of magnesite minerals. For example, the use of advanced sintering and clinker production methods has led to the production of dead-burned magnesite with improved reactivity and durability. The market is expected to grow at a robust pace, with industry analysts projecting a growth rate of over 5% annually. The demand for magnesite in various industries, from construction to steelmaking, is expected to fuel this growth. For instance, the use of magnesite in fireproofing and insulation applications is on the rise due to the increasing demand for energy-efficient and fire-resistant building materials.

One notable example of magnesite's impact on the market is the significant increase in magnesite particle size production for use in magnesite brick manufacturing. This innovation has led to the production of stronger and more durable bricks, which are in high demand in the construction industry. In conclusion, the market is a dynamic and evolving space, with ongoing advancements in magnesite processing, applications, and mining techniques driving growth and innovation. From refractories and steelmaking to agriculture and construction, magnesite's versatility and essential properties make it a valuable resource for various industries.

How is this Magnesite Industry segmented?

The magnesite industry research report provides comprehensive data (region-wise segment analysis), with forecasts and estimates in "USD million" for the period 2025-2029, as well as historical data from 2019-2023 for the following segments.

  • Product
    • Magnesite ore
    • Dead burned magnesia
    • Fused magnesia
  • Application
    • Refractory
    • Steel Production
    • Construction
    • Environmental Applications
  • End-User Industry
    • Cement
    • Chemicals
    • Agriculture
  • Geography
    • North America
      • US
      • Canada
    • Europe
      • France
      • Germany
      • Italy
      • UK
    • Middle East and Africa
      • Egypt
      • KSA
      • Oman
      • UAE
    • APAC
      • China
      • India
      • Japan
    • South America
      • Argentina
      • Brazil
    • Rest of World (ROW)

By Product Insights

The magnesite ore segment is estimated to witness significant growth during the forecast period. The segment was valued at USD 4.34 billion in 2023. It continued to the largest segment at a CAGR of 4.54%.

Magnesite ore, a mineral primarily consisting of magnesium, is found abundantly in regions such as North America, South America, Europe, Africa, and Asia. The two primary types of magnesite ore are dolomite and magnesite. This versatile mineral serves various commercial and industrial applications. Historically, it has been utilized in cement production. In the modern industrial landscape, magnesite is employed as an insulator due to its heat-absorbing properties. Furthermore, it plays a crucial role in the manufacturing process of metals like steel and aluminum. Magnesite undergoes several processing techniques, including caustic calcination, to yield high-purity magnesite. The microstructure of magnesite influences its properties, with purity testing ensuring optimal refractory applications.

Magnesite refractories are integral to steelmaking, enhancing furnace efficiency and reducing energy consumption. In agriculture, magnesite is used as a soil conditioner to improve crop yield. Magnesite's chemical composition, with a magnesium oxide content of approximately 60%, is a critical factor in its applications. The mineral's compressive strength, flexural strength, and thermal conductivity are essential properties for various industries. Magnesite's crystallography and particle size determine its reactivity, which is crucial in applications like carbonation and sintering. The market is expected to grow significantly, with industry experts estimating a 7% increase in demand over the next few years. A notable example of magnesite's impact is the 25% sales increase recorded by a leading magnesite brick manufacturing company due to the growing demand for fireproofing materials.

Magnesite's diverse applications, from cement production to insulation, make it an indispensable component in numerous industries.

Magnesite Market Size

Request Free Sample

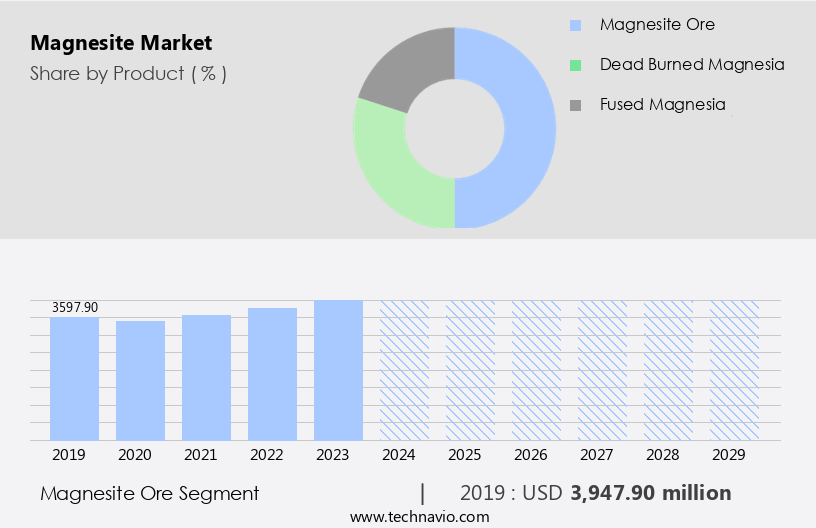
The Magnesite ore segment was valued at USD 3.95 billion in 2019 and showed a gradual increase during the forecast period.

Regional Analysis

APAC is estimated to contribute 60% to the growth of the global market during the forecast period. Data suggests that the future opportunities for growth in the APAC region estimates to be around USD 3.41 billion. Technavio's analysts have elaborately explained the regional trends and drivers that shape the market during the forecast period.

Magnesite Market Share by Geography

 Request Free Sample

Magnesite, a valuable mineral with various industrial applications, is primarily found in abundant reserves across APAC countries, including North Korea, China, Australia, and India. China, being the world's largest producer and exporter, produced approximately 13 million metric tons in 2023, maintaining its leading position. India is another significant player in the market, both as a producer and consumer. Magnesite's primary application lies in the iron and steel industry as a refractory material, which is expected to witness increased demand due to the rapid expansion in steel and iron production. The mineral's other applications include agriculture, cement, insulation, and fireproofing.

Magnesite's properties, such as high compressive strength, thermal conductivity, and chemical composition, make it suitable for diverse applications. For instance, high-purity magnesite is used in the production of magnesium oxide, which is a crucial component in various industries. Mining techniques, magnesite particle size, and magnesite crystallography are essential factors influencing the production process and product quality. Proper magnesite purity testing and sintering ensure the desired magnesite properties for various applications. The market for magnesite is projected to grow steadily, with increasing demand for magnesite refractories and magnesite composites in various industries. For example, the market in the steel industry is expected to grow by over 5% annually due to the rising demand for steel in the infrastructure and automotive sectors.

In conclusion, magnesite's versatile properties and abundant reserves in APAC make it a crucial mineral for various industries, particularly the iron and steel sector. Proper mining techniques, processing, and quality control are essential to meet the increasing demand for magnesite and its various applications.

Market Dynamics

Our researchers analyzed the data with 2024 as the base year, along with the key drivers, trends, and challenges. A holistic analysis of drivers will help companies refine their marketing strategies to gain a competitive advantage.

The market encompasses a wide range of applications for magnesite, a mineral known for its unique properties. Magnesite refractory bricks, produced through the calcination of magnesite ore, are a key application. Caustic calcined magnesite finds use in various industries, including the production of magnesite clinker through a process that involves heating magnesite to high temperatures. High purity magnesite powder is essential in numerous applications, such as in the production of cement, where it enhances the strength and thermal conductivity of the final product. The magnesite ore processing techniques used to extract and refine this mineral play a significant role in determining its quality. Magnesite's microstructure analysis, compressive strength testing, and dead burned magnesite chemical analysis are crucial in assessing its suitability for various applications.

The magnesite hydration kinetics study and carbonation reaction are critical in understanding its behavior under different conditions. Magnesite's particle size distribution and quality control methods are essential factors in ensuring consistent product performance. In the steelmaking process, magnesite is used as a refractory material due to its excellent insulation properties and fireproofing capabilities. Magnesite refractory applications in steel include linings for blast furnaces and steelmaking furnaces. Magnesite's insulation material properties make it an ideal choice for various industries, including construction and energy. Its fireproofing material types find extensive use in fire protection systems, while magnesite flooring installation techniques are used to create durable and long-lasting floors. In conclusion, the market is driven by the diverse applications of this versatile mineral. From its use in cement production to its role as a refractory material in steelmaking, magnesite's unique properties make it an indispensable component in numerous industries. The continued research and development of magnesite processing techniques and applications will further expand its market potential.

The magnesite market drives innovation through advanced material applications. The magnesite refractory brick properties ensure superior heat resistance in high-temperature environments, while caustic calcined magnesite applications enhance industrial processes like fertilizer production. The magnesite clinker production process delivers consistent quality for refractory linings, and high purity magnesite powder uses span pharmaceuticals and ceramics. Incorporating magnesite in cement production improves durability, supported by magnesite thermal conductivity measurement and magnesite compressive strength testing for performance validation. Magnesite microstructure analysis optimizes material behavior, while magnesite carbonation reaction aids environmental applications. Precise magnesite particle size distribution ensures product uniformity, backed by magnesite quality control methods and magnesite durability testing standards. In steelmaking, magnesite in steelmaking process and magnesite insulation material properties, alongside magnesite fireproofing material types, elevate efficiency and safety.

What are the key market drivers leading to the rise in the adoption of Magnesite Industry?

  • The steel industry's increasing demand for refractories serves as the primary market driver. 
  • Magnesite, a vital refractory material, withstands extreme heat and plays a crucial role in various industrial processes. The iron and steel industry is the primary consumer of refractory magnesia, accounting for approximately two-thirds of its global usage. Refractories are essential in manufacturing processes, from coke ovens to blast furnaces. The rapid industrialization and urbanization in both developed and developing nations offer significant growth opportunities for the iron and steel sector. With wide applicability in industries such as building and construction, automotive and aviation, and oil and gas, steel's demand continues to rise. In steel casting, a method of creating desired shapes by pouring molten steel into sand or ceramic molds, refractories play a pivotal role.
  • According to industry reports, the global magnesia market is expected to grow by over 5% annually due to the increasing demand for refractory materials in various industries. For instance, the steel casting industry's sales revenue increased by 7% in 2020, highlighting the market's potential.

What are the market trends shaping the Magnesite Industry?

  • The use of lightweight materials is becoming increasingly popular in the automotive industry, representing a significant market trend. This shift towards lighter components aims to improve fuel efficiency and reduce emissions, making vehicles more eco-friendly and cost-effective for consumers.
  • In the automotive sector, there is a growing trend towards the utilization of lightweight materials. The primary catalyst for this demand stems from consumers' increasing preference for fuel-efficient vehicles. As awareness about climate change and environmental concerns escalates, alongside rising fuel costs, consumers are increasingly opting for lighter vehicles to conserve fuel. To achieve a fuel efficiency of 4.5 miles per gallon, approximately 25% reduction in the total vehicle weight is necessary.
  • By 2023, the automotive industry is projected to manufacture over 100 million vehicles, with a significant emphasis on the adoption of lightweight materials to adhere to stringent environmental regulations and satisfy fuel efficiency standards.

What challenges does the Magnesite Industry face during its growth?

  • The identification of suitable alternatives to magnesite poses a significant challenge and significantly impacts the expansion of the industry. 
  • The market is experiencing robust growth due to the extensive use of magnesia in various industries, particularly in refractory applications. Magnesite is one of several materials used in refractory production, which are capable of withstanding high temperatures. Other refractory materials include alumina, fireclays, bauxite, chromite, dolomite, silicon carbide, and zirconia. Magnesite's significance extends beyond its role as a major ore for magnesium. Other sources, such as dolomite, brucite, olivine, and magnesium compounds derived from wells, lake brines, and seawater, are also used to obtain magnesium. The refractory sector's demand for magnesite is substantial, but it faces competition from alternative materials.
  • According to industry reports, the market is projected to expand at a significant rate, with global demand expected to reach over 15 million metric tons by 2025. For instance, the steel industry's use of magnesia in refractory applications is projected to increase by approximately 3% per year, contributing to market growth.

Exclusive Customer Landscape

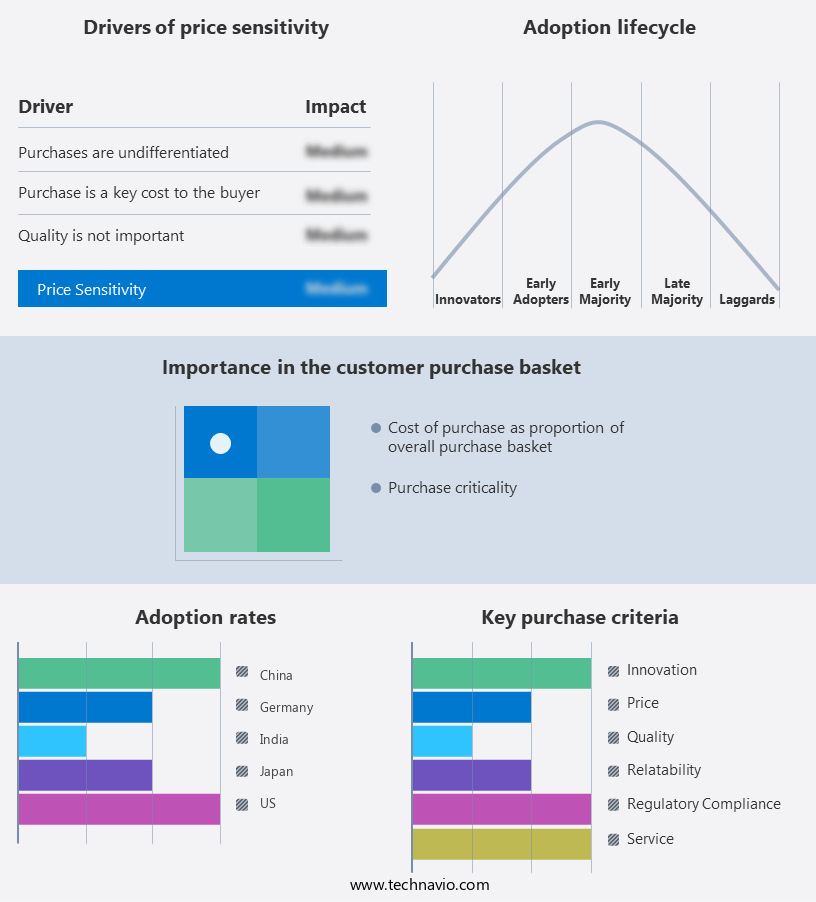
The magnesite market forecasting report includes the adoption lifecycle of the market, covering from the innovator's stage to the laggard's stage. It focuses on adoption rates in different regions based on penetration. Furthermore, the magnesite market report also includes key purchase criteria and drivers of price sensitivity to help companies evaluate and develop their market growth analysis strategies.

Magnesite Market Share by Geography

 Customer Landscape

Key Companies & Market Insights

Companies are implementing various strategies, such as strategic alliances, magnesite market forecast, partnerships, mergers and acquisitions, geographical expansion, and product/service launches, to enhance their presence in the industry.

Almora Magnesite Ltd. - The company specializes in the production and supply of various magnesites, including Dead Burnt Magnesite, Calcined Magnesite, and Light Calcined Magnesite, catering to diverse industrial applications. 

The industry research and growth report includes detailed analyses of the competitive landscape of the market and information about key companies, including:

  • Almora Magnesite Ltd.
  • Compagnie Financiere et de Participations Roullier
  • Galaxy Enterprise
  • GRECIAN MAGNESITE SA
  • Haicheng Magnesite Group Co. Ltd.
  • IBAR Group
  • Iranian Refractories Procurement and Production Co.
  • Konoshima Chemical Co. Ltd.
  • Korab Resources Ltd.
  • Kumas Manyezit Sanayi A S
  • MGX Minerals Inc.
  • PD Refractories GmbH
  • Premier Magnesia LLC
  • Ramakrishna Magnesite Mines
  • Refratechnik Holding GmbH
  • RHI Magnesita GmbH
  • SCR Sibelco NV
  • Sri Ponkumar Magnesite Mines
  • TANMAG
  • Tomra Systems ASA

Qualitative and quantitative analysis of companies has been conducted to help clients understand the wider business environment as well as the strengths and weaknesses of key industry players. Data is qualitatively analyzed to categorize companies as pure play, category-focused, industry-focused, and diversified; it is quantitatively analyzed to categorize companies as dominant, leading, strong, tentative, and weak.

Recent Development and News in Magnesite Market

  • In January 2024, Imerys, a leading mineral-based specialty solutions company, announced the expansion of its magnesite production capacity in Greece by 150,000 metric tons per year. This strategic investment was aimed at strengthening Imerys' position as a key player in the market (Imerys Press Release, 2024).
  • In March 2024, Magnezit Group, a leading magnesite producer, and Ferro-Alloy Resources Limited, a global producer of high-grade ferroalloys, signed a Memorandum of Understanding to explore potential synergies and collaborations in the magnesia and ferroalloy industries. This strategic partnership aimed to leverage the strengths of both companies and create value for their customers (Magnezit Group Press Release, 2024).
  • In May 2024, Sibelco, a global producer of industrial minerals, completed the acquisition of the magnesia business of Minerals Technologies, Inc. This acquisition significantly expanded Sibelco's magnesia product portfolio and geographic reach, making it a major player in the market (Sibelco Press Release, 2024).
  • In February 2025, the European Commission approved the merger between Imerys and Sibelco, subject to certain conditions. This approval marked a significant development in the market, as the merged entity would become a leading global player with a strong presence in Europe (European Commission Press Release, 2025).

Research Analyst Overview

  • The market continues to evolve, driven by advancements in magnesite beneficiation technologies and increasing demand for magnesite in various sectors. For instance, the automotive industry's shift towards lightweight materials has led to a 5% annual growth in magnesite demand for the production of lightweight alloys. However, regulations governing magnesite mining and handling remain a significant concern, with stricter environmental standards necessitating innovative waste management solutions. Magnesite's properties, such as high thermal conductivity and excellent refractory performance, make it an indispensable component in numerous industries. The market dynamics are further influenced by the magnesite supply chain, which includes raw material sourcing, production capacity, and pricing.
  • Magnesite's cost structure is influenced by factors such as production methods, transportation costs, and market competition. As the magnesite product lifecycle progresses, research and development efforts focus on improving magnesite's sustainability and safety. Magnesite recycling and calcination processes are being explored to minimize environmental impact and reduce the need for primary magnesite sources. The ongoing research in magnesite technology and the substitution of magnesite with alternative materials also shapes the market landscape.

Dive into Technavio's robust research methodology, blending expert interviews, extensive data synthesis, and validated models for unparalleled Magnesite Market insights. See full methodology.

Market Scope

Report Coverage

Details

Page number

197

Base year

2024

Historic period

2019-2023

Forecast period

2025-2029

Growth momentum & CAGR

Accelerate at a CAGR of 5.9%

Market growth 2025-2029

USD 3410 million

Market structure

Fragmented

YoY growth 2024-2025(%)

5.5

Key countries

India, Germany, France, Japan, US, China, UK, Italy, Canada, and Brazil

Competitive landscape

Leading Companies, Market Positioning of Companies, Competitive Strategies, and Industry Risks

Request Free Sample

What are the Key Data Covered in this Magnesite Market Research and Growth Report?

  • CAGR of the Magnesite industry during the forecast period
  • Detailed information on factors that will drive the growth and forecasting between 2025 and 2029
  • Precise estimation of the size of the market and its contribution of the industry in focus to the parent market
  • Accurate predictions about upcoming growth and trends and changes in consumer behaviour
  • Growth of the market across APAC, Europe, North America, South America, and Middle East and Africa
  • Thorough analysis of the market's competitive landscape and detailed information about companies
  • Comprehensive analysis of factors that will challenge the magnesite market growth of industry companies

We can help! Our analysts can customize this magnesite market research report to meet your requirements.

Get in touch

1 Executive Summary

  • 1.1 Market overview
    • Executive Summary - Chart on Market Overview
    • Executive Summary - Data Table on Market Overview
    • Executive Summary - Chart on Global Market Characteristics
    • Executive Summary - Chart on Market by Geography
    • Executive Summary - Chart on Market Segmentation by Product
    • Executive Summary - Chart on Market Segmentation by Application
    • Executive Summary - Chart on Incremental Growth
    • Executive Summary - Data Table on Incremental Growth
    • Executive Summary - Chart on Company Market Positioning

2 Technavio Analysis

  • 2.1 Analysis of price sensitivity, lifecycle, customer purchase basket, adoption rates, and purchase criteria
    • Analysis of price sensitivity, lifecycle, customer purchase basket, adoption rates, and purchase criteria
  • 2.2 Criticality of inputs and Factors of differentiation
    • Overview on criticality of inputs and factors of differentiation
  • 2.3 Factors of disruption
    • Overview on factors of disruption
  • 2.4 Impact of drivers and challenges
    • Impact of drivers and challenges in 2024 and 2029

3 Market Landscape

  • 3.1 Market ecosystem
    • Parent Market
    • Data Table on - Parent Market
  • 3.2 Market characteristics
    • Market characteristics analysis
  • 3.3 Value chain analysis
    • Value chain analysis

4 Market Sizing

  • 4.1 Market definition
    • Offerings of companies included in the market definition
  • 4.2 Market segment analysis
    • Market segments
  • 4.3 Market size 2024
    • 4.4 Market outlook: Forecast for 2024-2029
      • Chart on Global - Market size and forecast 2024-2029 ($ million)
      • Data Table on Global - Market size and forecast 2024-2029 ($ million)
      • Chart on Global Market: Year-over-year growth 2024-2029 (%)
      • Data Table on Global Market: Year-over-year growth 2024-2029 (%)

    5 Historic Market Size

    • 5.1 Global Magnesite Market 2019 - 2023
      • Historic Market Size - Data Table on Global Magnesite Market 2019 - 2023 ($ million)
    • 5.2 Product segment analysis 2019 - 2023
      • Historic Market Size - Product Segment 2019 - 2023 ($ million)
    • 5.3 Application segment analysis 2019 - 2023
      • Historic Market Size - Application Segment 2019 - 2023 ($ million)
    • 5.4 Geography segment analysis 2019 - 2023
      • Historic Market Size - Geography Segment 2019 - 2023 ($ million)
    • 5.5 Country segment analysis 2019 - 2023
      • Historic Market Size - Country Segment 2019 - 2023 ($ million)

    6 Qualitative Analysis

    • 6.1 The AI impact on Global Magnesite Market

      7 Five Forces Analysis

      • 7.1 Five forces summary
        • Five forces analysis - Comparison between 2024 and 2029
      • 7.2 Bargaining power of buyers
        • Bargaining power of buyers - Impact of key factors 2024 and 2029
      • 7.3 Bargaining power of suppliers
        • Bargaining power of suppliers - Impact of key factors in 2024 and 2029
      • 7.4 Threat of new entrants
        • Threat of new entrants - Impact of key factors in 2024 and 2029
      • 7.5 Threat of substitutes
        • Threat of substitutes - Impact of key factors in 2024 and 2029
      • 7.6 Threat of rivalry
        • Threat of rivalry - Impact of key factors in 2024 and 2029
      • 7.7 Market condition
        • Chart on Market condition - Five forces 2024 and 2029

      8 Market Segmentation by Product

      • 8.1 Market segments
        • Chart on Product - Market share (2024-2029) (%)
        • Data Table on Product - Market share (2024-2029) (%)
      • 8.2 Comparison by Product
        • Chart on Comparison by Product
        • Data Table on Comparison by Product
      • 8.3 Magnesite ore - Market size and forecast (2024-2029)
        • Chart on Magnesite ore - Market size and forecast (2024-2029) ($ million)
        • Data Table on Magnesite ore - Market size and forecast (2024-2029) ($ million)
        • Chart on Magnesite ore - Year-over-year growth (2024-2029) (%)
        • Data Table on Magnesite ore - Year-over-year growth (2024-2029) (%)
      • 8.4 Dead burned magnesia - Market size and forecast (2024-2029)
        • Chart on Dead burned magnesia - Market size and forecast (2024-2029) ($ million)
        • Data Table on Dead burned magnesia - Market size and forecast (2024-2029) ($ million)
        • Chart on Dead burned magnesia - Year-over-year growth (2024-2029) (%)
        • Data Table on Dead burned magnesia - Year-over-year growth (2024-2029) (%)
      • 8.5 Fused magnesia - Market size and forecast (2024-2029)
        • Chart on Fused magnesia - Market size and forecast (2024-2029) ($ million)
        • Data Table on Fused magnesia - Market size and forecast (2024-2029) ($ million)
        • Chart on Fused magnesia - Year-over-year growth (2024-2029) (%)
        • Data Table on Fused magnesia - Year-over-year growth (2024-2029) (%)
      • 8.6 Market opportunity by Product
        • Market opportunity by Product ($ million)
        • Data Table on Market opportunity by Product ($ million)

      9 Market Segmentation by Application

      • 9.1 Market segments
        • Chart on Application - Market share (2024-2029) (%)
        • Data Table on Application - Market share (2024-2029) (%)
      • 9.2 Comparison by Application
        • Chart on Comparison by Application
        • Data Table on Comparison by Application
      • 9.3 Refractory - Market size and forecast (2024-2029)
        • Chart on Refractory - Market size and forecast (2024-2029) ($ million)
        • Data Table on Refractory - Market size and forecast (2024-2029) ($ million)
        • Chart on Refractory - Year-over-year growth (2024-2029) (%)
        • Data Table on Refractory - Year-over-year growth (2024-2029) (%)
      • 9.4 Steel Production - Market size and forecast (2024-2029)
        • Chart on Steel Production - Market size and forecast (2024-2029) ($ million)
        • Data Table on Steel Production - Market size and forecast (2024-2029) ($ million)
        • Chart on Steel Production - Year-over-year growth (2024-2029) (%)
        • Data Table on Steel Production - Year-over-year growth (2024-2029) (%)
      • 9.5 Construction - Market size and forecast (2024-2029)
        • Chart on Construction - Market size and forecast (2024-2029) ($ million)
        • Data Table on Construction - Market size and forecast (2024-2029) ($ million)
        • Chart on Construction - Year-over-year growth (2024-2029) (%)
        • Data Table on Construction - Year-over-year growth (2024-2029) (%)
      • 9.6 Environmental Applications - Market size and forecast (2024-2029)
        • Chart on Environmental Applications - Market size and forecast (2024-2029) ($ million)
        • Data Table on Environmental Applications - Market size and forecast (2024-2029) ($ million)
        • Chart on Environmental Applications - Year-over-year growth (2024-2029) (%)
        • Data Table on Environmental Applications - Year-over-year growth (2024-2029) (%)
      • 9.7 Market opportunity by Application
        • Market opportunity by Application ($ million)
        • Data Table on Market opportunity by Application ($ million)

      10 Market Segmentation by End-User Industry

      • 10.1 Market segments
        • Chart on End-User Industry - Market share (2024-2029) (%)
        • Data Table on End-User Industry - Market share (2024-2029) (%)
      • 10.2 Comparison by End-User Industry
        • Chart on Comparison by End-User Industry
        • Data Table on Comparison by End-User Industry
      • 10.3 Cement - Market size and forecast (2024-2029)
        • Chart on Cement - Market size and forecast (2024-2029) ($ million)
        • Data Table on Cement - Market size and forecast (2024-2029) ($ million)
        • Chart on Cement - Year-over-year growth (2024-2029) (%)
        • Data Table on Cement - Year-over-year growth (2024-2029) (%)
      • 10.4 Chemicals - Market size and forecast (2024-2029)
        • Chart on Chemicals - Market size and forecast (2024-2029) ($ million)
        • Data Table on Chemicals - Market size and forecast (2024-2029) ($ million)
        • Chart on Chemicals - Year-over-year growth (2024-2029) (%)
        • Data Table on Chemicals - Year-over-year growth (2024-2029) (%)
      • 10.5 Agriculture - Market size and forecast (2024-2029)
        • Chart on Agriculture - Market size and forecast (2024-2029) ($ million)
        • Data Table on Agriculture - Market size and forecast (2024-2029) ($ million)
        • Chart on Agriculture - Year-over-year growth (2024-2029) (%)
        • Data Table on Agriculture - Year-over-year growth (2024-2029) (%)
      • 10.6 Market opportunity by End-User Industry
        • Market opportunity by End-User Industry ($ million)
        • Data Table on Market opportunity by End-User Industry ($ million)

      11 Customer Landscape

      • 11.1 Customer landscape overview
        • Analysis of price sensitivity, lifecycle, customer purchase basket, adoption rates, and purchase criteria

      12 Geographic Landscape

      • 12.1 Geographic segmentation
        • Chart on Market share by geography 2024-2029 (%)
        • Data Table on Market share by geography 2024-2029 (%)
      • 12.2 Geographic comparison
        • Chart on Geographic comparison
        • Data Table on Geographic comparison
      • 12.3 APAC - Market size and forecast 2024-2029
        • Chart on APAC - Market size and forecast 2024-2029 ($ million)
        • Data Table on APAC - Market size and forecast 2024-2029 ($ million)
        • Chart on APAC - Year-over-year growth 2024-2029 (%)
        • Data Table on APAC - Year-over-year growth 2024-2029 (%)
      • 12.4 Europe - Market size and forecast 2024-2029
        • Chart on Europe - Market size and forecast 2024-2029 ($ million)
        • Data Table on Europe - Market size and forecast 2024-2029 ($ million)
        • Chart on Europe - Year-over-year growth 2024-2029 (%)
        • Data Table on Europe - Year-over-year growth 2024-2029 (%)
      • 12.5 North America - Market size and forecast 2024-2029
        • Chart on North America - Market size and forecast 2024-2029 ($ million)
        • Data Table on North America - Market size and forecast 2024-2029 ($ million)
        • Chart on North America - Year-over-year growth 2024-2029 (%)
        • Data Table on North America - Year-over-year growth 2024-2029 (%)
      • 12.6 South America - Market size and forecast 2024-2029
        • Chart on South America - Market size and forecast 2024-2029 ($ million)
        • Data Table on South America - Market size and forecast 2024-2029 ($ million)
        • Chart on South America - Year-over-year growth 2024-2029 (%)
        • Data Table on South America - Year-over-year growth 2024-2029 (%)
      • 12.7 Middle East and Africa - Market size and forecast 2024-2029
        • Chart on Middle East and Africa - Market size and forecast 2024-2029 ($ million)
        • Data Table on Middle East and Africa - Market size and forecast 2024-2029 ($ million)
        • Chart on Middle East and Africa - Year-over-year growth 2024-2029 (%)
        • Data Table on Middle East and Africa - Year-over-year growth 2024-2029 (%)
      • 12.8 India - Market size and forecast 2024-2029
        • Chart on India - Market size and forecast 2024-2029 ($ million)
        • Data Table on India - Market size and forecast 2024-2029 ($ million)
        • Chart on India - Year-over-year growth 2024-2029 (%)
        • Data Table on India - Year-over-year growth 2024-2029 (%)
      • 12.9 Germany - Market size and forecast 2024-2029
        • Chart on Germany - Market size and forecast 2024-2029 ($ million)
        • Data Table on Germany - Market size and forecast 2024-2029 ($ million)
        • Chart on Germany - Year-over-year growth 2024-2029 (%)
        • Data Table on Germany - Year-over-year growth 2024-2029 (%)
      • 12.10 Japan - Market size and forecast 2024-2029
        • Chart on Japan - Market size and forecast 2024-2029 ($ million)
        • Data Table on Japan - Market size and forecast 2024-2029 ($ million)
        • Chart on Japan - Year-over-year growth 2024-2029 (%)
        • Data Table on Japan - Year-over-year growth 2024-2029 (%)
      • 12.11 France - Market size and forecast 2024-2029
        • Chart on France - Market size and forecast 2024-2029 ($ million)
        • Data Table on France - Market size and forecast 2024-2029 ($ million)
        • Chart on France - Year-over-year growth 2024-2029 (%)
        • Data Table on France - Year-over-year growth 2024-2029 (%)
      • 12.12 US - Market size and forecast 2024-2029
        • Chart on US - Market size and forecast 2024-2029 ($ million)
        • Data Table on US - Market size and forecast 2024-2029 ($ million)
        • Chart on US - Year-over-year growth 2024-2029 (%)
        • Data Table on US - Year-over-year growth 2024-2029 (%)
      • 12.13 China - Market size and forecast 2024-2029
        • Chart on China - Market size and forecast 2024-2029 ($ million)
        • Data Table on China - Market size and forecast 2024-2029 ($ million)
        • Chart on China - Year-over-year growth 2024-2029 (%)
        • Data Table on China - Year-over-year growth 2024-2029 (%)
      • 12.14 UK - Market size and forecast 2024-2029
        • Chart on UK - Market size and forecast 2024-2029 ($ million)
        • Data Table on UK - Market size and forecast 2024-2029 ($ million)
        • Chart on UK - Year-over-year growth 2024-2029 (%)
        • Data Table on UK - Year-over-year growth 2024-2029 (%)
      • 12.15 Italy - Market size and forecast 2024-2029
        • Chart on Italy - Market size and forecast 2024-2029 ($ million)
        • Data Table on Italy - Market size and forecast 2024-2029 ($ million)
        • Chart on Italy - Year-over-year growth 2024-2029 (%)
        • Data Table on Italy - Year-over-year growth 2024-2029 (%)
      • 12.16 Canada - Market size and forecast 2024-2029
        • Chart on Canada - Market size and forecast 2024-2029 ($ million)
        • Data Table on Canada - Market size and forecast 2024-2029 ($ million)
        • Chart on Canada - Year-over-year growth 2024-2029 (%)
        • Data Table on Canada - Year-over-year growth 2024-2029 (%)
      • 12.17 Brazil - Market size and forecast 2024-2029
        • Chart on Brazil - Market size and forecast 2024-2029 ($ million)
        • Data Table on Brazil - Market size and forecast 2024-2029 ($ million)
        • Chart on Brazil - Year-over-year growth 2024-2029 (%)
        • Data Table on Brazil - Year-over-year growth 2024-2029 (%)
      • 12.18 Market opportunity by geography
        • Market opportunity by geography ($ million)
        • Data Tables on Market opportunity by geography ($ million)
      • 12.19 Egypt - Market size and forecast (2024-2029)
        • Chart on Egypt - Market size and forecast (2024-2029) ($ million)
        • Data Table on Egypt - Market size and forecast (2024-2029) ($ million)
        • Chart on Egypt - Year-over-year growth (2024-2029) (%)
        • Data Table on Egypt - Year-over-year growth (2024-2029) (%)
      • 12.20 UAE - Market size and forecast (2024-2029)
        • Chart on UAE - Market size and forecast (2024-2029) ($ million)
        • Data Table on UAE - Market size and forecast (2024-2029) ($ million)
        • Chart on UAE - Year-over-year growth (2024-2029) (%)
        • Data Table on UAE - Year-over-year growth (2024-2029) (%)
      • 12.21 Oman - Market size and forecast (2024-2029)
        • Chart on Oman - Market size and forecast (2024-2029) ($ million)
        • Data Table on Oman - Market size and forecast (2024-2029) ($ million)
        • Chart on Oman - Year-over-year growth (2024-2029) (%)
        • Data Table on Oman - Year-over-year growth (2024-2029) (%)
      • 12.22 Argentina - Market size and forecast (2024-2029)
        • Chart on Argentina - Market size and forecast (2024-2029) ($ million)
        • Data Table on Argentina - Market size and forecast (2024-2029) ($ million)
        • Chart on Argentina - Year-over-year growth (2024-2029) (%)
        • Data Table on Argentina - Year-over-year growth (2024-2029) (%)
      • 12.23 KSA - Market size and forecast (2024-2029)
        • Chart on KSA - Market size and forecast (2024-2029) ($ million)
        • Data Table on KSA - Market size and forecast (2024-2029) ($ million)
        • Chart on KSA - Year-over-year growth (2024-2029) (%)
        • Data Table on KSA - Year-over-year growth (2024-2029) (%)
      • 12.24 Rest of World (ROW) - Market size and forecast (2024-2029)
        • Chart on Rest of World (ROW) - Market size and forecast (2024-2029) ($ million)
        • Data Table on Rest of World (ROW) - Market size and forecast (2024-2029) ($ million)
        • Chart on Rest of World (ROW) - Year-over-year growth (2024-2029) (%)
        • Data Table on Rest of World (ROW) - Year-over-year growth (2024-2029) (%)

      13 Drivers, Challenges, and Opportunity/Restraints

      • 13.1 Market drivers
        • 13.2 Market challenges
          • 13.3 Impact of drivers and challenges
            • Impact of drivers and challenges in 2024 and 2029
          • 13.4 Market opportunities/restraints

            14 Competitive Landscape

            • 14.1 Overview
              • 14.2 Competitive Landscape
                • Overview on criticality of inputs and factors of differentiation
              • 14.3 Landscape disruption
                • Overview on factors of disruption
              • 14.4 Industry risks
                • Impact of key risks on business

              15 Competitive Analysis

              • 15.1 Companies profiled
                • Companies covered
              • 15.2 Company ranking index
                • Company ranking index
              • 15.3 Market positioning of companies
                • Matrix on companies position and classification
              • 15.4 Almora Magnesite Ltd.
                • Almora Magnesite Ltd. - Overview
                • Almora Magnesite Ltd. - Product / Service
                • Almora Magnesite Ltd. - Key offerings
                • SWOT
              • 15.5 Compagnie Financiere et de Participations Roullier
                • Compagnie Financiere et de Participations Roullier - Overview
                • Compagnie Financiere et de Participations Roullier - Product / Service
                • Compagnie Financiere et de Participations Roullier - Key news
                • Compagnie Financiere et de Participations Roullier - Key offerings
                • SWOT
              • 15.6 GRECIAN MAGNESITE SA
                • GRECIAN MAGNESITE SA - Overview
                • GRECIAN MAGNESITE SA - Product / Service
                • GRECIAN MAGNESITE SA - Key news
                • GRECIAN MAGNESITE SA - Key offerings
                • SWOT
              • 15.7 Haicheng Magnesite Group Co. Ltd.
                • Haicheng Magnesite Group Co. Ltd. - Overview
                • Haicheng Magnesite Group Co. Ltd. - Product / Service
                • Haicheng Magnesite Group Co. Ltd. - Key offerings
                • SWOT
              • 15.8 IBAR Group
                • IBAR Group - Overview
                • IBAR Group - Product / Service
                • IBAR Group - Key offerings
                • SWOT
              • 15.9 Iranian Refractories Procurement and Production Co.
                • Iranian Refractories Procurement and Production Co. - Overview
                • Iranian Refractories Procurement and Production Co. - Product / Service
                • Iranian Refractories Procurement and Production Co. - Key offerings
                • SWOT
              • 15.10 Korab Resources Ltd.
                • Korab Resources Ltd. - Overview
                • Korab Resources Ltd. - Product / Service
                • Korab Resources Ltd. - Key offerings
                • SWOT
              • 15.11 Kumas Manyezit Sanayi A S
                • Kumas Manyezit Sanayi A S - Overview
                • Kumas Manyezit Sanayi A S - Product / Service
                • Kumas Manyezit Sanayi A S - Key offerings
                • SWOT
              • 15.12 MGX Minerals Inc.
                • MGX Minerals Inc. - Overview
                • MGX Minerals Inc. - Product / Service
                • MGX Minerals Inc. - Key offerings
                • SWOT
              • 15.13 PD Refractories GmbH
                • PD Refractories GmbH - Overview
                • PD Refractories GmbH - Product / Service
                • PD Refractories GmbH - Key offerings
                • SWOT
              • 15.14 Premier Magnesia LLC
                • Premier Magnesia LLC - Overview
                • Premier Magnesia LLC - Product / Service
                • Premier Magnesia LLC - Key offerings
                • SWOT
              • 15.15 Ramakrishna Magnesite Mines
                • Ramakrishna Magnesite Mines - Overview
                • Ramakrishna Magnesite Mines - Product / Service
                • Ramakrishna Magnesite Mines - Key offerings
                • SWOT
              • 15.16 Refratechnik Holding GmbH
                • Refratechnik Holding GmbH - Overview
                • Refratechnik Holding GmbH - Product / Service
                • Refratechnik Holding GmbH - Key offerings
                • SWOT
              • 15.17 RHI Magnesita GmbH
                • RHI Magnesita GmbH - Overview
                • RHI Magnesita GmbH - Business segments
                • RHI Magnesita GmbH - Key news
                • RHI Magnesita GmbH - Key offerings
                • RHI Magnesita GmbH - Segment focus
                • SWOT
              • 15.18 Sri Ponkumar Magnesite Mines
                • Sri Ponkumar Magnesite Mines - Overview
                • Sri Ponkumar Magnesite Mines - Product / Service
                • Sri Ponkumar Magnesite Mines - Key offerings
                • SWOT

              16 Appendix

              • 16.1 Scope of the report
                • 16.2 Inclusions and exclusions checklist
                  • Inclusions checklist
                  • Exclusions checklist
                • 16.3 Currency conversion rates for US$
                  • Currency conversion rates for US$
                • 16.4 Research methodology
                  • Research methodology
                • 16.5 Data procurement
                  • Information sources
                • 16.6 Data validation
                  • Data validation
                • 16.7 Validation techniques employed for market sizing
                  • Validation techniques employed for market sizing
                • 16.8 Data synthesis
                  • Data synthesis
                • 16.9 360 degree market analysis
                  • 360 degree market analysis
                • 16.10 List of abbreviations
                  • List of abbreviations

                Research Methodology

                Technavio presents a detailed picture of the market by way of study, synthesis, and summation of data from multiple sources. The analysts have presented the various facets of the market with a particular focus on identifying the key industry influencers. The data thus presented is comprehensive, reliable, and the result of extensive research, both primary and secondary.

                INFORMATION SOURCES

                Primary sources

                • Manufacturers and suppliers
                • Channel partners
                • Industry experts
                • Strategic decision makers

                Secondary sources

                • Industry journals and periodicals
                • Government data
                • Financial reports of key industry players
                • Historical data
                • Press releases

                DATA ANALYSIS

                Data Synthesis

                • Collation of data
                • Estimation of key figures
                • Analysis of derived insights

                Data Validation

                • Triangulation with data models
                • Reference against proprietary databases
                • Corroboration with industry experts

                REPORT WRITING

                Qualitative

                • Market drivers
                • Market challenges
                • Market trends
                • Five forces analysis

                Quantitative

                • Market size and forecast
                • Market segmentation
                • Geographical insights
                • Competitive landscape

                Interested in this report?

                Get your sample now to see our research methodology and insights!

                Download Now

                Frequently Asked Questions

                Magnesite market growth will increase by $ 3410 mn during 2025-2029.

                The Magnesite market is expected to grow at a CAGR of 5.9% during 2025-2029.

                Magnesite market is segmented by Product( Magnesite ore, Dead burned magnesia, Fused magnesia) Application( Refractory, Steel Production, Construction, Environmental Applications, MEA)

                Almora Magnesite Ltd., Compagnie Financiere et de Participations Roullier, Galaxy Enterprise, GRECIAN MAGNESITE SA, Haicheng Magnesite Group Co. Ltd., IBAR Group, Iranian Refractories Procurement and Production Co., Konoshima Chemical Co. Ltd., Korab Resources Ltd., Kumas Manyezit Sanayi A S, MGX Minerals Inc., PD Refractories GmbH, Premier Magnesia LLC, Ramakrishna Magnesite Mines, Refratechnik Holding GmbH, RHI Magnesita GmbH, SCR Sibelco NV, Sri Ponkumar Magnesite Mines, TANMAG, Tomra Systems ASA are a few of the key vendors in the Magnesite market.

                APAC will register the highest growth rate of 60% among the other regions. Therefore, the Magnesite market in APAC is expected to garner significant business opportunities for the vendors during the forecast period.

                US, Canada, Germany, UK, Italy, France, China, India, Japan, Brazil, Egypt, UAE, Oman, Argentina, KSA, UAE, Brazil, Rest of World (ROW)

                • Growing demand for refractories from steel industryMagnesite is the driving factor this market.
                • an effective refractory material is the driving factor this market.
                • can withstand extreme heat and thus is of major significance in industrial processes. The steel industry is the main end-user of refractory magnesia for refractory brick linings. The iron and steel industry accounts for two-thirds of the use of refractory at the global level. From coke ovens to blast furnaces is the driving factor this market.
                • refractories are important in manufacturing processes.The rapid industrialization and urbanization in the developed and developing nations present major growth opportunities for iron and steel manufacturers. Steel has wide applicability across the building and construction is the driving factor this market.
                • automotive and aviation is the driving factor this market.
                • and oil and gas industries across the globe. Steel casting is a method where liquified steel is poured into a mold made of sand or ceramic plater to create the desired shape. Thus is the driving factor this market.
                • the rapid growth in the steel casting market is expected to increase the demand for refractories (magnesite) during the forecast period is the driving factor this market.
                • thus driving the growth of the magnesite market. is the driving factor this market.

                The Magnesite market vendors should focus on grabbing business opportunities from the Magnesite ore segment as it accounted for the largest market share in the base year.