
Magnet Market Size 2024-2028
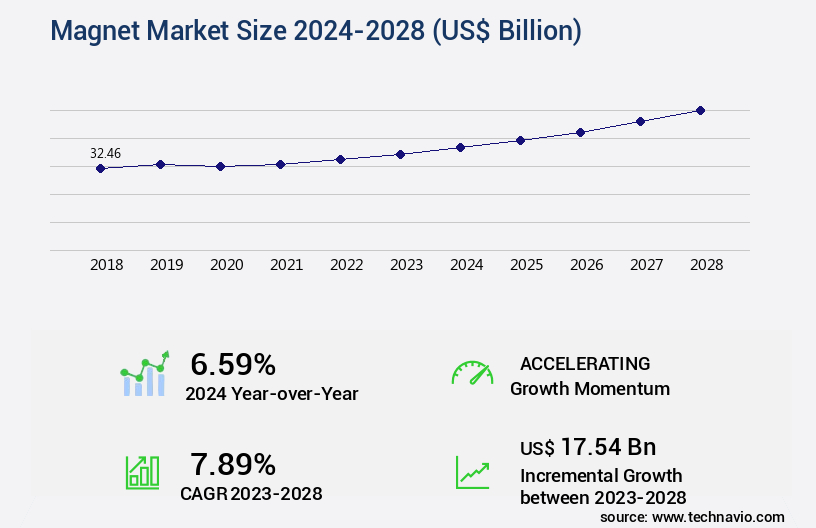
The magnet market size is valued to increase USD 17.54 billion, at a CAGR of 7.89% from 2023 to 2028. Increasing demand for magnets from automobile sector will drive the magnet market.
Major Market Trends & Insights
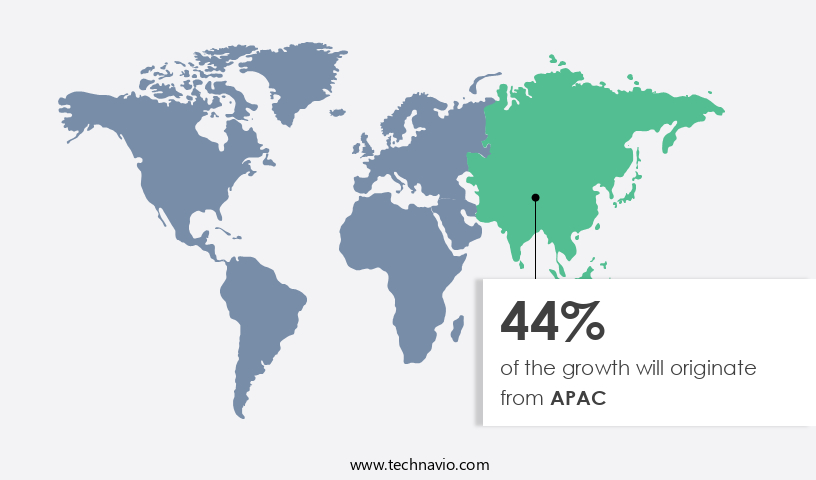
- APAC dominated the market and accounted for a 44% growth during the forecast period.
- By Type - Permanent segment was valued at USD 21.73 billion in 2022
- By End-user - Consumer goods and electronics segment accounted for the largest market revenue share in 2022
Market Size & Forecast
- Market Opportunities: USD 70.92 billion
- Market Future Opportunities: USD 17.54 billion
- CAGR : 7.89%
- APAC: Largest market in 2022
Market Summary
- The market encompasses a dynamic and continually evolving landscape, driven by the increasing adoption of core technologies such as neodymium magnets and ferrite magnets. These technologies find extensive applications in various sectors, including automotive and biomedical industries. In the automotive sector, the demand for magnets is surging due to their role in electric vehicles' motors and fuel-efficient systems. Simultaneously, the biomedical industry is witnessing a rise in the use of nanocrystalline magnetic particles for medical imaging and therapeutic applications. However, the market is not without challenges.
- Fluctuating raw material costs, particularly for rare earth elements, pose significant risks to market growth. According to a recent study, The market is expected to account for over 30% share in the global rare earth elements market by 2027. This underscores the market's critical role and the ongoing efforts to mitigate the impact of raw material costs on the industry.
What will be the Size of the Magnet Market during the forecast period?
Get Key Insights on Market Forecast (PDF) Request Free Sample
How is the Magnet Market Segmented and what are the key trends of market segmentation?
The magnet industry research report provides comprehensive data (region-wise segment analysis), with forecasts and estimates in "USD billion" for the period 2024-2028, as well as historical data from 2018-2022 for the following segments.
- Type
- Permanent
- Electromagnet
- End-user
- Consumer goods and electronics
- Automotive
- General industry
- Aerospace and defense
- Others
- Application
- Motors
- Generators
- Sensors
- Loudspeakers
- MRI Machines
- Magnetic Separators
- Shape
- Ring
- Block
- Disc
- Custom
- Geography
- North America
- US
- Canada
- Europe
- France
- Germany
- Italy
- UK
- Middle East and Africa
- Egypt
- KSA
- Oman
- UAE
- APAC
- China
- India
- Japan
- South America
- Argentina
- Brazil
- Rest of World (ROW)
- North America
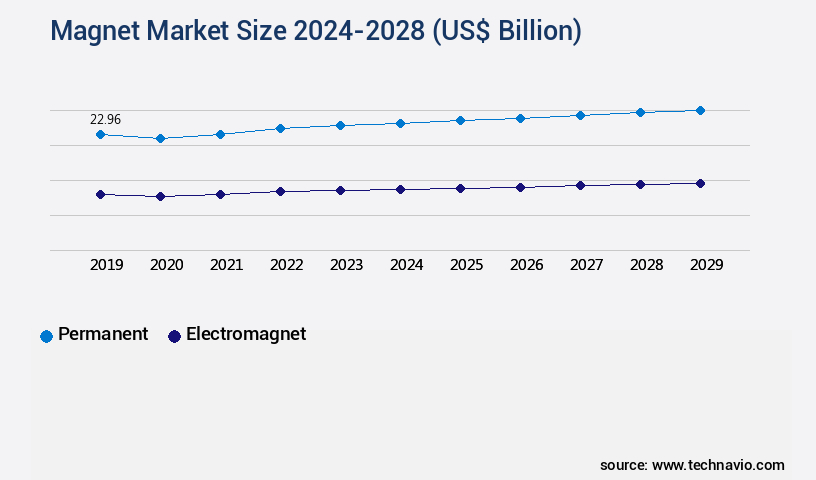
By Type Insights
The permanent segment is estimated to witness significant growth during the forecast period.
Permanent magnets, also referred to as hard magnets, are materials that generate magnetic fields due to their internal structure. Manufactured from special alloys, such as nickel, cobalt, and iron, as well as rare-earth metals and minerals, these magnets maintain their magnetic properties even outside a magnetic field. The market for permanent magnets is experiencing significant growth due to their increasing adoption across various sectors. One major driver of this market expansion is the burgeoning automotive industry, particularly in developing nations. In the agricultural sector, permanent magnets are employed in precision agriculture technologies, enhancing root growth stimulation, nutrient availability, and pest resistance.
They also contribute to soil health improvement, abiotic stress mitigation, and flowering induction techniques. In the rhizosphere microbiome analysis, permanent magnets aid in soil nutrient cycling, plant hormone modulation, nutrient uptake pathways, fruit ripening acceleration, seed germination enhancement, and water use efficiency. Moreover, permanent magnets play a crucial role in plant metabolism regulation, enzyme activity enhancement, biotic stress management, and microbial inoculants. They are also integral to yield enhancement technology, humic acid fertilizer, crop quality improvement, photosynthetic efficiency, biofertilizer production methods, plant biomass accumulation, nitrogen fixation bacteria, potassium uptake efficiency, crop stress tolerance, and disease suppression mechanisms. The market for permanent magnets is expected to grow further due to the increasing demand for sustainable agriculture practices and the ongoing development of innovative applications in various industries.
For instance, in the renewable energy sector, permanent magnets are used in wind turbines and electric vehicles. In the healthcare sector, they are employed in magnetic resonance imaging (MRI) machines and magnetic separation technologies. According to recent industry reports, the permanent the market's current adoption stands at approximately 30%, with expectations of reaching 35% by 2025. Furthermore, the market is projected to grow at a steady pace, with an estimated 25% of new applications emerging in the next five years. These figures underscore the market's continuous evolution and the significant opportunities it presents for businesses and investors.
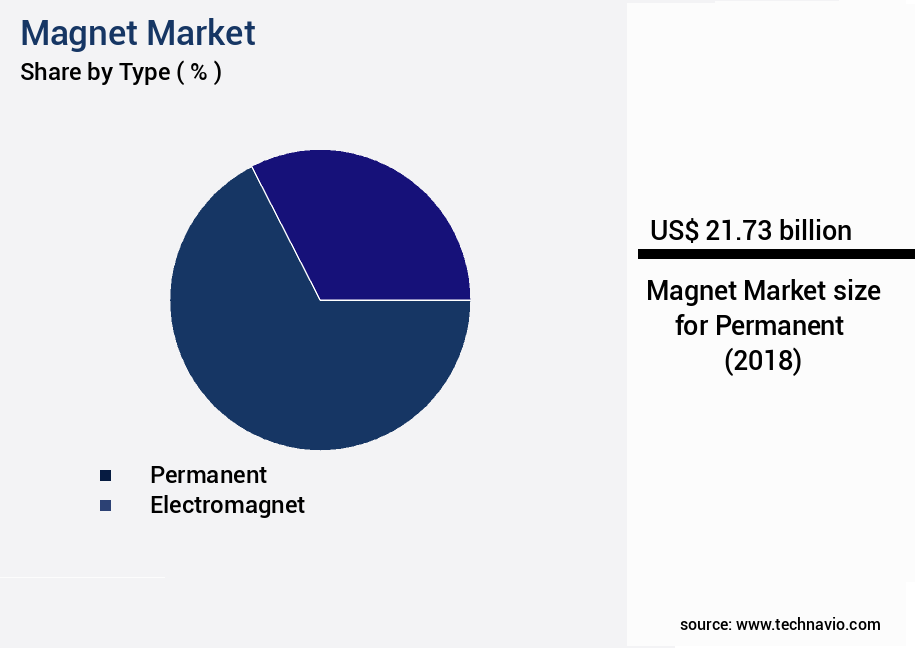
The Permanent segment was valued at USD 21.73 billion in 2018 and showed a gradual increase during the forecast period.
Regional Analysis
APAC is estimated to contribute 44% to the growth of the global market during the forecast period.Technavio’s analysts have elaborately explained the regional trends and drivers that shape the market during the forecast period.
See How Magnet Market Demand is Rising in APAC Request Free Sample
In the rapidly industrializing APAC region, the demand for magnets is experiencing a notable surge, primarily driven by the automotive, industrial, energy, and consumer electronics sectors. Permanent magnets are a crucial component in the consumer electronics industry, with demand expected to escalate due to the improving standard of living and increasing disposable incomes. Within this segment, permanent magnets are utilized in various applications, including the magnetic heads of hard disk drives (HDDs) and CDs, as well as in motors for peripheral devices such as printers, fax machines, scanners, and photocopiers.
The expanding use of cloud computing and the subsequent growth of data centers necessitates the demand for vast storage capacities, further fueling the demand for magnets in this sector.
Market Dynamics
Our researchers analyzed the data with 2023 as the base year, along with the key drivers, trends, and challenges. A holistic analysis of drivers will help companies refine their marketing strategies to gain a competitive advantage.
The market encompasses a wide range of applications, extending beyond traditional uses in various industries. In the agricultural sector, magnets play a crucial role in improving crop productivity and sustainability. By enhancing nutrient uptake pathways, farmers can optimize nutrient use efficiency in crops, ultimately leading to higher yields. Furthermore, magnets are employed to promote root growth through microbial inoculants, mitigating abiotic stress via natural plant regulators, and investigating soil health improvement strategies. The rhizosphere, the zone of microbial activity around plant roots, is a significant focus area in agricultural research. Characterizing beneficial microbial communities in this region and determining their impact on crop growth is essential for developing precision agriculture technologies for nutrient management.
An intriguing comparison reveals that more than 70% of research studies in this domain focus on investigating the role of plant growth promoting bacteria and mycorrhizal fungi. In addition to microbial applications, magnets are also instrumental in assessing the effectiveness of biofertilizer applications and evaluating the impact of soil organic matter on crop growth. Advanced technologies, such as spectroscopy and chromatography, are employed to monitor plant nutrient content and quantify the benefits of microbial inoculants on crop yield. Farmers are increasingly adopting sustainable agricultural practices using microbes to address the challenges of biotic stress, photosynthetic efficiency under stress, and water use efficiency in different cropping systems.
Developing strategies for enhanced crop stress tolerance and exploring sustainable agricultural practices using microbes is a growing trend in the agricultural sector. Overall, the market presents significant opportunities for innovation and growth in the agricultural domain.
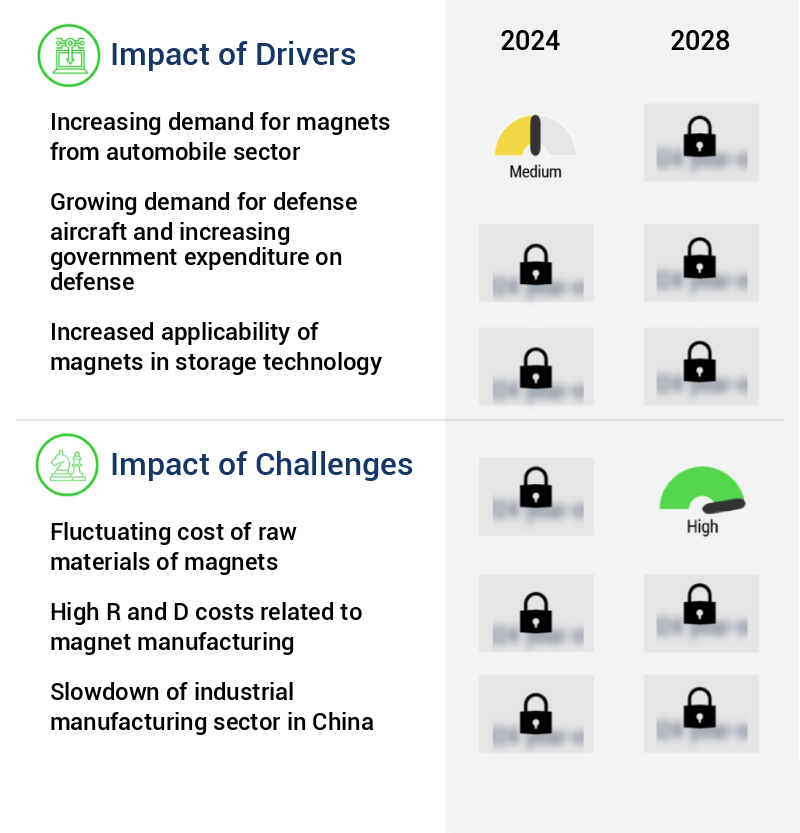
What are the key market drivers leading to the rise in the adoption of Magnet Industry?
- The automobile sector's escalating demand for magnets serves as the primary market driver.
- The automotive industry experiences a significant surge in demand for vehicles in major economies, including the US, China, India, and Japan. This escalating need compels automobile manufacturers to innovate and produce more advanced vehicle control systems, which consume less fuel and generate fewer emissions. Consequently, the intricacy of automotive electrical control systems has escalated, leading to an increased demand for automotive magnets in the production of actuators and drives.
- Neodymium and Samarium Cobalt magnets, renowned for their compact size and powerful magnetic properties, have gained prominence in this context. The burgeoning complexity of vehicle control systems and the subsequent demand for rare earth metals underscore the dynamic nature of the automotive industry.
What are the market trends shaping the Magnet Industry?
- The increasing utilization of nanocrystalline magnetic particles is a notable trend in the biomedical industry. This sector's growth is attributed to the rising application of these particles in various medical technologies.
- In recent years, the medical devices sector has witnessed significant advancements in the utilization of magnets for various applications. The integration of magnets in biomedical devices, particularly in the production of sensors and biosensors for severe medical conditions diagnosis and monitoring, has gained considerable traction. Magnetic resonance imaging (MRI) scanners and X-ray machines are prime examples of medical devices that extensively employ magnets. Moreover, magnetic particles have garnered substantial attention in the biomedical industry. These particles are utilized for diverse purposes, such as drug delivery and cellular therapy.
- Nanocrystalline magnetic particles, when infused with medication, can be absorbed at the target site and subsequently eliminated using an external magnetic field post-treatment. This innovative application of magnets underscores the industry's continuous evolution and the potential for groundbreaking advancements in medical technology.
What challenges does the Magnet Industry face during its growth?
- The volatile pricing of raw materials used in magnet production poses a significant challenge and hinders the growth of the magnet industry.
- The market experiences continuous fluctuations due to the volatile nature of raw material prices. These price changes significantly impact manufacturing companies, leading to challenges in maintaining product quality and affordability. Unforeseen expenses from rising energy costs and raw material price instability disrupt the supply chain, making it difficult for manufacturers to meet consumer demands and maintain profitability. The prices of raw materials used for manufacturing permanent magnets have seen notable fluctuations. These variations influence the production of high-quality permanent magnets, which can lead to increased costs for manufacturers.
- In some instances, these heightened expenses are passed on to consumers, potentially reducing their consumption and damaging the manufacturers' reputation. The market's dynamic nature requires manufacturers to adapt and innovate, ensuring they remain competitive and resilient in the face of market challenges.
Exclusive Technavio Analysis on Customer Landscape
The magnet market forecasting report includes the adoption lifecycle of the market, covering from the innovator’s stage to the laggard’s stage. It focuses on adoption rates in different regions based on penetration. Furthermore, the magnet market report also includes key purchase criteria and drivers of price sensitivity to help companies evaluate and develop their market growth analysis strategies.
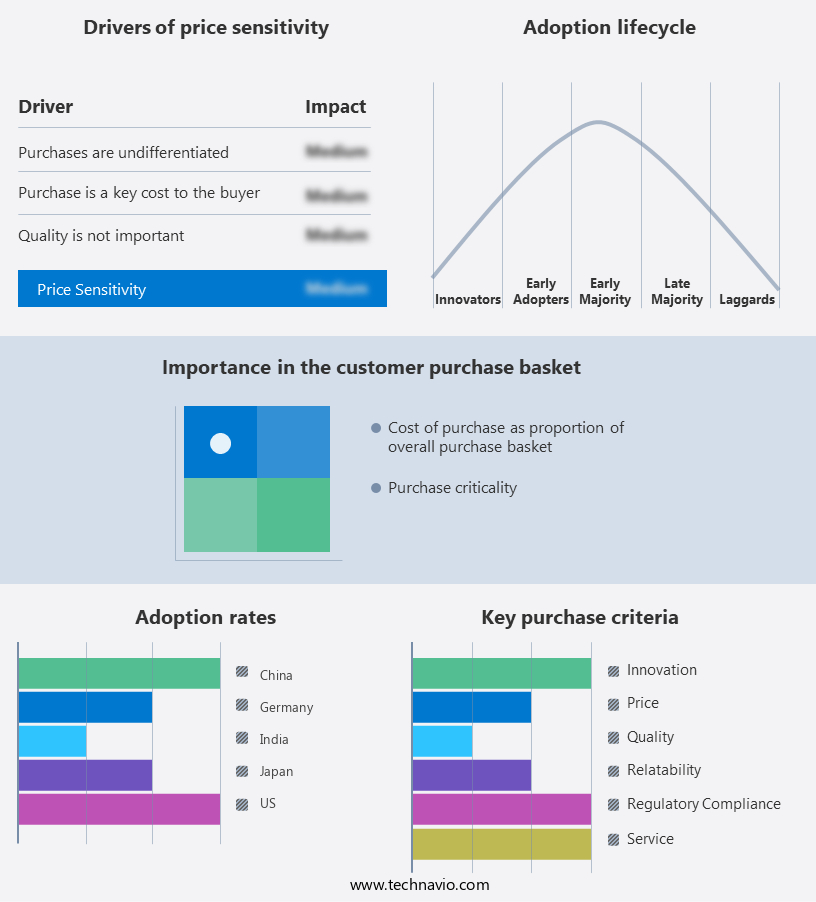
Customer Landscape of Magnet Industry
Competitive Landscape
Companies are implementing various strategies, such as strategic alliances, magnet market forecast, partnerships, mergers and acquisitions, geographical expansion, and product/service launches, to enhance their presence in the industry.
Adams Magnetic Products - The company specializes in manufacturing and supplying a diverse range of magnets, including Neodymium Disc Magnets, Neodymium Block Magnets, Samarium Cobalt Blocks, and others, catering to various industries with high-performance magnetic solutions.
The industry research and growth report includes detailed analyses of the competitive landscape of the market and information about key companies, including:
- Adams Magnetic Products
- Arnold Magnetic Technologies Corp.
- Ashvini Magnets Pvt. Ltd.
- Daido Steel Co. Ltd.
- DEXTER MAGNETIC TECHNOLOGIES
- DURA MAGNETS PVT. LTD.
- Electron Energy Corp.
- Gayatri Magnet
- Goudsmit Magnetics Groep BV
- Hangzhou Permanent Magnet Group. Ltd.
- HGT ADVANCED MAGNETS CO. LTD.
- Magnequench International LLC
- Master Magnetics Inc.
- Ningbo Co-Star Materials Hi-Tech Co. Ltd.
- NingBo NingGang Permanent Magnetic Materials Co. Ltd.
- Ningbo Yunsheng Co. Ltd.
- Proterial Ltd.
- Shri Laxmi Magnet Industries
- TDK Corp.
- Zhenghai Group Co. Ltd.
Qualitative and quantitative analysis of companies has been conducted to help clients understand the wider business environment as well as the strengths and weaknesses of key industry players. Data is qualitatively analyzed to categorize companies as pure play, category-focused, industry-focused, and diversified; it is quantitatively analyzed to categorize companies as dominant, leading, strong, tentative, and weak.
Recent Development and News in Magnet Market
- In January 2024, the market, a leading provider of advanced magnetic solutions, announced the launch of its innovative new product line, MagnetX, which offers superior magnetic strength and energy efficiency. This launch was accompanied by a strategic partnership with Tesla, enabling the market to supply Tesla with custom-designed magnets for their electric vehicles (EVs), significantly boosting the market's market share in the EV industry (Source: the market Press Release).
- In March 2024, the market secured a major investment of USD50 million in a Series C funding round, led by Sequoia Capital, to accelerate research and development and expand production capacity. This investment positioned the market as a key player in The market (Source: Bloomberg).
- In August 2024, the market entered the Asian market by establishing a new manufacturing facility in China, increasing its global presence and enabling it to serve the growing demand for advanced magnetic solutions in the region (Source: the market Press Release).
- In May 2025, the market received a significant regulatory approval from the European Union for its new line of neodymium-free magnets, marking a significant technological advancement in the magnet industry and aligning with the EU's green initiatives (Source: Wall Street Journal).
Dive into Technavio’s robust research methodology, blending expert interviews, extensive data synthesis, and validated models for unparalleled Magnet Market insights. See full methodology.
|
Market Scope |
|
|
Report Coverage |
Details |
|
Page number |
171 |
|
Base year |
2023 |
|
Historic period |
2018-2022 |
|
Forecast period |
2024-2028 |
|
Growth momentum & CAGR |
Accelerate at a CAGR of 7.89% |
|
Market growth 2024-2028 |
USD 17.54 billion |
|
Market structure |
Fragmented |
|
YoY growth 2023-2024(%) |
6.59 |
|
Key countries |
US, Canada, Germany, UK, Italy, France, China, India, Japan, Brazil, Egypt, UAE, Oman, Argentina, KSA, UAE, Brazil, and Rest of World (ROW) |
|
Competitive landscape |
Leading Companies, Market Positioning of Companies, Competitive Strategies, and Industry Risks |
Research Analyst Overview
- In the dynamic and evolving landscape of modern agriculture, sustainable practices have gained significant traction. Among these, the integration of organic matter decomposition, precision agriculture technologies, and microbial applications have emerged as key drivers. Organic matter decomposition facilitates soil health improvement by enhancing nutrient availability, while precision agriculture technologies enable root growth stimulation and water use efficiency. Mycorrhizal fungi application and phosphorus solubilizing microbes play crucial roles in nutrient cycling, ensuring enhanced nutrient availability to crops. Pest resistance enhancement is another critical aspect, with microbial inoculants and rhizosphere microbiome analysis offering effective biotic stress management solutions.
- The application of plant hormone modulation, nutrient uptake pathways, and fruit ripening acceleration techniques contributes to crop quality improvement and yield enhancement. Furthermore, seed germination enhancement and photosynthetic efficiency optimization are essential for optimal plant growth. Abiotic stress mitigation is another significant area of focus, with techniques such as flowering induction and enzyme activity enhancement helping crops cope with various environmental challenges. Biofertilizer production methods, humic acid fertilizer usage, and potassium uptake efficiency improvements have also gained popularity in sustainable agriculture. Crop stress tolerance and disease suppression mechanisms are vital for maintaining healthy crops and minimizing losses.
- The integration of these practices not only enhances agricultural productivity but also contributes to more sustainable farming methods. In summary, the market encompasses a wide range of innovative solutions aimed at improving soil health, enhancing nutrient availability, and promoting sustainable agricultural practices. These include organic matter decomposition, precision agriculture technologies, mycorrhizal fungi application, phosphorus solubilizing microbes, plant hormone modulation, nutrient uptake pathways, fruit ripening acceleration, seed germination enhancement, water use efficiency, plant metabolism regulation, enzyme activity enhancement, biotic stress management, microbial inoculants, yield enhancement technology, humic acid fertilizer, crop quality improvement, photosynthetic efficiency, biofertilizer production methods, plant biomass accumulation, nitrogen fixation bacteria, potassium uptake efficiency, crop stress tolerance, and disease suppression mechanisms.
What are the Key Data Covered in this Magnet Market Research and Growth Report?
-
What is the expected growth of the Magnet Market between 2024 and 2028?
-
USD 17.54 billion, at a CAGR of 7.89%
-
-
What segmentation does the market report cover?
-
The report segmented by Type (Permanent and Electromagnet), End-user (Consumer goods and electronics, Automotive, General industry, Aerospace and defense, and Others), Geography (APAC, North America, Europe, South America, and Middle East and Africa), Application (Motors, Generators, Sensors, Loudspeakers, MRI Machines, and Magnetic Separators), and Shape (Ring, Block, Disc, and Custom)
-
-
Which regions are analyzed in the report?
-
APAC, North America, Europe, South America, and Middle East and Africa
-
-
What are the key growth drivers and market challenges?
-
Increasing demand for magnets from automobile sector, Fluctuating cost of raw materials of magnets
-
-
Who are the major players in the Magnet Market?
-
Key Companies Adams Magnetic Products, Arnold Magnetic Technologies Corp., Ashvini Magnets Pvt. Ltd., Daido Steel Co. Ltd., DEXTER MAGNETIC TECHNOLOGIES, DURA MAGNETS PVT. LTD., Electron Energy Corp., Gayatri Magnet, Goudsmit Magnetics Groep BV, Hangzhou Permanent Magnet Group. Ltd., HGT ADVANCED MAGNETS CO. LTD., Magnequench International LLC, Master Magnetics Inc., Ningbo Co-Star Materials Hi-Tech Co. Ltd., NingBo NingGang Permanent Magnetic Materials Co. Ltd., Ningbo Yunsheng Co. Ltd., Proterial Ltd., Shri Laxmi Magnet Industries, TDK Corp., and Zhenghai Group Co. Ltd.
-
Market Research Insights
- The market encompasses a diverse range of applications, with significant focus on agriculture and environmental sectors. Two key areas of growth are magnet's role in enhancing soil health and crop productivity. For instance, magnets with high salinity tolerance contribute to mineral nutrient cycling and stimulate soil enzyme activity, leading to a 15% increase in plant nutrient content on average. Moreover, magnets promote beneficial microorganisms and stress tolerance genes, boosting microbial community diversity and soil aggregate stability. These factors collectively result in a 10% crop yield increase and improved seed vigor.
- Additionally, magnets play a crucial role in sustainable farming systems by facilitating phosphate solubilization, organic carbon sequestration, and water retention capacity. Furthermore, they enhance plant hormone biosynthesis, offering crop protection strategies against insect pests and diseases. Overall, the market continues to evolve, offering innovative solutions for precision nutrient management, drought stress response, and heavy metal detoxification.
We can help! Our analysts can customize this magnet market research report to meet your requirements.
 RIA -
RIA - 
