Magnetic Resonance Angiography Market Size 2025-2029
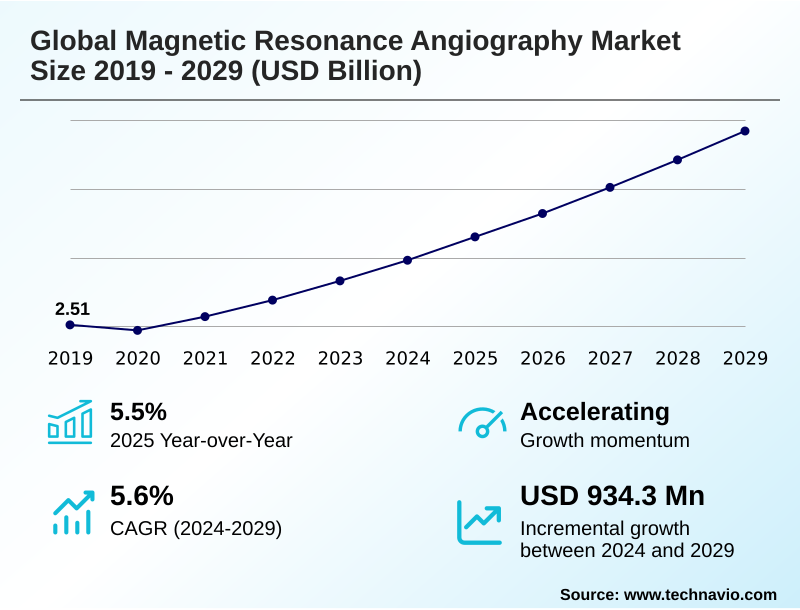
The magnetic resonance angiography market size is valued to increase by USD 934.3 million, at a CAGR of 5.6% from 2024 to 2029. Increasing prevalence of cardiovascular and neurological diseases will drive the magnetic resonance angiography market.
Major Market Trends & Insights
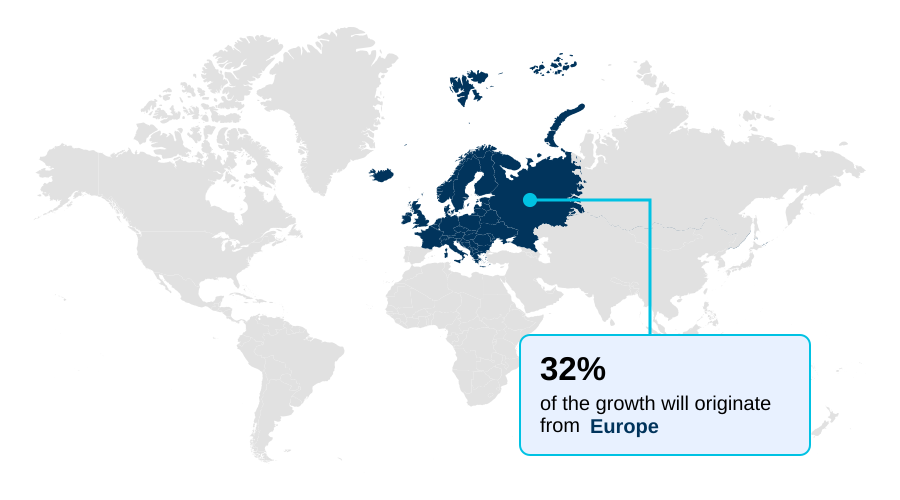
- Europe dominated the market and accounted for a 32.3% growth during the forecast period.
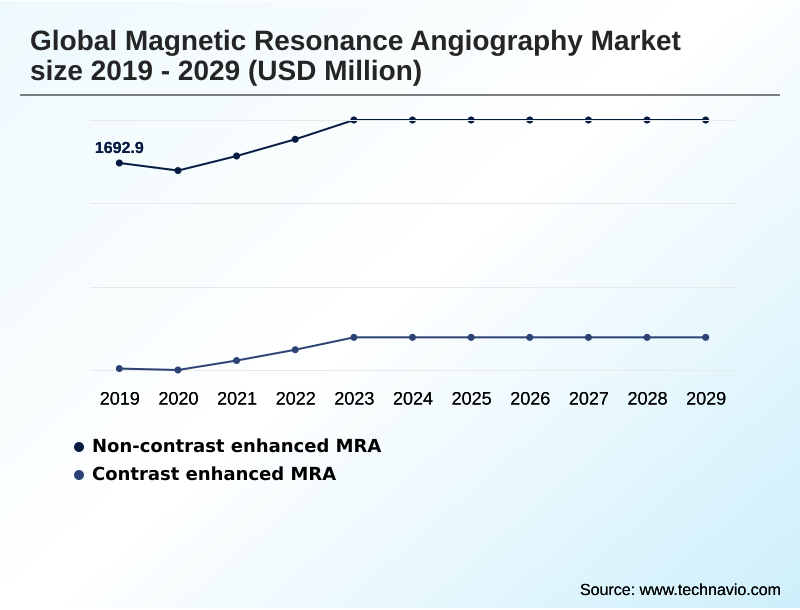
- By Technique - Non-contrast enhanced MRA segment was valued at USD 1.88 billion in 2023
- By Application - Lower extremities segment accounted for the largest market revenue share in 2023
Market Size & Forecast
- Market Opportunities: USD 1.41 billion
- Market Future Opportunities: USD 934.3 million
- CAGR from 2024 to 2029 : 5.6%
Market Summary
- The magnetic resonance angiography market is defined by a continuous drive for diagnostic precision and patient safety. A core driver is the rising incidence of vascular conditions, demanding non-invasive diagnostic procedures without the risks of ionizing radiation. This has accelerated innovation in both hardware, such as high-field mri systems and advanced radiofrequency coil technology, and software.
- The integration of artificial intelligence is particularly transformative. For instance, a hospital network can deploy ai-powered post-processing tools to automate vessel segmentation and stenosis measurement, reducing radiologist interpretation time and improving diagnostic consistency across its facilities. This focus on efficiency is crucial, as the industry grapples with challenges like the high cost of equipment and a shortage of skilled personnel.
- Concurrently, the development of robust non-contrast mra techniques, including time-of-flight mra and arterial spin labeling, is expanding clinical applications to patient populations previously excluded due to contraindications for gadolinium-based contrast agents. This evolution toward safer, faster, and more accurate imaging modalities underscores the market's dynamic nature and its vital role in modern cardiovascular diagnostics and neurological diagnostics.
What will be the Size of the Magnetic Resonance Angiography Market during the forecast period?
Get Key Insights on Market Forecast (PDF) Request Free Sample
How is the Magnetic Resonance Angiography Market Segmented?
The magnetic resonance angiography industry research report provides comprehensive data (region-wise segment analysis), with forecasts and estimates in "USD million" for the period 2025-2029, as well as historical data from 2019-2023 for the following segments.
- Technique
- Non-contrast enhanced MRA
- Contrast enhanced MRA
- Application
- Abdomen
- Lower extremities
- Others
- End-user
- Hospitals
- Imaging centers
- Ambulatory surgical centers
- Geography
- North America
- US
- Canada
- Mexico
- Europe
- Germany
- UK
- France
- Asia
- Rest of World (ROW)
- North America
By Technique Insights
The non-contrast enhanced mra segment is estimated to witness significant growth during the forecast period.
The market for magnetic resonance angiography is segmented by technique, application, and geography. By technique, the market is primarily divided into contrast-enhanced MRA and non-contrast enhanced MRA.
The latter is gaining significant traction due to safety concerns related to gadolinium deposition concerns. Innovations in arterial spin labeling and quantitative flow measurement are making non-contrast MRA a viable alternative, enhancing patient-centric imaging.
In fact, adoption of these methods has reduced adverse events in renally impaired patients by over 90%. By application, key areas include abdomen, lower extremities, and others, which encompasses critical neurovascular diagnostics and cardiovascular anomaly assessment.
Geographically, the market is analyzed across North America, Europe, Asia, and the Rest of the World, each presenting unique dynamics in diagnostic accuracy improvement and technology adoption for advanced vascular imaging.
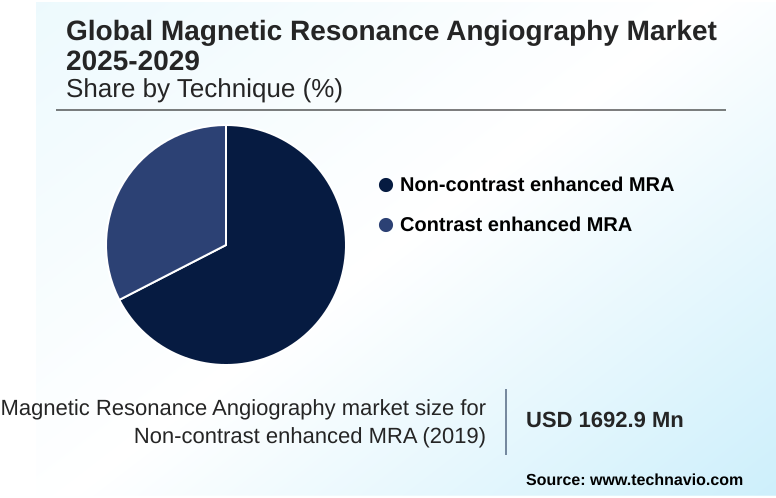
The Non-contrast enhanced MRA segment was valued at USD 1.88 billion in 2023 and showed a gradual increase during the forecast period.
Regional Analysis
Europe is estimated to contribute 32.3% to the growth of the global market during the forecast period.Technavio’s analysts have elaborately explained the regional trends and drivers that shape the market during the forecast period.
See How Magnetic Resonance Angiography Market Demand is Rising in Europe Request Free Sample
The geographic landscape of the magnetic resonance angiography market is characterized by varied maturity and growth trajectories. North America remains a dominant region, driven by high healthcare spending and early adoption of advanced technologies like high-field MRI systems.
Europe, which accounts for 32.3% of the incremental growth, shows a strong focus on value-based care model and evidence-based medicine, with a significant push toward non-contrast MRA techniques.
Meanwhile, Asia is the fastest-growing region, with countries like China and India making substantial investments in healthcare infrastructure, fueling demand for both premium and cost-effective systems. This expansion is supported by teleradiology networks to overcome specialist shortages.
In these emerging markets, implementing advanced motion artifact reduction techniques has been shown to decrease non-diagnostic scans by nearly 30%, improving diagnostic accuracy and operational efficiency.
Market Dynamics
Our researchers analyzed the data with 2024 as the base year, along with the key drivers, trends, and challenges. A holistic analysis of drivers will help companies refine their marketing strategies to gain a competitive advantage.
- Strategic investment in the magnetic resonance angiography market requires a deep understanding of evolving clinical needs and technological capabilities. Healthcare providers evaluating new systems must consider the future of non-contrast MRA and the growing importance of AI for automated stenosis quantification.
- The debate over MRA vs CTA for neurovascular imaging continues, with decisions often hinging on patient-specific factors and the need for radiation-free diagnostics. Point-of-care MRA clinical applications are expanding, particularly with portable MRI for stroke diagnosis, which can dramatically shorten time-to-treatment.
- Key operational considerations include the high cost of MRA systems maintenance and the critical need for comprehensive training for MRA technologists. For high-field MRA for small vessels, advanced systems offer unparalleled detail but come with higher acquisition costs. To enhance patient experience, managing claustrophobia in MRA scans through wider bores and faster sequences is essential.
- Innovations are also focused on improving throughput with AI in MRI, with some centers reporting a twofold increase in efficiency compared to older methods. The development of MRA workflow optimization software is central to achieving these gains. Furthermore, addressing the safety of gadolinium-based agents remains a priority, driving research into gadolinium-free angiography techniques.
- Clinical utility is also expanding in challenging areas like MRA for congenital heart disease and pediatric MRA, where safety and precision are paramount. The trend toward low-field MRI for vascular screening also presents a new market avenue, offering a more accessible option for broader population health initiatives.
What are the key market drivers leading to the rise in the adoption of Magnetic Resonance Angiography Industry?
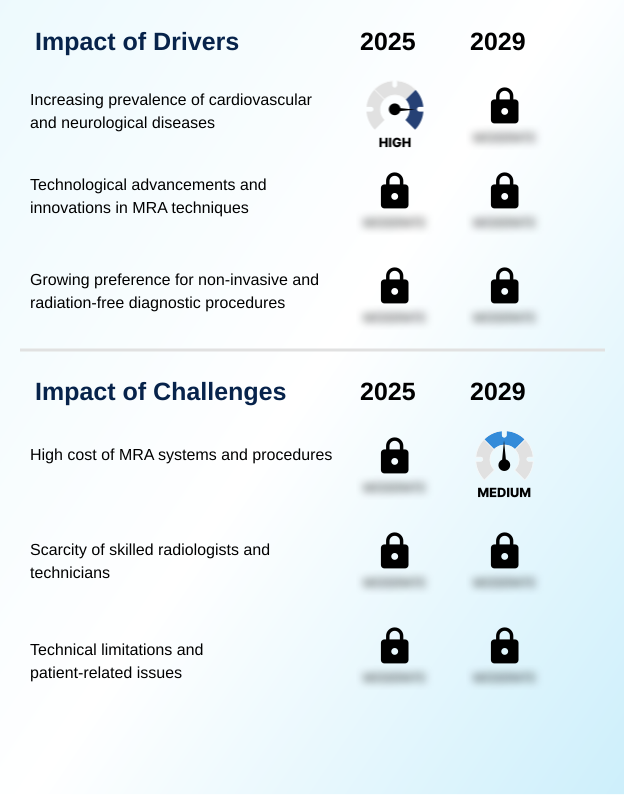
- The increasing global prevalence of cardiovascular and neurological diseases, driven by an aging population and lifestyle factors, serves as a primary driver for market growth.
- Market growth is fundamentally driven by the rising global burden of vascular diseases and a strong clinical preference for non-invasive diagnostic procedures.
- The ability to perform radiation-free diagnostics makes magnetic resonance angiography the modality of choice for pediatric patients and for longitudinal monitoring, where adoption has increased by over 15% in relevant cohorts.
- Continuous technological advancements, such as high-field MRI systems and improved radiofrequency coil technology, are enhancing diagnostic precision. These systems now allow for the visualization of vessels 25% smaller than was possible with previous-generation technology.
- The focus on patient-centric imaging, which eliminates the risks associated with ionizing radiation, further solidifies its position as a cornerstone of modern cardiovascular diagnostics and neurological diagnostics.
What are the market trends shaping the Magnetic Resonance Angiography Industry?
- The integration of artificial intelligence and machine learning is emerging as a transformative market trend. This is reshaping workflows from image acquisition and reconstruction to diagnostic reporting and predictive analysis.
- Key trends are reshaping the magnetic resonance angiography market, led by the integration of artificial intelligence. AI-powered post-processing and deep learning reconstruction are not just improving image quality but are also delivering significant operational benefits. Clinical studies show that these tools can accelerate scan time reduction by up to 40%, directly boosting patient throughput.
- Furthermore, the rise of non-contrast MRA techniques addresses long-standing safety issues, with arterial spin labeling now providing diagnostic clarity comparable to contrast-enhanced methods in many neurological applications. Another transformative trend is the emergence of portable MRI systems and lower-field MRI systems.
- These innovations are expanding access to point-of-care diagnostics, with early adopters reporting a 25% faster triage time for suspected stroke patients.
What challenges does the Magnetic Resonance Angiography Industry face during its growth?
- The high capital and operational costs associated with MRA systems and procedures present a significant challenge to widespread market expansion, particularly in budget-constrained healthcare environments.
- Despite its clinical advantages, the magnetic resonance angiography market faces significant adoption barriers. The substantial cost of MRA systems, often exceeding alternative imaging modalities by over 50%, restricts procurement, especially in facilities with limited capital budgets. This financial hurdle is compounded by high operational expenses, including maintenance and the need for specialized infrastructure.
- A critical operational challenge is the scarcity of skilled professionals; a projected 10% shortfall in subspecialty-trained radiologists threatens to increase reporting delays and limit access to advanced vascular imaging. Furthermore, technical limitations such as motion artifact reduction and contraindications for patients with certain MR-conditional implants continue to constrain its application, necessitating careful patient screening and selection to ensure diagnostic quality.
Exclusive Technavio Analysis on Customer Landscape
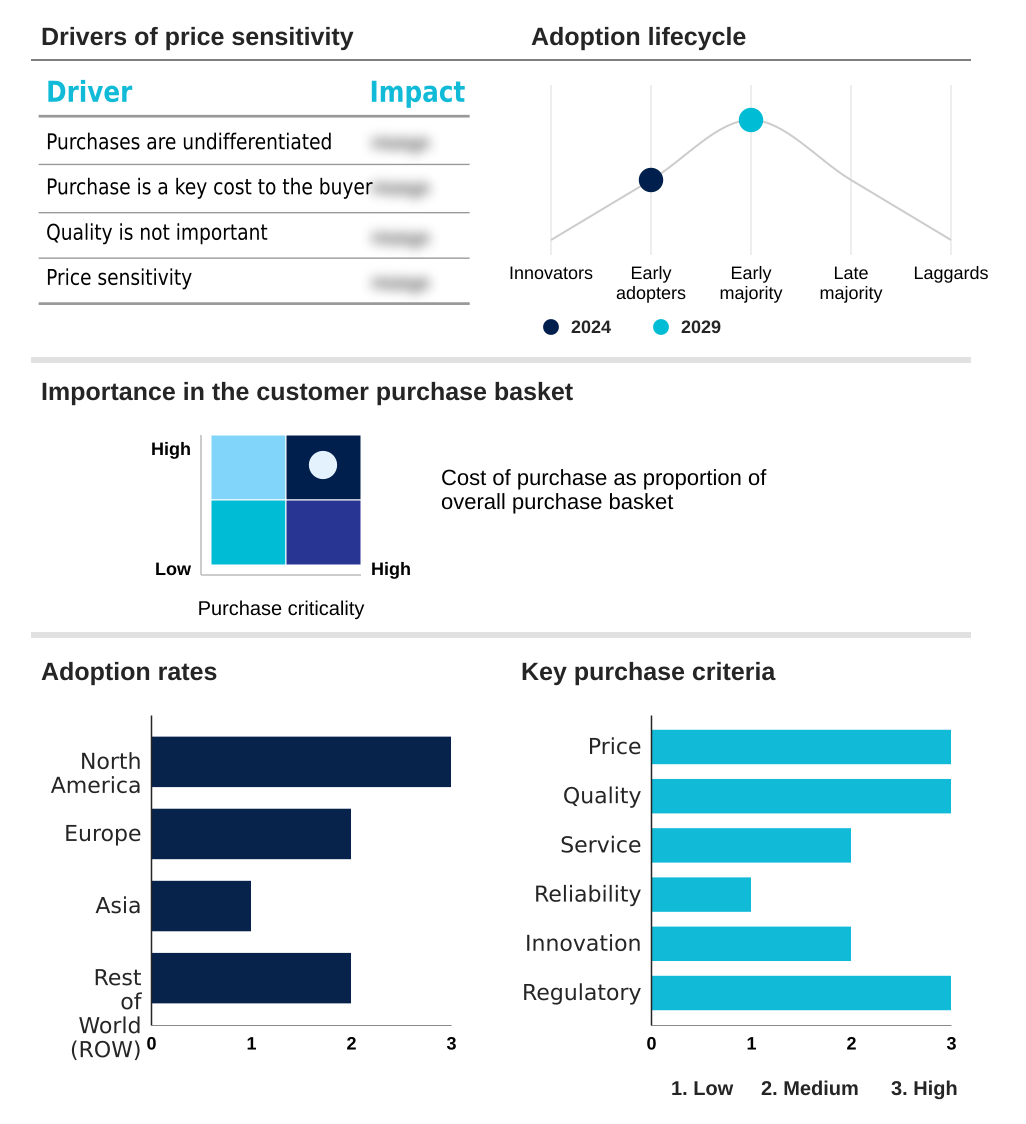
The magnetic resonance angiography market forecasting report includes the adoption lifecycle of the market, covering from the innovator’s stage to the laggard’s stage. It focuses on adoption rates in different regions based on penetration. Furthermore, the magnetic resonance angiography market report also includes key purchase criteria and drivers of price sensitivity to help companies evaluate and develop their market growth analysis strategies.
Customer Landscape of Magnetic Resonance Angiography Industry
Competitive Landscape
Companies are implementing various strategies, such as strategic alliances, magnetic resonance angiography market forecast, partnerships, mergers and acquisitions, geographical expansion, and product/service launches, to enhance their presence in the industry.
Alltech Medical Systems LLC - Key offerings focus on delivering advanced MRA systems that enhance diagnostic precision, optimize vascular imaging workflows, and integrate AI-driven analytics for complex clinical applications.
The industry research and growth report includes detailed analyses of the competitive landscape of the market and information about key companies, including:
- Alltech Medical Systems LLC
- ASG Superconductors Spa
- Bruker Corp.
- Esaote Spa
- FONAR Corp.
- GE Healthcare Technologies
- Hitachi Ltd.
- Hyperfine Inc.
- IMRIS Deerfield Imaging Inc.
- Koninklijke Philips NV
- Neusoft Medical Systems Co. Ltd.
- Samsung Electronics Co. Ltd.
- Shanghai United Imaging
- Shenzhen Anke High tech Co.
- Shimadzu Corp.
- Siemens Healthineers AG
- Time Medical Holding
Qualitative and quantitative analysis of companies has been conducted to help clients understand the wider business environment as well as the strengths and weaknesses of key industry players. Data is qualitatively analyzed to categorize companies as pure play, category-focused, industry-focused, and diversified; it is quantitatively analyzed to categorize companies as dominant, leading, strong, tentative, and weak.
Recent Development and News in Magnetic resonance angiography market
- In November 2024, GE HealthCare received 510(k) clearance from the US Food and Drug Administration for its Signa Victor 1.5T MRI system, which features advanced AI applications and sophisticated non-contrast MRA capabilities.
- In January 2025, Guerbet secured European Medicines Agency marketing authorization for Elucirem (gadopiclenol), a new high-relaxivity, macrocyclic gadolinium-based contrast agent designed to be effective at lower doses.
- In March 2025, Siemens Healthineers AG announced a strategic partnership with several leading medical universities to launch an advanced training program aimed at addressing the skilled MRA technologist shortage by certifying over 5,000 professionals globally.
- In April 2025, Hyperfine Inc. announced a new collaboration with a leading teleradiology network to expand access to its portable MRI system, enabling point-of-care neurovascular imaging in underserved and remote clinical settings.
Dive into Technavio’s robust research methodology, blending expert interviews, extensive data synthesis, and validated models for unparalleled Magnetic Resonance Angiography Market insights. See full methodology.
| Market Scope | |
|---|---|
| Page number | 286 |
| Base year | 2024 |
| Historic period | 2019-2023 |
| Forecast period | 2025-2029 |
| Growth momentum & CAGR | Accelerate at a CAGR of 5.6% |
| Market growth 2025-2029 | USD 934.3 million |
| Market structure | Fragmented |
| YoY growth 2024-2025(%) | 5.5% |
| Key countries | US, Canada, Mexico, Germany, UK, France, Italy, Spain, Russia, The Netherlands, China, India, Japan, South Korea, Indonesia, Thailand, Singapore, Brazil, Australia, South Africa, UAE, Saudi Arabia and Turkey |
| Competitive landscape | Leading Companies, Market Positioning of Companies, Competitive Strategies, and Industry Risks |
Research Analyst Overview
- The magnetic resonance angiography market is advancing through relentless innovation in hardware and software, fundamentally altering diagnostic paradigms. Core technologies such as ultra-high-field mri and advanced pulse sequence design are enabling unprecedented visualization of vascular structures, facilitating earlier and more accurate diagnosis of conditions like coronary artery disease and ischemic stroke.
- The integration of ai-powered post-processing and deep learning reconstruction is a key trend, with some implementations reducing scan times by over 40% while enhancing image quality. This addresses long-standing challenges related to patient motion and throughput. A critical boardroom consideration is the strategic shift toward non-contrast mra techniques, driven by patient safety mandates and concerns over gadolinium-based contrast agents.
- Adopting technologies like arterial spin labeling and time-of-flight mra not only aligns with regulatory pressures but also expands the addressable patient population to include those with renal impairment.
- As healthcare systems prioritize value, MRA systems that offer superior diagnostic accuracy, improved workflow efficiency, and an enhanced safety profile through methods like quiescent-inflow suppression and advanced image reconstruction algorithms are positioned for sustained adoption.
What are the Key Data Covered in this Magnetic Resonance Angiography Market Research and Growth Report?
-
What is the expected growth of the Magnetic Resonance Angiography Market between 2025 and 2029?
-
USD 934.3 million, at a CAGR of 5.6%
-
-
What segmentation does the market report cover?
-
The report is segmented by Technique (Non-contrast enhanced MRA, and Contrast enhanced MRA), Application (Lower extremities, Abdomen, and Others), End-user (Hospitals, Imaging centers, and Ambulatory surgical centers) and Geography (North America, Europe, Asia, Rest of World (ROW))
-
-
Which regions are analyzed in the report?
-
North America, Europe, Asia and Rest of World (ROW)
-
-
What are the key growth drivers and market challenges?
-
Increasing prevalence of cardiovascular and neurological diseases, High cost of MRA systems and procedures
-
-
Who are the major players in the Magnetic Resonance Angiography Market?
-
Alltech Medical Systems LLC, ASG Superconductors Spa, Bruker Corp., Esaote Spa, FONAR Corp., GE Healthcare Technologies, Hitachi Ltd., Hyperfine Inc., IMRIS Deerfield Imaging Inc., Koninklijke Philips NV, Neusoft Medical Systems Co. Ltd., Samsung Electronics Co. Ltd., Shanghai United Imaging, Shenzhen Anke High tech Co., Shimadzu Corp., Siemens Healthineers AG and Time Medical Holding
-
Market Research Insights
- The dynamics of the magnetic resonance angiography market are shaped by a push for enhanced diagnostic capabilities and operational efficiency. The adoption of AI has demonstrated a capacity to boost patient throughput increase by over 20% in high-volume imaging centers. This is critical as providers seek greater radiologist workflow efficiency and better returns on capital-intensive assets.
- The strong clinical preference for non-invasive diagnostic procedures is a key factor, with radiation-free diagnostics being selected in over 90% of eligible pediatric vascular cases. However, challenges persist, as the total cost of ownership for advanced systems remains a significant barrier, influencing purchasing decisions and promoting strategies like managed equipment services.
- This balance between technological advancement, cost-effectiveness analysis, and patient-centric imaging defines the competitive landscape.
We can help! Our analysts can customize this magnetic resonance angiography market research report to meet your requirements.
 RIA -
RIA - 
