
Managed IT Infrastructure Services Market Analysis, Size, and Forecast 2026-2030: North America (US, Canada, and Mexico), Europe (Germany, UK, and France), APAC (China, Japan, and India), South America (Brazil, Argentina, and Chile), Middle East and Africa (Saudi Arabia, UAE, and South Africa), and Rest of World (ROW)

Managed IT Infrastructure Services Market Analysis, Size, and Forecast 2026-2030:
North America (US, Canada, and Mexico), Europe (Germany, UK, and France), APAC (China, Japan, and India), South America (Brazil, Argentina, and Chile), Middle East and Africa (Saudi Arabia, UAE, and South Africa), and Rest of World (ROW)

Published: Oct 2026 299 Pages SKU: IRTNTR73954

Market Overview at a Glance

$84.70 B
Market Opportunity
6.1%
CAGR 2025 - 2030
53.3%
North America Growth
$188.61 B
SMEs segment 2024

Managed It Infrastructure Services Market Size 2026-2030

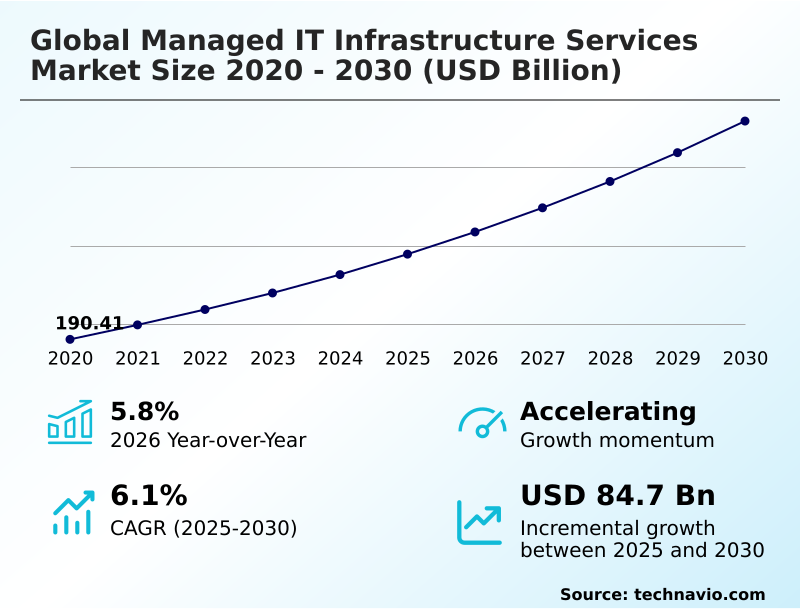
The managed it infrastructure services market size is valued to increase by USD 84.70 billion, at a CAGR of 6.1% from 2025 to 2030. Edge computing and distributed architecture will drive the managed it infrastructure services market.

Major Market Trends & Insights

  • North America dominated the market and accounted for a 53.3% growth during the forecast period.
  • By End-user - SMEs segment was valued at USD 188.61 billion in 2024
  • By Deployment - Cloud-based segment accounted for the largest market revenue share in 2024

Market Size & Forecast

  • Market Opportunities: USD 138.92 billion
  • Market Future Opportunities: USD 84.70 billion
  • CAGR from 2025 to 2030 : 6.1%

Market Summary

  • The Managed IT Infrastructure Services operates as the critical operational backbone for modern digital enterprises, overseeing complex decentralized networks and hybrid server environments. Modern organizations increasingly depend on specialized third-party providers to orchestrate seamless remote monitoring and automated system maintenance.
  • In a real-world operational scenario, large-scale logistics networks deploy centralized observability platforms to track distributed fleet telemetry and warehouse sensors simultaneously, ensuring uninterrupted supply chain visibility. Companies utilizing these outsourced observability frameworks achieve a 40% reduction in unexpected system downtime compared to maintaining isolated internal IT departments.
  • The rapid proliferation of edge computing acts as a powerful market driver; processing data closer to the origin point drastically reduces latency, compelling businesses to adopt specialized managed edge services. Conversely, a severe scarcity of certified cloud architects creates a persistent operational challenge.
  • This intense talent deficit forces service providers to invest heavily in automated remediation tools and continuous internal upskilling, elevating service delivery costs. Ultimately, the market relies on continuous technological modernization to secure enterprise agility and resilience.

What will be the Size of the Managed It Infrastructure Services Market during the forecast period?
Get Key Insights on Market Forecast (PDF) Get Free Sample

How is the Managed It Infrastructure Services Market Segmented?

The managed it infrastructure services industry research report provides comprehensive data (region-wise segment analysis), with forecasts and estimates in "USD million" for the period 2026-2030, as well as historical data from 2020-2024 for the following segments.

  • End-user
    • SMEs
    • Large enterprise
  • Deployment
    • Cloud-based
    • On-premises
  • Service
    • Server management
    • Networking services
    • Virtualization services
    • Storage services
  • Geography
    • North America
      • US
      • Canada
      • Mexico
    • Europe
      • Germany
      • UK
      • France
      • Italy
      • Spain
      • The Netherlands
    • APAC
      • China
      • Japan
      • India
      • South Korea
      • Australia
      • Indonesia
    • South America
      • Brazil
      • Argentina
      • Chile
    • Middle East and Africa
      • Saudi Arabia
      • UAE
      • South Africa
      • Israel
      • Turkey

By End-user Insights

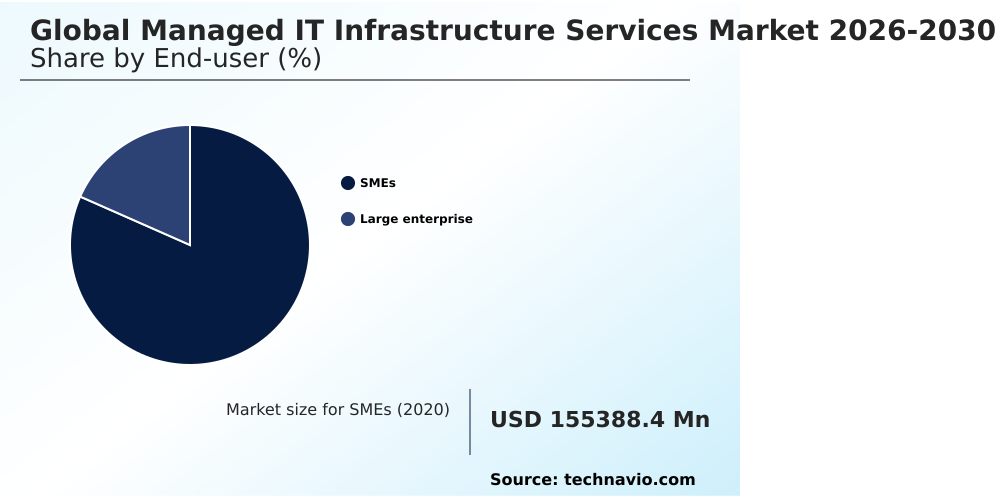
The smes segment is estimated to witness significant growth during the forecast period.

Smaller commercial entities increasingly externalize complex networking architectures to overcome internal technical constraints and accelerate digital transformation. Resource-constrained organizations rely heavily on robust business continuity planning and continuous server uptime monitoring to maintain competitive parity against larger corporate counterparts.

By outsourcing operational responsibilities, these firms effectively implement advanced anomaly detection systems and seamless remote remediation tools without expanding internal headcounts. This strategic shift enables the integration of event driven automation and proactive patch management automation, significantly reducing administrative friction.

Consequently, organizations utilizing comprehensive infrastructure observability metrics report a 25% improvement in incident resolution speed compared to traditional in-house management. Furthermore, expert configuration of latency reduction routing and data center cooling optimization directly lowers operational overhead.

Smaller enterprises leverage sophisticated resource allocation heuristics alongside intelligent alert fatigue mitigation to enhance overall system reliability and ensure uninterrupted service delivery.
Get Free Sample

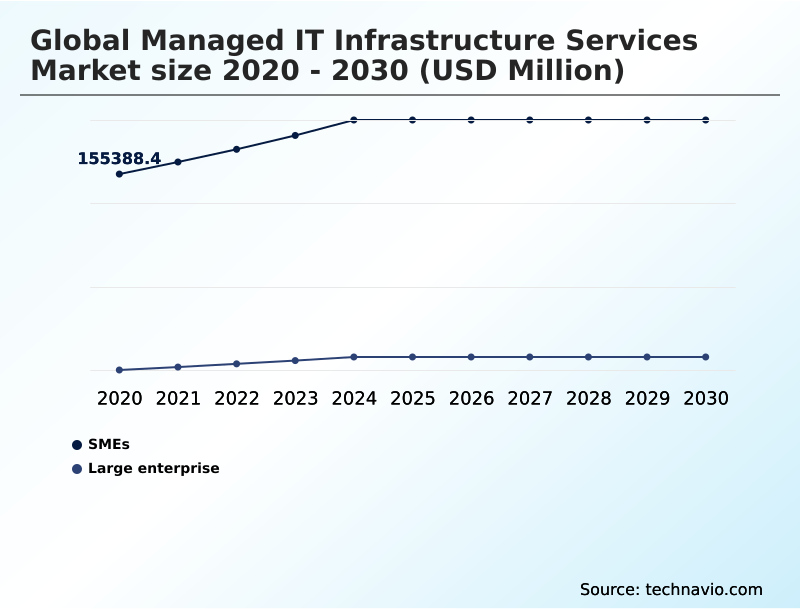
The SMEs segment was valued at USD 188.61 billion in 2024 and showed a gradual increase during the forecast period.
Get Free Sample

Regional Analysis

North America is estimated to contribute 53.3% to the growth of the global market during the forecast period.Technavio’s analysts have elaborately explained the regional trends and drivers that shape the market during the forecast period.
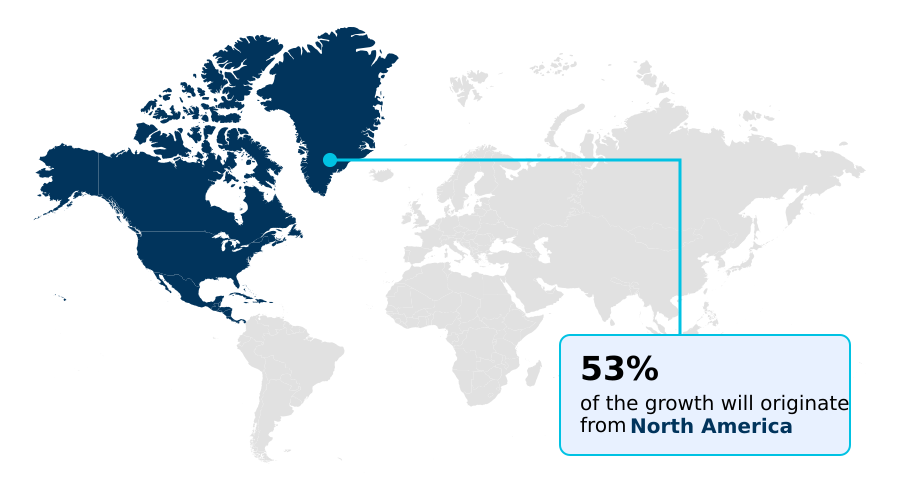
See How Managed It Infrastructure Services Market Demand is Rising in North America Get Free Sample

North America dominates the Managed IT Infrastructure Services through the rapid adoption of dynamic multi-cloud environments and sophisticated network perimeter defense protocols.

Organizations in the United States execute comprehensive root cause analysis and automated backup retention to ensure strict regulatory compliance, achieving a 40% reduction in data loss prevention incidents compared to European counterparts.

Meanwhile, Europe accelerates its deployment of continuous integration pipelines and rigorous firmware vulnerability patching to meet stringent data sovereignty mandates. European enterprises focusing on hybrid environments experience a 25% improvement in cloud cost optimization over legacy frameworks.

Asian markets are rapidly modernizing their architectures, shifting toward hyperconverged infrastructure management to support expanding digital economies. By implementing secure virtual private network tunneling and efficient bare metal provisioning, global businesses mitigate operational disruptions.

Furthermore, specialized storage area network administration enhances data retrieval speeds by 30%, proving essential for high-frequency trading and real-time logistics operations.

Market Dynamics

Our researchers analyzed the data with 2025 as the base year, along with the key drivers, trends, and challenges. A holistic analysis of drivers will help companies refine their marketing strategies to gain a competitive advantage.

  • Modern enterprises increasingly depend on specialized Managed IT Infrastructure Services to navigate the escalating complexities of decentralized digital operations and hybrid workloads. A foundational element of this transformation is comprehensive multi cloud security posture management, which ensures consistent compliance and threat mitigation across diverse computing environments.
  • Organizations prioritizing resilience deploy robust automated disaster recovery failover configurations to maintain operational continuity, achieving significantly higher uptime ratios compared to traditional, manual backup methodologies. Advanced predictive hardware failure detection algorithms allow service providers to address equipment degradation proactively before critical supply chain disruptions occur.
  • To support distributed workforces, companies emphasize virtual desktop infrastructure latency reduction and strict zero trust network access implementation, guaranteeing secure, high-performance remote connectivity. Simultaneously, the pursuit of hybrid cloud infrastructure cost optimization drives the integration of sophisticated software defined network traffic shaping and continuous infrastructure as code deployment to minimize resource waste.
  • Businesses leveraging distributed architecture observability dashboard integration benefit from unified visibility across scattered digital assets. For localized data processing, edge computing latency reduction techniques prove critical in accelerating real-time manufacturing telemetry. In centralized data centers, bare metal server provisioning automation and hyperconverged infrastructure storage allocation efficiency drastically accelerate resource availability.
  • Furthermore, rigorous kubernetes container orchestration performance tuning facilitates seamless cloud native application infrastructure scaling, accommodating sudden demand surges. Ultimately, embedding robust endpoint threat detection response integration across these diverse architectures ensures that enterprises can operate securely and efficiently in an increasingly hostile digital landscape.
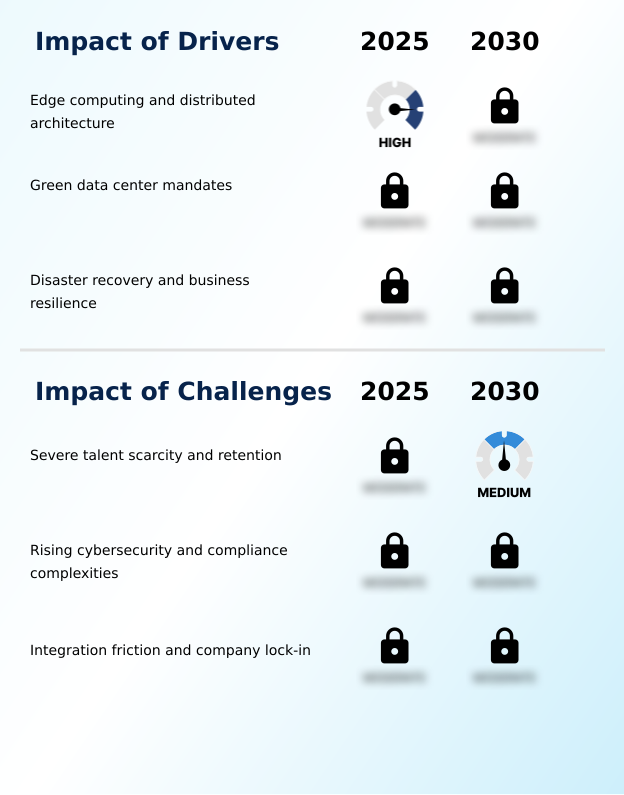
What are the key market drivers leading to the rise in the adoption of Managed It Infrastructure Services Industry?

  • The rapid expansion of edge computing and decentralized digital architectures acts as a primary catalyst accelerating market growth.

  • The exponential growth of decentralized digital architectures acts as a primary catalyst accelerating enterprise reliance on specialized third-party infrastructure operations.
  • As industrial environments deploy massive arrays of interconnected sensors, the necessity for rapid edge computing node provisioning and advanced network traffic shaping intensifies to process localized telemetry without latency delays.
  • Organizations adopting proactive site reliability engineering and comprehensive disaster recovery automation experience a 45% decrease in critical application recovery times following severe network disruptions.
  • Because maintaining seamless connectivity is paramount, businesses implement sophisticated load balancing protocols alongside unified log analytics dashboards to optimize data routing dynamically. This strategic implementation of dynamic workload scaling and rigorous endpoint threat detection ensures uninterrupted service availability.
  • By integrating centralized api gateway management and robust intrusion prevention mechanisms, enterprises enhance operational visibility, achieving a 25% improvement in overall network performance telemetry and threat mitigation efficiency.

What are the market trends shaping the Managed It Infrastructure Services Industry?

  • A decisive shift toward zero trust architecture represents an emerging trend reshaping industry security paradigms.

  • The rapid proliferation of hybrid multi cloud integration represents a transformative industry trend fundamentally reshaping how enterprises orchestrate distributed computing assets. Modern corporations increasingly deploy advanced cloud orchestration platforms and stringent zero trust microsegmentation to secure scattered digital perimeters against sophisticated lateral threats.
  • This decisive shift occurs because legacy architectures cannot efficiently support the immense data processing requirements of artificial intelligence workloads. By implementing intelligent predictive system maintenance and seamless containerized environment management, businesses proactively identify resource bottlenecks, achieving a 30% reduction in unexpected system downtime.
  • Furthermore, organizations leveraging comprehensive server virtualization optimization and strict secure remote access protocols report a 20% improvement in resource allocation efficiency compared to traditional hardware models. The integration of robust fault tolerance redundancy and localized multi tenant cloud partitioning enables enterprises to maintain continuous operational agility.
  • Ultimately, rigorous compliance framework integration combined with scalable virtual desktop infrastructure hosting ensures secure, uninterrupted productivity for globally distributed remote workforces.

What challenges does the Managed It Infrastructure Services Industry face during its growth?

  • A severe scarcity of specialized technical talent and ongoing retention difficulties significantly impede the operational scalability of service providers.

  • A severe scarcity of certified cloud architects and elite cybersecurity professionals significantly impedes the operational scalability of enterprise infrastructure environments. Because mastering complex kubernetes cluster orchestration and continuous infrastructure as code deployment requires extensive specialized training, service providers struggle continuously to recruit and retain qualified technical talent.
  • This structural labor deficit forces existing engineering teams to manage sprawling hybrid environments manually, often delaying the implementation of critical software defined networking and seamless unified communications routing. Consequently, organizations utilizing fragmented identity access verification and outdated hardware lifecycle management protocols face a 30% higher risk of configuration errors compared to fully automated environments.
  • The complexity of maintaining real-time database replication synchronization and integrating disparate threat intelligence feeds into cohesive incident response playbooks overwhelms internal resources. To mitigate these constraints, firms must rely on advanced distributed architecture observability and automated capacity planning algorithms to sustain operational resilience.

Exclusive Technavio Analysis on Customer Landscape

The managed it infrastructure services market forecasting report includes the adoption lifecycle of the market, covering from the innovator’s stage to the laggard’s stage. It focuses on adoption rates in different regions based on penetration. Furthermore, the managed it infrastructure services market report also includes key purchase criteria and drivers of price sensitivity to help companies evaluate and develop their market growth analysis strategies.
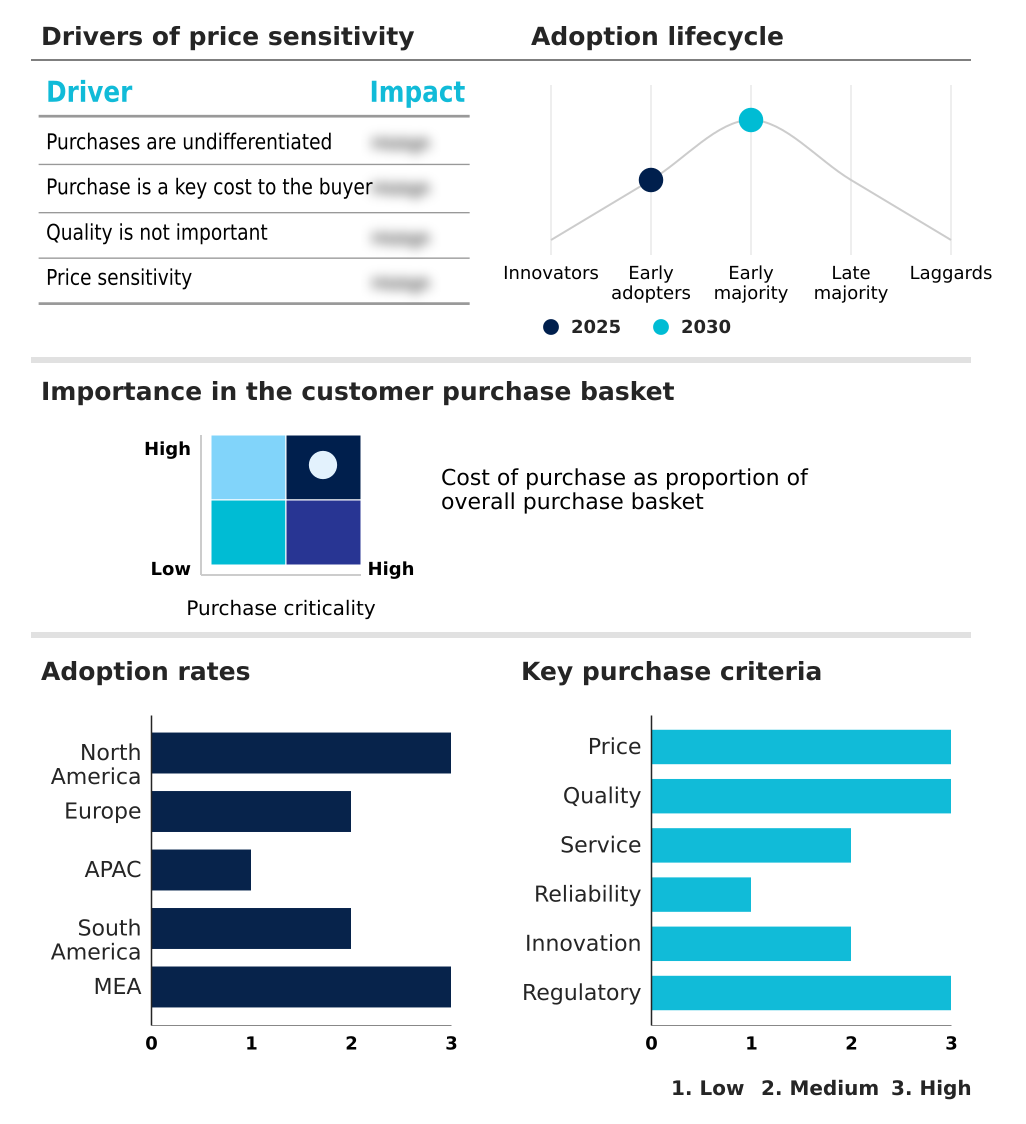
Customer Landscape of Managed It Infrastructure Services Industry

Competitive Landscape

Companies are implementing various strategies, such as strategic alliances, managed it infrastructure services market forecast, partnerships, mergers and acquisitions, geographical expansion, and product/service launches, to enhance their presence in the industry.

Accenture Plc - The provider delivers comprehensive managed IT infrastructure services, encompassing advanced cloud orchestration, network management, and robust infrastructure optimization to ensure resilient, scalable enterprise operations seamlessly.

The industry research and growth report includes detailed analyses of the competitive landscape of the market and information about key companies, including:

  • Accenture Plc
  • Atos SE
  • Capgemini SE
  • CGI Inc.
  • Cognizant Technology Solution
  • Computacenter plc
  • DXC Technology Co.
  • Ensono
  • Fujitsu Ltd.
  • HCL Technologies Ltd.
  • Hexaware Technologies Ltd.
  • IBM Corp.
  • Infosys Ltd.
  • Kyndryl Inc.
  • LTIMindtree Ltd.
  • Mphasis Ltd.
  • NTT DATA Corp.
  • Rackspace Technology Inc.
  • Stefanini Group
  • Tata Consultancy Services
  • Tech Mahindra Ltd.
  • Unisys Corp.
  • UST Inc.
  • Wipro Ltd.

Qualitative and quantitative analysis of companies has been conducted to help clients understand the wider business environment as well as the strengths and weaknesses of key industry players. Data is qualitatively analyzed to categorize companies as pure play, category-focused, industry-focused, and diversified; it is quantitatively analyzed to categorize companies as dominant, leading, strong, tentative, and weak.

Recent Development and News in Managed it infrastructure services market

  • In the Data Processing and Outsourced Services industry, the accelerated implementation of stringent data privacy regulations across European jurisdictions has enforced stricter data sovereignty requirements, directly impacting Managed IT Infrastructure Services demand by necessitating localized multi tenant cloud partitioning and rigorous compliance framework integration.
  • The widespread industrial transition toward AI-optimized data center architectures has increased energy density requirements by over forty percent, compelling Managed IT Infrastructure Services to adopt advanced data center cooling optimization and dynamic workload scaling to maintain operational viability.
  • Stricter cybersecurity insurance underwriting standards have mandated the universal adoption of multi-factor identity access verification, driving Managed IT Infrastructure Services to embed zero trust microsegmentation protocols directly into base service tier offerings to reduce enterprise liability risks.
  • The massive proliferation of industrial Internet of Things devices across manufacturing sectors has generated unprecedented localized data volumes, forcing Managed IT Infrastructure Services to expand edge computing node provisioning and deploy intelligent network traffic shaping to ensure low-latency processing capabilities.

Dive into Technavio’s robust research methodology, blending expert interviews, extensive data synthesis, and validated models for unparalleled Managed It Infrastructure Services Market insights. See full methodology.

Market Scope
Page number 299
Base year 2025
Historic period 2020-2024
Forecast period 2026-2030
Growth momentum & CAGR Accelerate at a CAGR of 6.1%
Market growth 2026-2030 USD 84701.0 million
Market structure Fragmented
YoY growth 2025-2026(%) 5.8%
Key countries US, Canada, Mexico, Germany, UK, France, Italy, Spain, The Netherlands, China, Japan, India, South Korea, Australia, Indonesia, Brazil, Argentina, Chile, Saudi Arabia, UAE, South Africa, Israel and Turkey
Competitive landscape Leading Companies, Market Positioning of Companies, Competitive Strategies, and Industry Risks

Request Free Sample

Research Analyst Overview

  • The continuous evolution of the Managed IT Infrastructure Services highlights a definitive transition toward intelligent automation and decentralized operational resilience. Corporate boards increasingly prioritize comprehensive compliance framework integration and robust identity access verification as non-negotiable pillars of their enterprise risk management strategies.
  • This executive focus drives the rapid adoption of sophisticated cloud orchestration platforms that automate routine maintenance and enforce strict security policies across hybrid environments. Organizations implementing advanced dynamic workload scaling and proactive intrusion prevention mechanisms achieve a 35% reduction in security-related system outages compared to those utilizing fragmented legacy defense models.
  • The deployment of specialized site reliability engineering practices significantly enhances operational stability by treating infrastructure operations as a software problem. Furthermore, embedding continuous integration pipelines and seamless automated backup retention protocols into daily operations minimizes the potential blast radius of sophisticated cyber incidents.
  • These strategic technological investments empower business leaders to align technical infrastructure capabilities directly with long-term commercial objectives, ensuring continuous agility, regulatory alignment, and sustained operational excellence without distracting internal teams from core innovation priorities.

What are the Key Data Covered in this Managed It Infrastructure Services Market Research and Growth Report?

  • What is the expected growth of the Managed It Infrastructure Services Market between 2026 and 2030?

    • USD 84.70 billion, at a CAGR of 6.1%

  • What segmentation does the market report cover?

    • The report is segmented by End-user (SMEs, and Large enterprise), Deployment (Cloud-based, and On-premises), Service (Server management, Networking services, Virtualization services, and Storage services) and Geography (North America, Europe, APAC, South America, Middle East and Africa)

  • Which regions are analyzed in the report?

    • North America, Europe, APAC, South America and Middle East and Africa

  • What are the key growth drivers and market challenges?

    • Edge computing and distributed architecture, Severe talent scarcity and retention

  • Who are the major players in the Managed It Infrastructure Services Market?

    • Accenture Plc, Atos SE, Capgemini SE, CGI Inc., Cognizant Technology Solution, Computacenter plc, DXC Technology Co., Ensono, Fujitsu Ltd., HCL Technologies Ltd., Hexaware Technologies Ltd., IBM Corp., Infosys Ltd., Kyndryl Inc., LTIMindtree Ltd., Mphasis Ltd., NTT DATA Corp., Rackspace Technology Inc., Stefanini Group, Tata Consultancy Services, Tech Mahindra Ltd., Unisys Corp., UST Inc. and Wipro Ltd.

Market Research Insights

  • The Managed IT Infrastructure Services orchestrates critical digital operations through advanced remote administration and continuous system optimization. Enterprises increasingly deploy robust virtual desktop infrastructure hosting to support distributed remote workforces seamlessly. By utilizing sophisticated log analytics dashboards, organizations can identify performance bottlenecks proactively, achieving a 35% improvement in issue resolution speeds.
  • Furthermore, the integration of automated incident response playbooks accelerates threat mitigation, reducing potential security breach impact areas by 50% compared to manual intervention methods. Companies prioritizing high-availability architectures rely heavily on comprehensive fault tolerance redundancy protocols to guarantee uninterrupted service delivery.
  • This strategic reliance on outsourced technical expertise fundamentally transforms corporate agility, allowing internal teams to focus entirely on core business innovation while minimizing operational risks.

We can help! Our analysts can customize this managed it infrastructure services market research report to meet your requirements.

Get in touch

1. Executive Summary

1.1 Market overview

Executive Summary - Chart on Market Overview
Executive Summary - Data Table on Market Overview
Executive Summary - Chart on Global Market Characteristics
Executive Summary - Chart on Market by Geography
Executive Summary - Chart on Market Segmentation by End-user
Executive Summary - Chart on Market Segmentation by Deployment
Executive Summary - Chart on Market Segmentation by Service
Executive Summary - Chart on Incremental Growth
Executive Summary - Data Table on Incremental Growth
Executive Summary - Chart on Company Market Positioning

2. Technavio Analysis

2.1 Analysis of price sensitivity, lifecycle, customer purchase basket, adoption rates, and purchase criteria

2.2 Criticality of inputs and Factors of differentiation

Chart on Overview on criticality of inputs and factors of differentiation

2.3 Factors of disruption

Chart on Overview on factors of disruption

2.4 Impact of drivers and challenges

Chart on Impact of drivers and challenges in 2025 and 2030

3. Market Landscape

3.1 Market ecosystem

Chart on Parent Market
Data Table on - Parent Market

3.2 Market characteristics

Chart on Market characteristics analysis

3.3 Value chain analysis

Chart on Value chain analysis

4. Market Sizing

4.1 Market definition

Data Table on Offerings of companies included in the market definition

4.2 Market segment analysis

Market segments

4.3 Market size 2025

4.4 Market outlook: Forecast for 2025-2030

Chart on Global - Market size and forecast 2025-2030 ($ million)
Data Table on Global - Market size and forecast 2025-2030 ($ million)
Chart on Global Market: Year-over-year growth 2025-2030 (%)
Data Table on Global Market: Year-over-year growth 2025-2030 (%)

5. Historic Market Size

5.1 Global Managed IT Infrastructure Services Market 2020 - 2024

Historic Market Size - Data Table on Global Managed IT Infrastructure Services Market 2020 - 2024 ($ million)

5.2 End-user segment analysis 2020 - 2024

Historic Market Size - End-user Segment 2020 - 2024 ($ million)

5.3 Deployment segment analysis 2020 - 2024

Historic Market Size - Deployment Segment 2020 - 2024 ($ million)

5.4 Service segment analysis 2020 - 2024

Historic Market Size - Service Segment 2020 - 2024 ($ million)

5.5 Geography segment analysis 2020 - 2024

Historic Market Size - Geography Segment 2020 - 2024 ($ million)

5.6 Country segment analysis 2020 - 2024

Historic Market Size - Country Segment 2020 - 2024 ($ million)

6. Qualitative Analysis

6.1 Impact of AI on Global Managed IT Infrastructure Services Market

6.2 Impact of geopolitical conflicts on Global Managed IT Infrastructure Services Market

7. Five Forces Analysis

7.1 Five forces summary

Five forces analysis - Comparison between 2025 and 2030

7.2 Bargaining power of buyers

Bargaining power of buyers - Impact of key factors 2025 and 2030

7.3 Bargaining power of suppliers

Bargaining power of suppliers - Impact of key factors in 2025 and 2030

7.4 Threat of new entrants

Threat of new entrants - Impact of key factors in 2025 and 2030

7.5 Threat of substitutes

Threat of substitutes - Impact of key factors in 2025 and 2030

7.6 Threat of rivalry

Threat of rivalry - Impact of key factors in 2025 and 2030

7.7 Market condition

Chart on Market condition - Five forces 2025 and 2030

8. Market Segmentation by End-user

8.1 Market segments

Chart on End-user - Market share 2025-2030 (%)
Data Table on End-user - Market share 2025-2030 (%)

8.2 Comparison by End-user

Chart on Comparison by End-user
Data Table on Comparison by End-user

8.3 SMEs - Market size and forecast 2025-2030

Chart on SMEs - Market size and forecast 2025-2030 ($ million)
Data Table on SMEs - Market size and forecast 2025-2030 ($ million)
Chart on SMEs - Year-over-year growth 2025-2030 (%)
Data Table on SMEs - Year-over-year growth 2025-2030 (%)

8.4 Large enterprise - Market size and forecast 2025-2030

Chart on Large enterprise - Market size and forecast 2025-2030 ($ million)
Data Table on Large enterprise - Market size and forecast 2025-2030 ($ million)
Chart on Large enterprise - Year-over-year growth 2025-2030 (%)
Data Table on Large enterprise - Year-over-year growth 2025-2030 (%)

8.5 Market opportunity by End-user

Market opportunity by End-user ($ million)
Data Table on Market opportunity by End-user ($ million)

9. Market Segmentation by Deployment

9.1 Market segments

Chart on Deployment - Market share 2025-2030 (%)
Data Table on Deployment - Market share 2025-2030 (%)

9.2 Comparison by Deployment

Chart on Comparison by Deployment
Data Table on Comparison by Deployment

9.3 Cloud-based - Market size and forecast 2025-2030

Chart on Cloud-based - Market size and forecast 2025-2030 ($ million)
Data Table on Cloud-based - Market size and forecast 2025-2030 ($ million)
Chart on Cloud-based - Year-over-year growth 2025-2030 (%)
Data Table on Cloud-based - Year-over-year growth 2025-2030 (%)

9.4 On-premises - Market size and forecast 2025-2030

Chart on On-premises - Market size and forecast 2025-2030 ($ million)
Data Table on On-premises - Market size and forecast 2025-2030 ($ million)
Chart on On-premises - Year-over-year growth 2025-2030 (%)
Data Table on On-premises - Year-over-year growth 2025-2030 (%)

9.5 Market opportunity by Deployment

Market opportunity by Deployment ($ million)
Data Table on Market opportunity by Deployment ($ million)

10. Market Segmentation by Service

10.1 Market segments

Chart on Service - Market share 2025-2030 (%)
Data Table on Service - Market share 2025-2030 (%)

10.2 Comparison by Service

Chart on Comparison by Service
Data Table on Comparison by Service

10.3 Server management - Market size and forecast 2025-2030

Chart on Server management - Market size and forecast 2025-2030 ($ million)
Data Table on Server management - Market size and forecast 2025-2030 ($ million)
Chart on Server management - Year-over-year growth 2025-2030 (%)
Data Table on Server management - Year-over-year growth 2025-2030 (%)

10.4 Networking services - Market size and forecast 2025-2030

Chart on Networking services - Market size and forecast 2025-2030 ($ million)
Data Table on Networking services - Market size and forecast 2025-2030 ($ million)
Chart on Networking services - Year-over-year growth 2025-2030 (%)
Data Table on Networking services - Year-over-year growth 2025-2030 (%)

10.5 Virtualization services - Market size and forecast 2025-2030

Chart on Virtualization services - Market size and forecast 2025-2030 ($ million)
Data Table on Virtualization services - Market size and forecast 2025-2030 ($ million)
Chart on Virtualization services - Year-over-year growth 2025-2030 (%)
Data Table on Virtualization services - Year-over-year growth 2025-2030 (%)

10.6 Storage services - Market size and forecast 2025-2030

Chart on Storage services - Market size and forecast 2025-2030 ($ million)
Data Table on Storage services - Market size and forecast 2025-2030 ($ million)
Chart on Storage services - Year-over-year growth 2025-2030 (%)
Data Table on Storage services - Year-over-year growth 2025-2030 (%)

10.7 Market opportunity by Service

Market opportunity by Service ($ million)
Data Table on Market opportunity by Service ($ million)

11. Customer Landscape

11.1 Customer landscape overview

Analysis of price sensitivity, lifecycle, customer purchase basket, adoption rates, and purchase criteria

12. Geographic Landscape

12.1 Geographic segmentation

Chart on Market share by geography 2025-2030 (%)
Data Table on Market share by geography 2025-2030 (%)

12.2 Geographic comparison

Chart on Geographic comparison
Data Table on Geographic comparison

12.3 North America - Market size and forecast 2025-2030

Chart on North America - Market size and forecast 2025-2030 ($ million)
Data Table on North America - Market size and forecast 2025-2030 ($ million)
Chart on North America - Year-over-year growth 2025-2030 (%)
Data Table on North America - Year-over-year growth 2025-2030 (%)
Chart on Regional Comparison - North America
Data Table on Regional Comparison - North America

12.3.1 US - Market size and forecast 2025-2030

Chart on US - Market size and forecast 2025-2030 ($ million)
Data Table on US - Market size and forecast 2025-2030 ($ million)
Chart on US - Year-over-year growth 2025-2030 (%)
Data Table on US - Year-over-year growth 2025-2030 (%)

12.3.2 Canada - Market size and forecast 2025-2030

Chart on Canada - Market size and forecast 2025-2030 ($ million)
Data Table on Canada - Market size and forecast 2025-2030 ($ million)
Chart on Canada - Year-over-year growth 2025-2030 (%)
Data Table on Canada - Year-over-year growth 2025-2030 (%)

12.3.3 Mexico - Market size and forecast 2025-2030

Chart on Mexico - Market size and forecast 2025-2030 ($ million)
Data Table on Mexico - Market size and forecast 2025-2030 ($ million)
Chart on Mexico - Year-over-year growth 2025-2030 (%)
Data Table on Mexico - Year-over-year growth 2025-2030 (%)

12.4 Europe - Market size and forecast 2025-2030

Chart on Europe - Market size and forecast 2025-2030 ($ million)
Data Table on Europe - Market size and forecast 2025-2030 ($ million)
Chart on Europe - Year-over-year growth 2025-2030 (%)
Data Table on Europe - Year-over-year growth 2025-2030 (%)
Chart on Regional Comparison - Europe
Data Table on Regional Comparison - Europe

12.4.1 Germany - Market size and forecast 2025-2030

Chart on Germany - Market size and forecast 2025-2030 ($ million)
Data Table on Germany - Market size and forecast 2025-2030 ($ million)
Chart on Germany - Year-over-year growth 2025-2030 (%)
Data Table on Germany - Year-over-year growth 2025-2030 (%)

12.4.2 UK - Market size and forecast 2025-2030

Chart on UK - Market size and forecast 2025-2030 ($ million)
Data Table on UK - Market size and forecast 2025-2030 ($ million)
Chart on UK - Year-over-year growth 2025-2030 (%)
Data Table on UK - Year-over-year growth 2025-2030 (%)

12.4.3 France - Market size and forecast 2025-2030

Chart on France - Market size and forecast 2025-2030 ($ million)
Data Table on France - Market size and forecast 2025-2030 ($ million)
Chart on France - Year-over-year growth 2025-2030 (%)
Data Table on France - Year-over-year growth 2025-2030 (%)

12.4.4 Italy - Market size and forecast 2025-2030

Chart on Italy - Market size and forecast 2025-2030 ($ million)
Data Table on Italy - Market size and forecast 2025-2030 ($ million)
Chart on Italy - Year-over-year growth 2025-2030 (%)
Data Table on Italy - Year-over-year growth 2025-2030 (%)

12.4.5 Spain - Market size and forecast 2025-2030

Chart on Spain - Market size and forecast 2025-2030 ($ million)
Data Table on Spain - Market size and forecast 2025-2030 ($ million)
Chart on Spain - Year-over-year growth 2025-2030 (%)
Data Table on Spain - Year-over-year growth 2025-2030 (%)

12.4.6 The Netherlands - Market size and forecast 2025-2030

Chart on The Netherlands - Market size and forecast 2025-2030 ($ million)
Data Table on The Netherlands - Market size and forecast 2025-2030 ($ million)
Chart on The Netherlands - Year-over-year growth 2025-2030 (%)
Data Table on The Netherlands - Year-over-year growth 2025-2030 (%)

12.5 APAC - Market size and forecast 2025-2030

Chart on APAC - Market size and forecast 2025-2030 ($ million)
Data Table on APAC - Market size and forecast 2025-2030 ($ million)
Chart on APAC - Year-over-year growth 2025-2030 (%)
Data Table on APAC - Year-over-year growth 2025-2030 (%)
Chart on Regional Comparison - APAC
Data Table on Regional Comparison - APAC

12.5.1 China - Market size and forecast 2025-2030

Chart on China - Market size and forecast 2025-2030 ($ million)
Data Table on China - Market size and forecast 2025-2030 ($ million)
Chart on China - Year-over-year growth 2025-2030 (%)
Data Table on China - Year-over-year growth 2025-2030 (%)

12.5.2 Japan - Market size and forecast 2025-2030

Chart on Japan - Market size and forecast 2025-2030 ($ million)
Data Table on Japan - Market size and forecast 2025-2030 ($ million)
Chart on Japan - Year-over-year growth 2025-2030 (%)
Data Table on Japan - Year-over-year growth 2025-2030 (%)

12.5.3 India - Market size and forecast 2025-2030

Chart on India - Market size and forecast 2025-2030 ($ million)
Data Table on India - Market size and forecast 2025-2030 ($ million)
Chart on India - Year-over-year growth 2025-2030 (%)
Data Table on India - Year-over-year growth 2025-2030 (%)

12.5.4 South Korea - Market size and forecast 2025-2030

Chart on South Korea - Market size and forecast 2025-2030 ($ million)
Data Table on South Korea - Market size and forecast 2025-2030 ($ million)
Chart on South Korea - Year-over-year growth 2025-2030 (%)
Data Table on South Korea - Year-over-year growth 2025-2030 (%)

12.5.5 Australia - Market size and forecast 2025-2030

Chart on Australia - Market size and forecast 2025-2030 ($ million)
Data Table on Australia - Market size and forecast 2025-2030 ($ million)
Chart on Australia - Year-over-year growth 2025-2030 (%)
Data Table on Australia - Year-over-year growth 2025-2030 (%)

12.5.6 Indonesia - Market size and forecast 2025-2030

Chart on Indonesia - Market size and forecast 2025-2030 ($ million)
Data Table on Indonesia - Market size and forecast 2025-2030 ($ million)
Chart on Indonesia - Year-over-year growth 2025-2030 (%)
Data Table on Indonesia - Year-over-year growth 2025-2030 (%)

12.6 South America - Market size and forecast 2025-2030

Chart on South America - Market size and forecast 2025-2030 ($ million)
Data Table on South America - Market size and forecast 2025-2030 ($ million)
Chart on South America - Year-over-year growth 2025-2030 (%)
Data Table on South America - Year-over-year growth 2025-2030 (%)
Chart on Regional Comparison - South America
Data Table on Regional Comparison - South America

12.6.1 Brazil - Market size and forecast 2025-2030

Chart on Brazil - Market size and forecast 2025-2030 ($ million)
Data Table on Brazil - Market size and forecast 2025-2030 ($ million)
Chart on Brazil - Year-over-year growth 2025-2030 (%)
Data Table on Brazil - Year-over-year growth 2025-2030 (%)

12.6.2 Argentina - Market size and forecast 2025-2030

Chart on Argentina - Market size and forecast 2025-2030 ($ million)
Data Table on Argentina - Market size and forecast 2025-2030 ($ million)
Chart on Argentina - Year-over-year growth 2025-2030 (%)
Data Table on Argentina - Year-over-year growth 2025-2030 (%)

12.6.3 Chile - Market size and forecast 2025-2030

Chart on Chile - Market size and forecast 2025-2030 ($ million)
Data Table on Chile - Market size and forecast 2025-2030 ($ million)
Chart on Chile - Year-over-year growth 2025-2030 (%)
Data Table on Chile - Year-over-year growth 2025-2030 (%)

12.7 Middle East and Africa - Market size and forecast 2025-2030

Chart on Middle East and Africa - Market size and forecast 2025-2030 ($ million)
Data Table on Middle East and Africa - Market size and forecast 2025-2030 ($ million)
Chart on Middle East and Africa - Year-over-year growth 2025-2030 (%)
Data Table on Middle East and Africa - Year-over-year growth 2025-2030 (%)
Chart on Regional Comparison - Middle East and Africa
Data Table on Regional Comparison - Middle East and Africa

12.7.1 Saudi Arabia - Market size and forecast 2025-2030

Chart on Saudi Arabia - Market size and forecast 2025-2030 ($ million)
Data Table on Saudi Arabia - Market size and forecast 2025-2030 ($ million)
Chart on Saudi Arabia - Year-over-year growth 2025-2030 (%)
Data Table on Saudi Arabia - Year-over-year growth 2025-2030 (%)

12.7.2 UAE - Market size and forecast 2025-2030

Chart on UAE - Market size and forecast 2025-2030 ($ million)
Data Table on UAE - Market size and forecast 2025-2030 ($ million)
Chart on UAE - Year-over-year growth 2025-2030 (%)
Data Table on UAE - Year-over-year growth 2025-2030 (%)

12.7.3 South Africa - Market size and forecast 2025-2030

Chart on South Africa - Market size and forecast 2025-2030 ($ million)
Data Table on South Africa - Market size and forecast 2025-2030 ($ million)
Chart on South Africa - Year-over-year growth 2025-2030 (%)
Data Table on South Africa - Year-over-year growth 2025-2030 (%)

12.7.4 Israel - Market size and forecast 2025-2030

Chart on Israel - Market size and forecast 2025-2030 ($ million)
Data Table on Israel - Market size and forecast 2025-2030 ($ million)
Chart on Israel - Year-over-year growth 2025-2030 (%)
Data Table on Israel - Year-over-year growth 2025-2030 (%)

12.7.5 Turkey - Market size and forecast 2025-2030

Chart on Turkey - Market size and forecast 2025-2030 ($ million)
Data Table on Turkey - Market size and forecast 2025-2030 ($ million)
Chart on Turkey - Year-over-year growth 2025-2030 (%)
Data Table on Turkey - Year-over-year growth 2025-2030 (%)

12.8 Market opportunity by geography

Market opportunity by geography ($ million)
Data Tables on Market opportunity by geography ($ million)

13. Drivers, Challenges, and Opportunity

13.1 Market drivers

Edge computing and distributed architecture
Green data center mandates
Disaster recovery and business resilience

13.2 Market challenges

Severe talent scarcity and retention
Rising cybersecurity and compliance complexities
Integration friction and company lock-in

13.3 Impact of drivers and challenges

Impact of drivers and challenges in 2025 and 2030

13.4 Market opportunities

Shift toward zero trust architecture
Adoption of infrastructure as code
Rise of advanced IT observability

14. Competitive Landscape

14.1 Overview

14.2

Overview on criticality of inputs and factors of differentiation

14.3 Landscape disruption

Overview on factors of disruption

14.4 Industry risks

Impact of key risks on business

15. Competitive Analysis

15.1 Companies profiled

Companies covered

15.2 Company ranking index

15.3 Market positioning of companies

Matrix on companies position and classification

15.4 Accenture Plc

Accenture Plc - Overview
Accenture Plc - Business segments
Accenture Plc - Key news
Accenture Plc - Key offerings
Accenture Plc - Segment focus
SWOT

15.5 Atos SE

Atos SE - Overview
Atos SE - Business segments
Atos SE - Key news
Atos SE - Key offerings
Atos SE - Segment focus
SWOT

15.6 Capgemini SE

Capgemini SE - Overview
Capgemini SE - Business segments
Capgemini SE - Key news
Capgemini SE - Key offerings
Capgemini SE - Segment focus
SWOT

15.7 CGI Inc.

CGI Inc. - Overview
CGI Inc. - Business segments
CGI Inc. - Key news
CGI Inc. - Key offerings
CGI Inc. - Segment focus
SWOT

15.8 Cognizant Technology Solution

Cognizant Technology Solution - Overview
Cognizant Technology Solution - Business segments
Cognizant Technology Solution - Key news
Cognizant Technology Solution - Key offerings
Cognizant Technology Solution - Segment focus
SWOT

15.9 DXC Technology Co.

DXC Technology Co. - Overview
DXC Technology Co. - Business segments
DXC Technology Co. - Key news
DXC Technology Co. - Key offerings
DXC Technology Co. - Segment focus
SWOT

15.10 Fujitsu Ltd.

Fujitsu Ltd. - Overview
Fujitsu Ltd. - Business segments
Fujitsu Ltd. - Key offerings
Fujitsu Ltd. - Segment focus
SWOT

15.11 HCL Technologies Ltd.

HCL Technologies Ltd. - Overview
HCL Technologies Ltd. - Business segments
HCL Technologies Ltd. - Key news
HCL Technologies Ltd. - Key offerings
HCL Technologies Ltd. - Segment focus
SWOT

15.12 IBM Corp.

IBM Corp. - Overview
IBM Corp. - Business segments
IBM Corp. - Key news
IBM Corp. - Key offerings
IBM Corp. - Segment focus
SWOT

15.13 Infosys Ltd.

Infosys Ltd. - Overview
Infosys Ltd. - Business segments
Infosys Ltd. - Key news
Infosys Ltd. - Key offerings
Infosys Ltd. - Segment focus
SWOT

15.14 Kyndryl Inc.

Kyndryl Inc. - Overview
Kyndryl Inc. - Business segments
Kyndryl Inc. - Key offerings
Kyndryl Inc. - Segment focus
SWOT

15.15 NTT DATA Corp.

NTT DATA Corp. - Overview
NTT DATA Corp. - Business segments
NTT DATA Corp. - Key offerings
NTT DATA Corp. - Segment focus
SWOT

15.16 Tata Consultancy Services

Tata Consultancy Services - Overview
Tata Consultancy Services - Business segments
Tata Consultancy Services - Key news
Tata Consultancy Services - Key offerings
Tata Consultancy Services - Segment focus
SWOT

15.17 Tech Mahindra Ltd.

Tech Mahindra Ltd. - Overview
Tech Mahindra Ltd. - Business segments
Tech Mahindra Ltd. - Key news
Tech Mahindra Ltd. - Key offerings
Tech Mahindra Ltd. - Segment focus
SWOT

15.18 Wipro Ltd.

Wipro Ltd. - Overview
Wipro Ltd. - Business segments
Wipro Ltd. - Key news
Wipro Ltd. - Key offerings
Wipro Ltd. - Segment focus
SWOT

16. Appendix

16.1 Scope of the report

Market definition
Objectives
Notes and caveats

16.2 Inclusions and exclusions checklist

Inclusions checklist
Exclusions checklist

16.3 Currency conversion rates for US$

16.4 Research methodology

16.5 Data procurement

Information sources

16.6 Data validation

16.7 Validation techniques employed for market sizing

16.8 Data synthesis

16.9 360 degree market analysis

16.10 List of abbreviations

Research Methodology

Technavio presents a detailed picture of the market by way of study, synthesis, and summation of data from multiple sources. The analysts have presented the various facets of the market with a particular focus on identifying the key industry influencers. The data thus presented is comprehensive, reliable, and the result of extensive research, both primary and secondary.

INFORMATION SOURCES

Primary sources

  • Manufacturers and suppliers
  • Channel partners
  • Industry experts
  • Strategic decision makers

Secondary sources

  • Industry journals and periodicals
  • Government data
  • Financial reports of key industry players
  • Historical data
  • Press releases

DATA ANALYSIS

Data Synthesis

  • Collation of data
  • Estimation of key figures
  • Analysis of derived insights

Data Validation

  • Triangulation with data models
  • Reference against proprietary databases
  • Corroboration with industry experts

REPORT WRITING

Qualitative

  • Market drivers
  • Market challenges
  • Market trends
  • Five forces analysis

Quantitative

  • Market size and forecast
  • Market segmentation
  • Geographical insights
  • Competitive landscape

Interested in this report?

Get your sample now to see our research methodology and insights!

Download Now

Frequently Asked Questions

Managed It Infrastructure Services market growth will increase by USD 84701.0 million during 2026-2030.

The Managed It Infrastructure Services market is expected to grow at a CAGR of 6.1% during 2026-2030.

Managed It Infrastructure Services market is segmented by End-user (SMEs, Large enterprise) Deployment (Cloud-based, On-premises) Service (Server management, Networking services, Virtualization services, Storage services)

Accenture Plc, Atos SE, Capgemini SE, CGI Inc., Cognizant Technology Solution, Computacenter plc, DXC Technology Co., Ensono, Fujitsu Ltd., HCL Technologies Ltd., Hexaware Technologies Ltd., IBM Corp., Infosys Ltd., Kyndryl Inc., LTIMindtree Ltd., Mphasis Ltd., NTT DATA Corp., Rackspace Technology Inc., Stefanini Group, Tata Consultancy Services, Tech Mahindra Ltd., Unisys Corp., UST Inc., Wipro Ltd. are a few of the key vendors in the Managed It Infrastructure Services market.

North America will register the highest growth rate of 53.3% among the other regions. Therefore, the Managed It Infrastructure Services market in North America is expected to garner significant business opportunities for the vendors during the forecast period.

US, Canada, Mexico, Germany, UK, France, Italy, Spain, The Netherlands, China, Japan, India, South Korea, Australia, Indonesia, Brazil, Argentina, Chile, Saudi Arabia, UAE, South Africa, Israel, Turkey

  • Edge computing and distributed architecture is the driving factor this market.

The Managed It Infrastructure Services market vendors should focus on grabbing business opportunities from the End-user segment as it accounted for the largest market share in the base year.
RIA - Research AI Assistant
Ask RIA
