Marine Anchor Chain Market Size 2025-2029
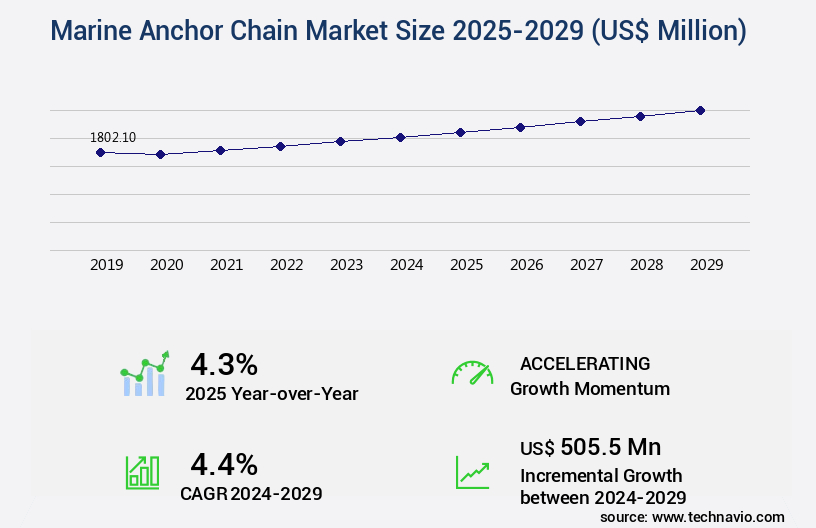
The marine anchor chain market size is valued to increase by USD 505.5 million, at a CAGR of 4.4% from 2024 to 2029. Increase in contracts for marine ships will drive the marine anchor chain market.
Major Market Trends & Insights
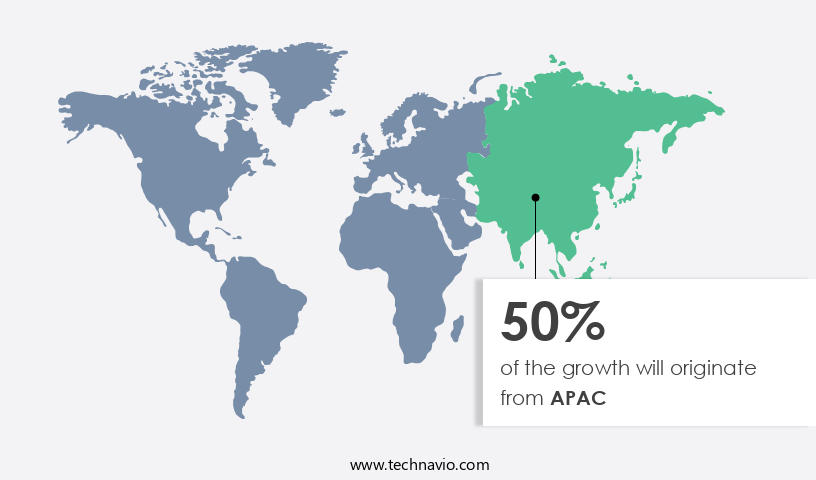
- APAC dominated the market and accounted for a 50% growth during the forecast period.
- By Type - Stud link anchor chain segment was valued at USD 1140.80 million in 2023
- By Product - Commercial shipping segment accounted for the largest market revenue share in 2023
Market Size & Forecast
- Market Opportunities: USD 44.28 million
- Market Future Opportunities: USD 505.50 million
- CAGR from 2024 to 2029: 4.4%
Market Summary
- The market is a critical component of the global maritime industry, driven by the increasing number of contracts for marine ships and the expansion of offshore energy projects, particularly offshore wind farms. However, the high initial cost of anchor chains remains a significant challenge, necessitating advancements in manufacturing processes and materials to improve efficiency and reduce costs. Innovations in chain design, such as lighter and stronger materials, modular construction, and the integration of smart technologies, are transforming the market.
- As the demand for larger and more advanced marine vessels and offshore installations grows, so too will the need for robust and reliable anchor chains. Consequently, the market is expected to remain a dynamic and evolving sector, presenting both opportunities and challenges for stakeholders.
What will be the Size of the Marine Anchor Chain Market during the forecast period?
Get Key Insights on Market Forecast (PDF) Request Free Sample
How is the Marine Anchor Chain Market Segmented?
The marine anchor chain industry research report provides comprehensive data (region-wise segment analysis), with forecasts and estimates in "USD million" for the period 2025-2029, as well as historical data from 2019-2023 for the following segments.
- Type
- Stud link anchor chain
- Non-stud link anchor chain
- Product
- Commercial shipping
- Offshore oil and gas
- Naval and military
- Others
- Geography
- North America
- US
- Canada
- Europe
- Norway
- UK
- APAC
- Australia
- China
- India
- Japan
- South Korea
- South America
- Brazil
- Rest of World (ROW)
- North America
By Type Insights
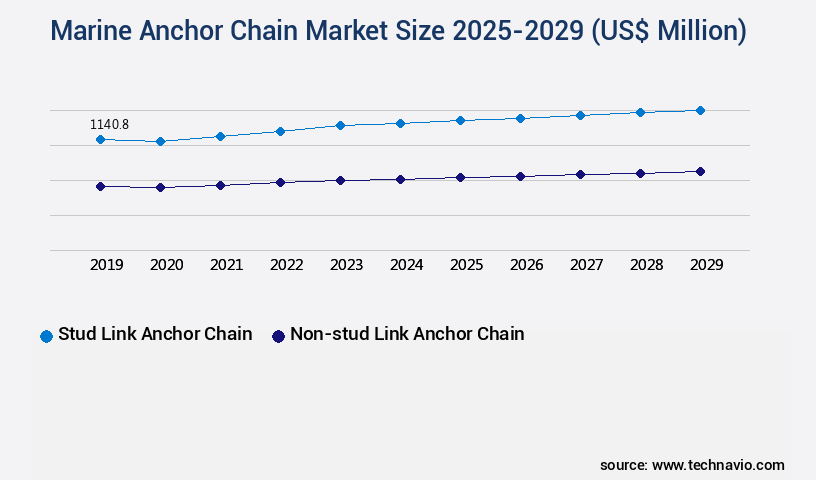
The stud link anchor chain segment is estimated to witness significant growth during the forecast period.
The market encompasses various types, with stud link chains holding a substantial share due to their robustness and versatility. These chains, characterized by studs on each link, are integral to mooring and securing vessels to the seafloor. Constructed primarily from marine-grade steel, stud link anchor chains undergo rigorous design processes, including fatigue life prediction, strength calculations, and material specifications. Their high tensile strength and corrosion resistance are ensured through galvanization processes, thermal spray coatings, and corrosion prevention methods. The market's continuous evolution is marked by advancements in chain manufacturing processes, such as shot blasting, chain lubrication methods, and deployment mechanisms.
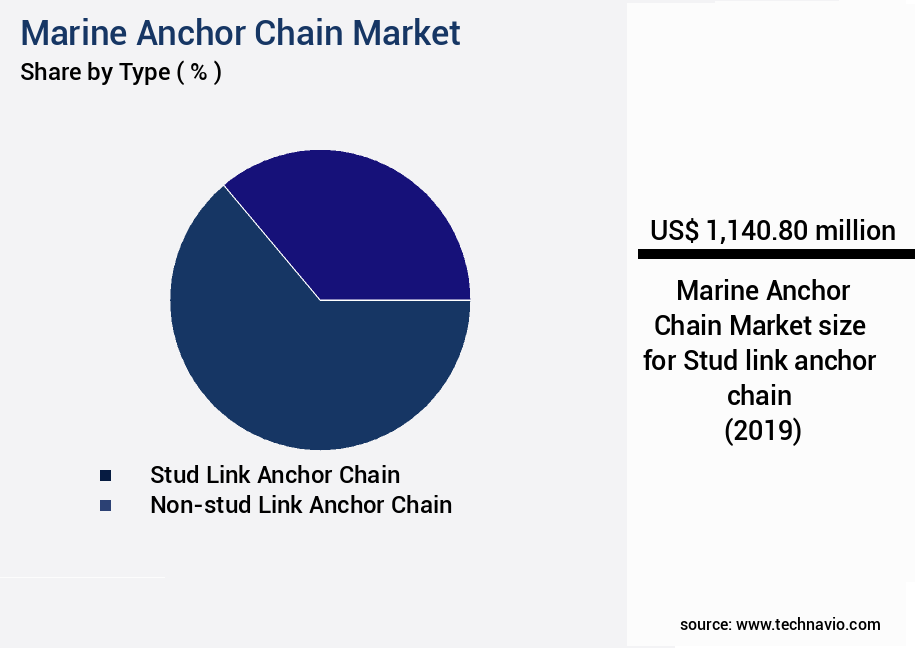
The Stud link anchor chain segment was valued at USD 1140.80 million in 2019 and showed a gradual increase during the forecast period.
The enhancements contribute to the chains' durability and ability to withstand extreme conditions. For instance, stud link chains are subjected to various tests, including impact strength testing, ultrasonic inspection, and visual inspection, to ensure their integrity and reliability. With a focus on extending the chains' lifespan and improving their performance, non-destructive inspection, chain repair, and weld joint integrity assessments are crucial. The market adheres to chain testing standards, such as grade 4 chain and proof coil chain, to maintain uniformity and quality. The market's growth is driven by the increasing demand for secure and efficient anchoring solutions across diverse industries, including fishing, naval, and offshore.
Regional Analysis
APAC is estimated to contribute 50% to the growth of the global market during the forecast period. Technavio's analysts have elaborately explained the regional trends and drivers that shape the market during the forecast period.
See How Marine Anchor Chain Market Demand is Rising in APAC Request Free Sample
The market exhibits a dynamic and evolving nature, with the Asia-Pacific (APAC) region emerging as a significant contributor due to the thriving maritime activities and substantial investments in naval and commercial shipping sectors. The regional economic growth and strategic initiatives in maritime infrastructure are key factors driving the increasing demand for marine anchor chains. For instance, in 2024, the Indian Defense Ministry approved a major warship contract worth approximately USD8.8 billion under Project 17B. This project, involving the construction of several new stealth frigates, will see leading contenders Mazagon Dock Shipbuilders Limited (MDL) and Garden Reach Shipbuilders and Engineers (GRSE) vying for the opportunity.
The market is expected to witness continued growth, with key applications including naval, commercial shipping, and offshore oil and gas industries.
Market Dynamics
Our researchers analyzed the data with 2024 as the base year, along with the key drivers, trends, and challenges. A holistic analysis of drivers will help companies refine their marketing strategies to gain a competitive advantage.
The market caters to the demand for high tensile strength chains used in various applications to secure vessels in harsh marine environments. The material properties of marine grade anchor chain are crucial, with emphasis on resistance to corrosion, ensuring longevity and reliability. Corrosion prevention techniques, such as galvanizing, coating, and alloy selection, play a significant role in maintaining the integrity of anchor chains. Adherence to anchor chain design standards and regulations, including ISO and ABS, is essential for ensuring safety and reliability. Non-destructive testing methods, like ultrasonic testing and magnetic particle inspection, are employed to assess anchor chain condition and identify potential failure modes. Improved inspection techniques, like remote visual inspection and advanced sensors, enable early detection of wear and tear. Environmental conditions, including temperature, humidity, and saltwater exposure, significantly impact anchor chain life. Optimizing maintenance procedures, such as regular cleaning, lubrication, and replacement, is vital for extending chain life. Calculating anchor chain breaking strength and assessing wear and tear are critical aspects of chain management. Understanding failure modes and prevention techniques, including heat treatment and stud link chain design considerations, is essential for minimizing risks. Comparing different anchor chain manufacturing processes, including forged and rolled, and determining chain fatigue life through methods like stress-strain analysis and FEA simulations, are important for selecting the most suitable chain for specific applications. Measuring chain elongation under load and assessing the impact of corrosion on anchor chain strength are essential for maintaining vessel safety. Best practices for anchor chain storage and handling, including proper coating selection and handling procedures, are crucial for ensuring chain longevity. Regulatory compliance for anchor chain manufacturing, including adherence to industry standards and certifications, is essential for ensuring the safety and reliability of marine anchor chains.
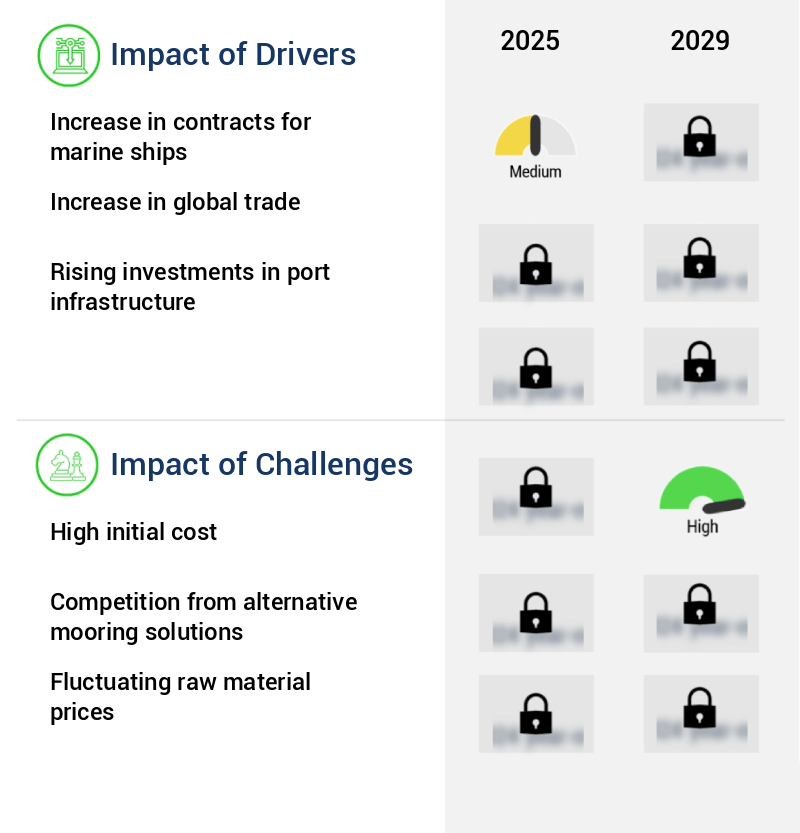
What are the key market drivers leading to the rise in the adoption of Marine Anchor Chain Industry?
- The significant growth in marine shipping contracts serves as the primary catalyst for market expansion.
- The market is undergoing notable expansion due to the escalating demand for marine vessels in both naval and commercial sectors. This growth is attributable to substantial investments in these industries, leading to a heightened need for dependable and robust anchor chains. For instance, the Indian Navy's recent acquisition of six next-generation missile vessels (NGMVs) from Cochin Shipyard Limited (CSL) signifies this trend. These vessels, set for delivery from March 2027, underscore the Indian Navy's dedication to bolstering its maritime capabilities.
- The demand for superior anchor chains is crucial to ensure secure mooring and operational stability for these advanced warships. This illustrates the pivotal role the market plays in the evolving maritime landscape.
What are the market trends shaping the Marine Anchor Chain Industry?
- Offshore wind farm development is currently the prevailing market trend. This sector is poised for significant growth.
- The market is undergoing a transformation, fueled by the growing emphasis on renewable energy and the imperative to decrease carbon emissions. One notable trend is the development of new offshore wind farms, which are increasingly being integrated into the global energy landscape. For example, TotalEnergies initiated a floating offshore wind pilot project in the North Sea, UK, in August 2024. This groundbreaking endeavor aims to provide renewable electricity to an offshore oil and gas platform, illustrating the potential of merging renewable energy solutions with traditional infrastructure.
- The implementation of floating offshore wind turbines necessitates sturdy and dependable anchor chains to ensure their stability and safety in challenging marine conditions.
What challenges does the Marine Anchor Chain Industry face during its growth?
- The high initial costs represent a significant challenge impeding the expansion and growth of the industry.
- Marine anchor chains are essential components in maritime operations, available in various lengths, materials, and types to cater to diverse applications. The cost of marine anchor chains can significantly vary, influenced by these factors. For instance, a standard galvanized steel anchor chain, measuring ½-inch in diameter and 50 feet in length, falls within the price range of USD 50 to USD 150. However, opting for higher-quality materials like stainless steel can increase the cost to USD 150 to USD 300 for the same size, offering enhanced corrosion resistance and durability.
- The most premium option, a high-strength, corrosion-resistant anchor chain, can cost between USD 300 and USD 600 for the same dimensions.
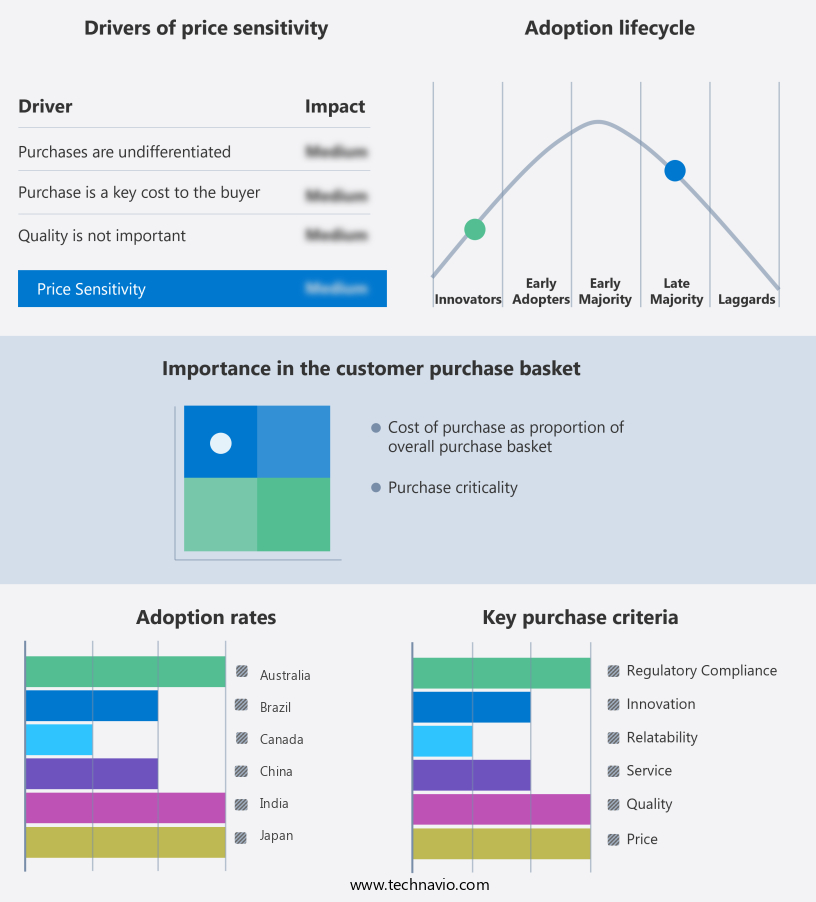
Exclusive Technavio Analysis on Customer Landscape
The marine anchor chain market forecasting report includes the adoption lifecycle of the market, covering from the innovator's stage to the laggard's stage. It focuses on adoption rates in different regions based on penetration. Furthermore, the marine anchor chain market report also includes key purchase criteria and drivers of price sensitivity to help companies evaluate and develop their market growth analysis strategies.
Customer Landscape of Marine Anchor Chain Industry
Competitive Landscape
Companies are implementing various strategies, such as strategic alliances, marine anchor chain market forecast, partnerships, mergers and acquisitions, geographical expansion, and product/service launches, to enhance their presence in the industry.
Calvey Marine Limited - This marine anchor chain manufacturer ensures stringent quality control through testing methods like Ultrasonic Testing (UT) and Magnetic Particle Inspection (MT).
The industry research and growth report includes detailed analyses of the competitive landscape of the market and information about key companies, including:
- Calvey Marine Limited
- China Deyuan Marine Fitting Co.ltd.
- China Shipping Anchor Chain Jiangsu Co.Ltd
- Chongqing Acir Marine Co. Ltd.
- Chongqing Hi Sea Marine Equipment Import and Export Co Ltd
- Damen Shipyards Group
- Dawson Group Ltd.
- Fuente International Co Ltd
- Jiangsu Asian Star Anchor Chain Co Ltd
- Jimmy Green Marine
- JinTan Lead Marine Equipment Co.Ltd.
- Ketten Walder GmbH
- Lister Chain and Forge Inc
- Marit
- Qingdao Anchor Chain Co. Ltd.
- Qingdao Wancheng Anchor Chain Co Ltd
- Saxton Marine
- VICINAY Group
- Zhenjiang Matchau Marine Equipment Co Ltd
- Zhuhai Weitong Import and Export Co. Ltd
Qualitative and quantitative analysis of companies has been conducted to help clients understand the wider business environment as well as the strengths and weaknesses of key industry players. Data is qualitatively analyzed to categorize companies as pure play, category-focused, industry-focused, and diversified; it is quantitatively analyzed to categorize companies as dominant, leading, strong, tentative, and weak.
Recent Development and News in Marine Anchor Chain Market
- In January 2024, Fortune Marine Group, a leading marine equipment manufacturer, introduced its new high-strength anchor chain, Fortress X, at the International Workboat Show. This development marked a significant advancement in anchor chain technology, offering increased durability and resistance to corrosion (Fortune Marine Group press release).
- In March 2024, Wartsila, a Finnish technology group, announced a strategic partnership with Marlink, a global connectivity provider. The collaboration aimed to integrate Wartsila's advanced marine technology with Marlink's communication solutions, enhancing the safety and efficiency of anchor handling operations at sea (Wartsila press release).
- In May 2024, Forge Industries, a US-based manufacturer of high-performance alloys, completed a USD 50 million Series B funding round. The investment will be used to expand production capacity and research and development efforts for marine anchor chains made from Forge's proprietary alloys, aiming to capture a larger market share (Forge Industries press release).
- In April 2025, the International Maritime Organization (IMO) adopted new regulations on anchor chain safety. The regulations require regular inspections and mandatory replacement of anchor chains after a specified period, driving demand for high-quality and durable anchor chains (IMO press release).
Dive into Technavio's robust research methodology, blending expert interviews, extensive data synthesis, and validated models for unparalleled Marine Anchor Chain Market insights. See full methodology.
|
Market Scope |
|
|
Report Coverage |
Details |
|
Page number |
198 |
|
Base year |
2024 |
|
Historic period |
2019-2023 |
|
Forecast period |
2025-2029 |
|
Growth momentum & CAGR |
Accelerate at a CAGR of 4.4% |
|
Market growth 2025-2029 |
USD 505.5 million |
|
Market structure |
Fragmented |
|
YoY growth 2024-2025(%) |
4.3 |
|
Key countries |
US, China, Japan, South Korea, Canada, Norway, India, Australia, UK, and Brazil |
|
Competitive landscape |
Leading Companies, Market Positioning of Companies, Competitive Strategies, and Industry Risks |
Research Analyst Overview
- The market continues to evolve, driven by advancements in technology and increasing demand across various sectors. Anchor chain design has seen significant progress with the adoption of high tensile chains, which offer enhanced strength and durability. These chains undergo rigorous testing, including fatigue life prediction and impact strength testing, to ensure their performance in harsh marine environments. One example of this market's dynamism is the implementation of non-destructive inspection methods, such as ultrasonic inspection and visual inspection, for chain repair and maintenance. This approach allows for the identification and resolution of potential issues without compromising the chain's integrity.
- Moreover, the use of corrosion resistance coatings, such as thermal spray coatings and galvanization process, has gained traction to extend the chain's lifespan and improve its resistance to environmental factors. The marine grade steel used in chain manufacturing undergoes stringent material specifications and processes, including shot blasting, heat treatment, and proof coil chain testing, to ensure optimal strength and reliability. The market is expected to grow at a robust pace, with industry growth estimates reaching over 5% annually. This expansion is fueled by the continuous development of new chain designs, testing standards, and deployment mechanisms, ensuring the market remains a vital component in the maritime industry.
What are the Key Data Covered in this Marine Anchor Chain Market Research and Growth Report?
-
What is the expected growth of the Marine Anchor Chain Market between 2025 and 2029?
-
USD 505.5 million, at a CAGR of 4.4%
-
-
What segmentation does the market report cover?
-
The report is segmented by Type (Stud link anchor chain and Non-stud link anchor chain), Product (Commercial shipping, Offshore oil and gas, Naval and military, and Others), and Geography (APAC, Europe, North America, Middle East and Africa, and South America)
-
-
Which regions are analyzed in the report?
-
APAC, Europe, North America, Middle East and Africa, and South America
-
-
What are the key growth drivers and market challenges?
-
Increase in contracts for marine ships, High initial cost
-
-
Who are the major players in the Marine Anchor Chain Market?
-
Calvey Marine Limited, China Deyuan Marine Fitting Co.ltd., China Shipping Anchor Chain Jiangsu Co.Ltd, Chongqing Acir Marine Co. Ltd., Chongqing Hi Sea Marine Equipment Import and Export Co Ltd, Damen Shipyards Group, Dawson Group Ltd., Fuente International Co Ltd, Jiangsu Asian Star Anchor Chain Co Ltd, Jimmy Green Marine, JinTan Lead Marine Equipment Co.Ltd., Ketten Walder GmbH, Lister Chain and Forge Inc, Marit, Qingdao Anchor Chain Co. Ltd., Qingdao Wancheng Anchor Chain Co Ltd, Saxton Marine, VICINAY Group, Zhenjiang Matchau Marine Equipment Co Ltd, and Zhuhai Weitong Import and Export Co. Ltd
-
Market Research Insights
- The market is a dynamic and continually evolving industry, encompassing various aspects such as chain life, maintenance, and manufacturing. Two key data points illustrate the market's significance. First, the average service life of a marine anchor chain is approximately 15 years, with regular inspection and maintenance extending its lifespan. Second, industry analysts anticipate a growth rate of around 3% annually over the next decade. For instance, a shipping company experienced a 5% increase in sales due to the implementation of improved handling procedures and testing equipment for their marine anchor chains. This investment not only enhanced the safety of their operations but also reduced the frequency of component failure and associated costs.
- Moreover, environmental factors, material composition, and design specifications play crucial roles in the market. Proper storage practices, adherence to safety regulations, and effective risk assessment are essential to ensuring the longevity and reliability of these critical components.
We can help! Our analysts can customize this marine anchor chain market research report to meet your requirements.
 RIA -
RIA - 
