Marine Mining Market Analysis North America, Europe, APAC, South America, Middle East and Africa - US, China, Germany, Norway, France - Size and Forecast 2024-2028

Marine Mining Market Analysis North America, Europe, APAC, South America, Middle East and Africa - US, China, Germany, Norway, France - Size and Forecast 2024-2028

Published: May 2024 160 Pages SKU: IRTNTR77545

Market Overview at a Glance

$8.25 B
Market Opportunity
33.98%
CAGR
33.73
YoY growth 2023-2024(%)

Marine Mining Market Size 2024-2028 

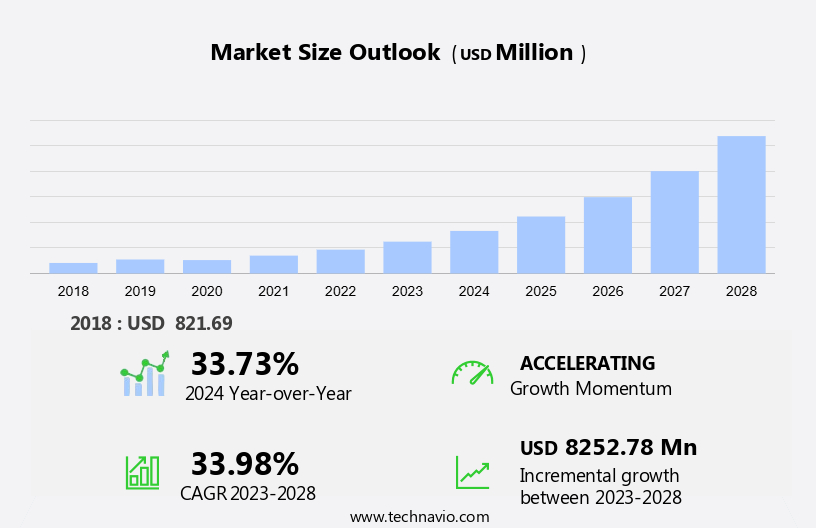
The marine mining market size is forecast to increase by USD 8.25 billion at a CAGR of 33.98% between 2023 and 2028.

  • The market is experiencing significant growth due to the depletion of terrestrial deposits and the increasing demand for resources used in the production of green technologies, such as underwater mining for marine phosphate and sand. The advantages of marine mining include access to vast deposits and reduced environmental impact compared to terrestrial mining. However, there are also disadvantages, including the high cost of underwater mining operations and the potential for negative environmental impacts. One trend driving the market is the growing focus on energy transition and renewable technologies, which require an increasing amount of raw materials. For instance, the production of smartphones, wind turbines, solar panels, and electric storage batteries relies heavily on minerals obtained from the seabed. Advancements in marine mining technologies, such as autonomous underwater vehicles and remote-operated mining systems, are helping to mitigate the environmental impact of these operations. 

What will the size of the market be during the forecast period?

Marine Mining Market Size

 Request Free Sample

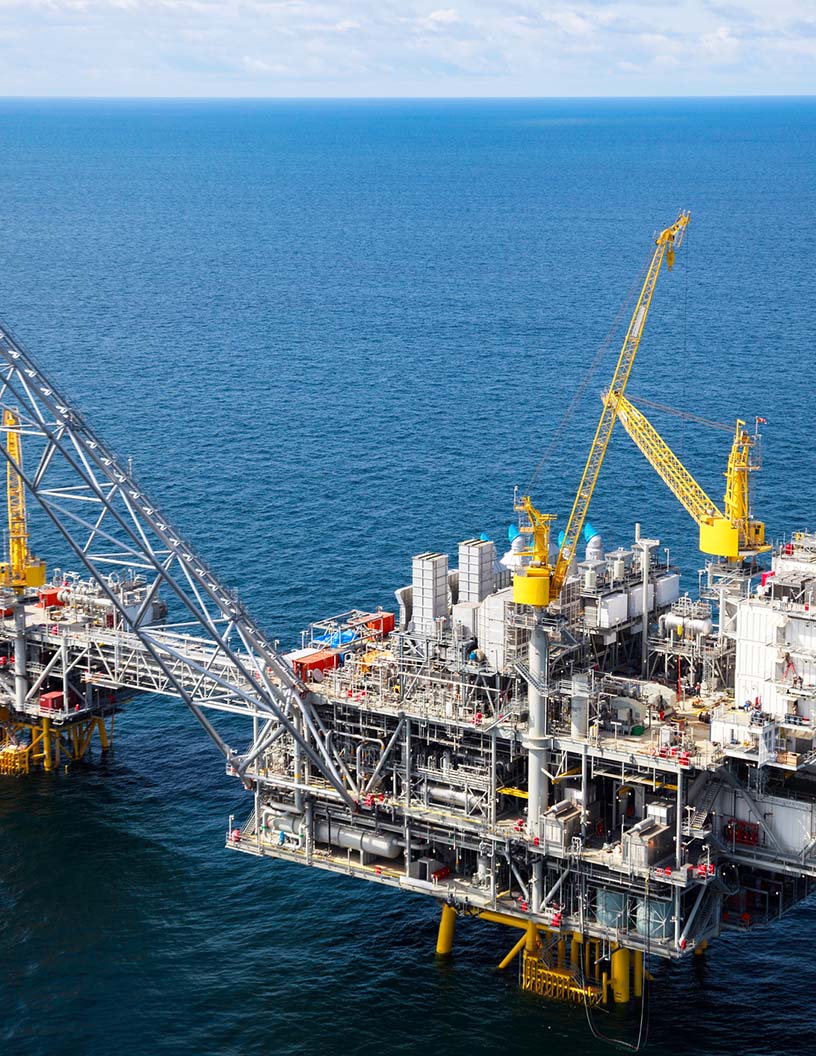
  • The market encompasses the extraction of various minerals and metals from the sea and ocean floors. This practice has gained significant attention due to the depletion of terrestrial mineral deposits and the increasing demand for resources essential to modern industries. Mineral deposits in the marine environment include metals such as gold, silver, copper, manganese, and elements critical for green technologies like deep-sea phosphate, essential for fertilizers, and rare earth elements used in smartphones, wind turbines, solar panels, and electric storage batteries. The sea and ocean floors harbor vast reserves of these resources.
  • For instance, the marine crust is estimated to contain over 16 billion tons of copper, 130 million tons of gold, and 1.5 billion tons of manganese. These reserves could potentially meet the world's demand for these resources for decades to come. Underwater mining techniques have evolved to cater to the extraction of these minerals from the deep-sea environment. Marine phosphate mining involves the extraction of phosphate nodules from the seabed, while marine sand mining targets sand and gravel deposits. Deep-sea mining, a relatively new concept, focuses on extracting minerals from the ocean floor at depths of over 200 meters.

How is this market segmented and which is the largest segment?

The market research report provides comprehensive data (region-wise segment analysis), with forecasts and estimates in "USD million" for the period 2024-2028, as well as historical data from 2018-2022 for the following segments.

  • Application
    • Precious metals
    • Automotive
    • Oil and gas
    • Electronics
    • Construction
  • Technology
    • Remotely operated vehicles (ROVs)
    • Sonar
    • Marine seismic methods
  • Geography
    • North America
      • US
    • Europe
      • Germany
      • France
      • Norway
    • APAC
      • China
    • South America
    • Middle East and Africa

By Application Insights

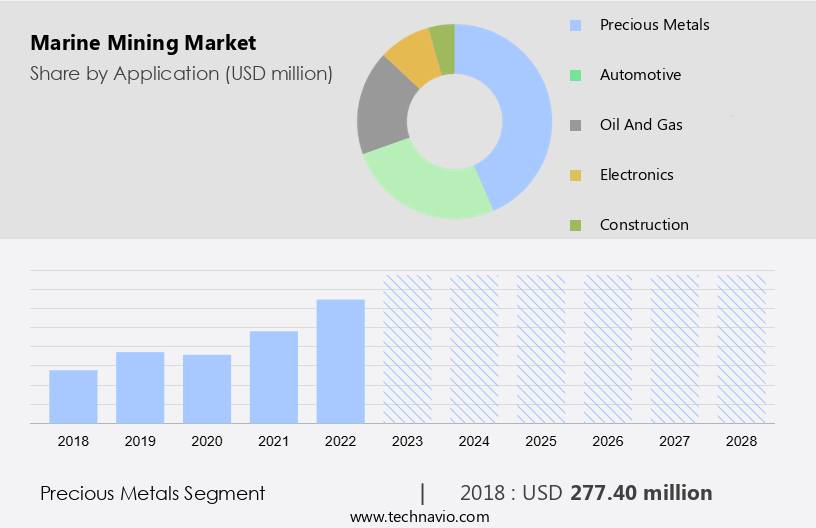
  • The precious metals segment is estimated to witness significant growth during the forecast period.

The expansion of economies worldwide has led to an escalating demand for precious metals, which are indispensable in numerous industries, including jewelry, electronics, automotive, and aerospace. As economies prosper, so does the requirement for commodities like gold, silver, and platinum, fueling curiosity about marine mining as a potential alternative source for these metals. Traditional terrestrial mines are experiencing depletion and dwindling ore grades, making it increasingly difficult and costly to extract precious metals from land. Consequently, the exploration and extraction of precious metals from marine environments represent a promising new avenue for fulfilling the global demand for these valuable elements.

Furthermore, the pricing of precious metals, including gold, silver, platinum, and palladium, is subject to market influences, including supply-demand fundamentals, investor sentiment, inflationary pressures, and geopolitical factors. The marine mining industry, specifically deep-sea mining, is gaining traction as a potential solution to address the supply constraints in terrestrial mines. This sector focuses on extracting precious metals and elements from the marine crust and deep-sea reserves. Deep-sea diamond mining is a subset of this industry, which has garnered significant attention due to the potential abundance of these precious gems on the ocean floor. The aftermarket industry for automobiles, which includes the sale of replacement parts and services, is another significant consumer of precious metals.

Marine Mining Market Size

Get a glance at the market report of share of various segments Request Free Sample

The precious metals segment was valued at USD 277.40 million in 2018 and showed a gradual increase during the forecast period.

Regional Analysis

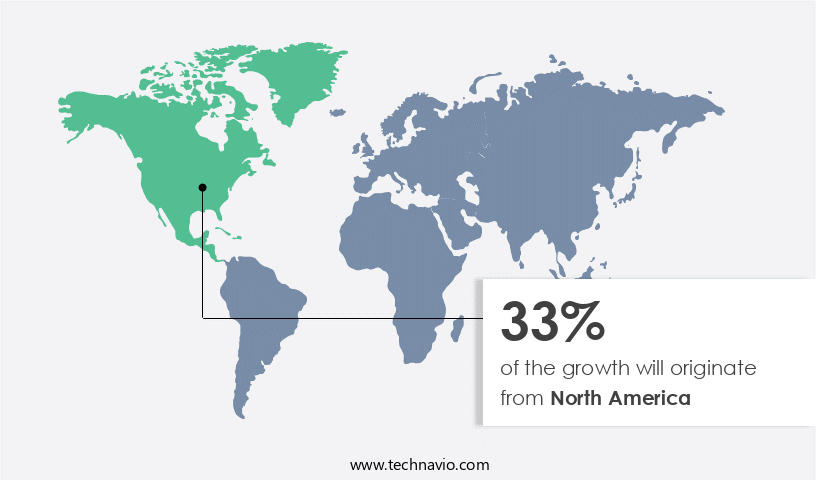
  • North America is estimated to contribute 33% to the growth of the global market during the forecast period.

Technavio's analysts have elaborately explained the regional trends and drivers that shape the market during the forecast period.

Marine Mining Market Share by Geography

For more insights on the market share of various regions Request Free Sample

The market is experiencing significant growth in North America due to the increasing demand for essential minerals and resources, particularly in the areas of electric vehicle batteries, renewable energy technologies, and electronic devices. As terrestrial sources of critical minerals such as cobalt, lithium, and nickel become depleted, the focus on deep-sea mining for alternatives has intensified. The seabed mining process involves the extraction of minerals from the sea floor, with various sites including polymetallic nodules, cobalt-rich ferromanganese crusts, and hydrothermal vents. Miniaturization of electronic devices and the shift towards renewable energy have increased the demand for these minerals, making marine mining a promising industry in North America. The depth of these mining sites can vary, with some reaching over 16,000 feet, requiring advanced technology and equipment for exploration and extraction. 

Market Dynamics

Our researchers analyzed the data with 2023 as the base year, along with the key drivers, trends, and challenges. A holistic analysis of drivers will help companies refine their marketing strategies to gain a competitive advantage.

What are the key market drivers leading to the rise in the adoption of the Marine Mining Market?

Growing focus on energy transition and renewable technologies is the key driver of the market.

  • Marine mining has emerged as a potential solution to meet the increasing demand for critical minerals, such as silver, gold, copper, manganese, and others, which are essential for the production of various metals and minerals used in industries and renewable energy technologies. The sea and ocean hold vast mineral deposits, including polymetallic nodules, seafloor massive sulfides (SMS), and cobalt-rich ferromanganese crusts.
  • These deposits are crucial for manufacturing batteries, magnets, and other components of renewable energy systems, like wind turbines, solar panels, and electric vehicle. With the growing emphasis on renewable energy and sustainability, the demand for these minerals is expected to rise. Marine mining offers access to these strategic resources, enabling the advancement of energy transition initiatives and the achievement of sustainability goals.

What are the market trends shaping the Marine Mining Market?

Advancements in marine mining technologies is the upcoming trend in the market.

  • Marine mining, specifically underwater mining of resources such as marine phosphate and sand, has gained significant attention due to the depletion of terrestrial deposits. The use of advanced technologies, including ROVs and Autonomous Underwater Vehicles (AUVs), has improved the efficiency and safety of these mining operations. ROVs, remotely operated underwater vehicles, offer enhanced maneuverability, endurance, and capabilities, enabling precise exploration, mapping, and extraction of mineral deposits in deep-sea environments. AUVs, self-propelled, untethered vehicles, operate autonomously without human intervention, equipped with sensors and navigation systems that enable data collection, surveys, and seabed mapping with high accuracy.
  • The expansion of AUV technology has broadened its applications in marine mining, environmental monitoring, and resource assessment, fueling the demand for marine mining. ROVs and AUVs equipped with advanced sensors, cameras, and manipulator arms are indispensable tools for exploring and extracting mineral resources from the seabed. The integration of green technologies, such as wind turbines, solar panels, and electric storage batteries, in marine mining operations further enhances their sustainability and reduces their environmental impact. Despite the advantages, marine mining faces challenges, including regulatory frameworks, high capital costs, and potential environmental concerns. However, ongoing research and technological advancements continue to address these challenges and drive the growth of the market. 

What challenges does the Marine Mining Market face during the growth?

The environmental impact of marine mining operations is a key challenge affecting the market growth.

  • Marine mining for resources such as Cobalt and Zinc in the Pacific and Indian Oceans, as well as the Mid-Atlantic Ridge, involves various activities including exploration, contracts, and extraction. However, these operations can pose significant risks to marine ecosystems. Seabed mining techniques like dredging and sediment removal can destroy and alter benthic habitats, including coral reefs, sponge beds, and deep-sea vent ecosystems. Sediment plumes generated from these activities can smother benthic organisms, change sediment composition, and decrease water clarity, negatively impacting marine species that thrive in clear waters.
  • Additionally, biodiversity loss can occur due to the removal or disturbance of habitat-forming species and disrupted ecological processes. Furthermore, marine mining activities generate noise from equipment, vessels, and operations, which can disturb marine life and interfere with their communication, navigation, and behavior. It is crucial to consider the potential environmental consequences and implement measures to minimize the adverse impacts on marine ecosystems and the species they support.

Exclusive Customer Landscape

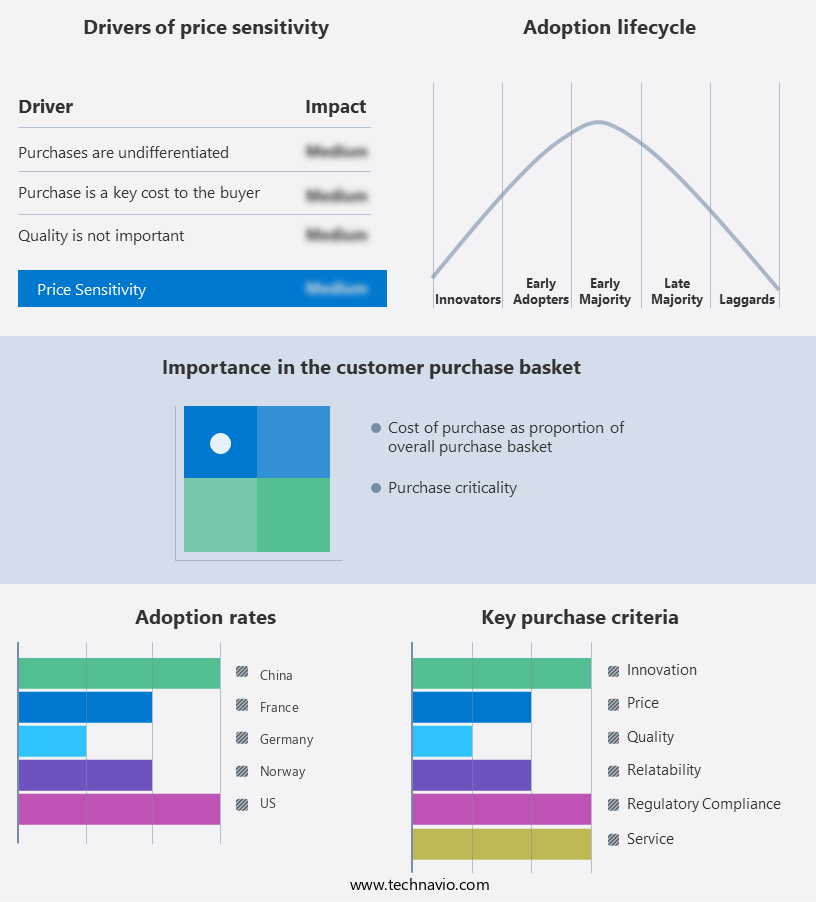
The market forecasting report includes the adoption lifecycle of the market, covering from the innovator's stage to the laggard's stage. It focuses on adoption rates in different regions based on penetration. Furthermore, the market report also includes key purchase criteria and drivers of price sensitivity to help companies evaluate and develop their market growth analysis strategies.

Marine Mining Market Share by Geography

 Customer Landscape

Key Companies & Market Insights

Companies are implementing various strategies, such as strategic alliances, market forecast, partnerships, mergers and acquisitions, geographical expansion, and product/service launches, to enhance their presence in the market. The market research and growth report includes detailed analyses of the competitive landscape of the market and information about key companies, including:

  • AP Moller Maersk AS
  • China Minmetals Corp.
  • Collier Consulting Inc.
  • De Beers Corp.
  • Deep Ocean Engineering Inc.
  • DEME NV
  • DFR Gold Inc.
  • Groupe Gorge
  • Loke Marine Minerals AS
  • Ocean Minerals LLC
  • RJE International Inc.
  • Royal IHC
  • SAMS Enterprise Ltd
  • Specialist Machine Developments Ltd.
  • TMC The Metal Co. Inc.

Qualitative and quantitative analysis of companies has been conducted to help clients understand the wider business environment as well as the strengths and weaknesses of key market players. Data is qualitatively analyzed to categorize companies as pure play, category-focused, industry-focused, and diversified; it is quantitatively analyzed to categorize companies as dominant, leading, strong, tentative, and weak.

Research Analyst Overview

Marine mining refers to the process of extracting minerals and metals from the ocean floor. The sea and ocean hold vast mineral deposits, including silver, gold, copper, manganese, cobalt, zinc, and other elements. These deposits are found in various locations, such as the Pacific Ocean, Indian Ocean, and mid-atlantic ridge. Underwater mining techniques include marine phosphate mining and marine sand mining. The depleting terrestrial deposits have led to an increased interest in marine mining for various applications, including the production of electronic components, green technologies, and materials for industries like automobile manufacturing and the aftermarket industry. Advantages of marine mining include the availability of large mineral reserves, reduced environmental impact compared to terrestrial mines, and the potential for discovering rare metals like yttrium and rare earth elements.

Furthermore, disadvantages include the high costs of exploration and the challenges of operating in deep-sea environments, such as extreme pressure and temperature conditions. The expansion of economies worldwide has led to an escalating demand for precious metals, which are indispensable in numerous industries, including jewelry, consumer electronics, automotive, and aerospace. Deep-sea mining techniques include the mining of polymetallic nodules, polymetallic sulfides, and cobalt-rich ferromanganese crusts. The mineral extraction process involves using autonomous vehicles, drills, and cutting tools to extract minerals from the ocean floor. Hydrothermal vents, magma, seawater, sediment, and precipitate are all used in the mining process to obtain solids and concentrations of valuable minerals and metals.

Market Scope

Report Coverage

Details

Page number

160

Base year

2023

Historic period

2018-2022

Forecast period

2024-2028

Growth momentum & CAGR

Accelerate at a CAGR of 33.98%

Market Growth 2024-2028

USD 8.25 billion

Market structure

Fragmented

YoY growth 2023-2024(%)

33.73

Key countries

US, China, Germany, Norway, and France

Competitive landscape

Leading Companies, Market Positioning of Companies, Competitive Strategies, and Industry Risks

Request Free Sample

What are the Key Data Covered in this Market Research and Growth Report?

  • CAGR of the market during the forecast period
  • Detailed information on factors that will drive the market growth and forecasting between 2024 and 2028
  • Precise estimation of the size of the market  and its contribution of the market in focus to the parent market
  • Accurate predictions about upcoming market growth and trends and changes in consumer behaviour
  • Growth of the market across North America, Europe, APAC, South America, and Middle East and Africa
  • Thorough analysis of the market's competitive landscape and detailed information about companies
  • Comprehensive analysis of factors that will challenge the growth of market companies

We can help! Our analysts can customize this market research report to meet your requirements. Get in touch

1 Executive Summary

  • 1.1 Market overview
    • Exhibit 01: Executive Summary – Chart on Market Overview
    • Exhibit 02: Executive Summary – Data Table on Market Overview
    • Exhibit 03: Executive Summary – Chart on Global Market Characteristics
    • Exhibit 04: Executive Summary – Chart on Market by Geography
    • Exhibit 05: Executive Summary – Chart on Market Segmentation by Application
    • Exhibit 06: Executive Summary – Chart on Market Segmentation by Technology
    • Exhibit 07: Executive Summary – Chart on Incremental Growth
    • Exhibit 08: Executive Summary – Data Table on Incremental Growth
    • Exhibit 09: Executive Summary – Chart on Vendor Market Positioning

2 Market Landscape

  • 2.1 Market ecosystem
    • Exhibit 10: Parent market
    • Exhibit 11: Market Characteristics

3 Market Sizing

  • 3.1 Market definition
    • Exhibit 12: Offerings of vendors included in the market definition
  • 3.2 Market segment analysis
    • Exhibit 13: Market segments
  • 3.3 Market size 2023
    • 3.4 Market outlook: Forecast for 2023-2028
      • Exhibit 14: Chart on Global - Market size and forecast 2023-2028 ($ million)
      • Exhibit 15: Data Table on Global - Market size and forecast 2023-2028 ($ million)
      • Exhibit 16: Chart on Global Market: Year-over-year growth 2023-2028 (%)
      • Exhibit 17: Data Table on Global Market: Year-over-year growth 2023-2028 (%)

    4 Historic Market Size

    • 4.1 Global marine mining market 2018 - 2022
      • Exhibit 18: Historic Market Size – Data Table on global marine mining market 2018 - 2022 ($ million)
    • 4.2 Application Segment Analysis 2018 - 2022
      • Exhibit 19: Historic Market Size – Application Segment 2018 - 2022 ($ million)
    • 4.3 Technology Segment Analysis 2018 - 2022
      • Exhibit 20: Historic Market Size – Technology Segment 2018 - 2022 ($ million)
    • 4.4 Geography Segment Analysis 2018 - 2022
      • Exhibit 21: Historic Market Size – Geography Segment 2018 - 2022 ($ million)
    • 4.5 Country Segment Analysis 2018 - 2022
      • Exhibit 22: Historic Market Size – Country Segment 2018 - 2022 ($ million)

    5 Five Forces Analysis

    • 5.1 Five forces summary
      • Exhibit 23: Five forces analysis - Comparison between 2023 and 2028
    • 5.2 Bargaining power of buyers
      • Exhibit 24: Chart on Bargaining power of buyers – Impact of key factors 2023 and 2028
    • 5.3 Bargaining power of suppliers
      • Exhibit 25: Bargaining power of suppliers – Impact of key factors in 2023 and 2028
    • 5.4 Threat of new entrants
      • Exhibit 26: Threat of new entrants – Impact of key factors in 2023 and 2028
    • 5.5 Threat of substitutes
      • Exhibit 27: Threat of substitutes – Impact of key factors in 2023 and 2028
    • 5.6 Threat of rivalry
      • Exhibit 28: Threat of rivalry – Impact of key factors in 2023 and 2028
    • 5.7 Market condition
      • Exhibit 29: Chart on Market condition - Five forces 2023 and 2028

    6 Market Segmentation by Application

    • 6.1 Market segments
      • Exhibit 30: Chart on Application - Market share 2023-2028 (%)
      • Exhibit 31: Data Table on Application - Market share 2023-2028 (%)
    • 6.2 Comparison by Application
      • Exhibit 32: Chart on Comparison by Application
      • Exhibit 33: Data Table on Comparison by Application
    • 6.3 Precious metals - Market size and forecast 2023-2028
      • Exhibit 34: Chart on Precious metals - Market size and forecast 2023-2028 ($ million)
      • Exhibit 35: Data Table on Precious metals - Market size and forecast 2023-2028 ($ million)
      • Exhibit 36: Chart on Precious metals - Year-over-year growth 2023-2028 (%)
      • Exhibit 37: Data Table on Precious metals - Year-over-year growth 2023-2028 (%)
    • 6.4 Automotive - Market size and forecast 2023-2028
      • Exhibit 38: Chart on Automotive - Market size and forecast 2023-2028 ($ million)
      • Exhibit 39: Data Table on Automotive - Market size and forecast 2023-2028 ($ million)
      • Exhibit 40: Chart on Automotive - Year-over-year growth 2023-2028 (%)
      • Exhibit 41: Data Table on Automotive - Year-over-year growth 2023-2028 (%)
    • 6.5 Oil and gas - Market size and forecast 2023-2028
      • Exhibit 42: Chart on Oil and gas - Market size and forecast 2023-2028 ($ million)
      • Exhibit 43: Data Table on Oil and gas - Market size and forecast 2023-2028 ($ million)
      • Exhibit 44: Chart on Oil and gas - Year-over-year growth 2023-2028 (%)
      • Exhibit 45: Data Table on Oil and gas - Year-over-year growth 2023-2028 (%)
    • 6.6 Electronics - Market size and forecast 2023-2028
      • Exhibit 46: Chart on Electronics - Market size and forecast 2023-2028 ($ million)
      • Exhibit 47: Data Table on Electronics - Market size and forecast 2023-2028 ($ million)
      • Exhibit 48: Chart on Electronics - Year-over-year growth 2023-2028 (%)
      • Exhibit 49: Data Table on Electronics - Year-over-year growth 2023-2028 (%)
    • 6.7 Construction - Market size and forecast 2023-2028
      • Exhibit 50: Chart on Construction - Market size and forecast 2023-2028 ($ million)
      • Exhibit 51: Data Table on Construction - Market size and forecast 2023-2028 ($ million)
      • Exhibit 52: Chart on Construction - Year-over-year growth 2023-2028 (%)
      • Exhibit 53: Data Table on Construction - Year-over-year growth 2023-2028 (%)
    • 6.8 Market opportunity by Application
      • Exhibit 54: Market opportunity by Application ($ million)
      • Exhibit 55: Data Table on Market opportunity by Application ($ million)

    7 Market Segmentation by Technology

    • 7.1 Market segments
      • Exhibit 56: Chart on Technology - Market share 2023-2028 (%)
      • Exhibit 57: Data Table on Technology - Market share 2023-2028 (%)
    • 7.2 Comparison by Technology
      • Exhibit 58: Chart on Comparison by Technology
      • Exhibit 59: Data Table on Comparison by Technology
    • 7.3 Remotely operated vehicles (ROVs) - Market size and forecast 2023-2028
      • Exhibit 60: Chart on Remotely operated vehicles (ROVs) - Market size and forecast 2023-2028 ($ million)
      • Exhibit 61: Data Table on Remotely operated vehicles (ROVs) - Market size and forecast 2023-2028 ($ million)
      • Exhibit 62: Chart on Remotely operated vehicles (ROVs) - Year-over-year growth 2023-2028 (%)
      • Exhibit 63: Data Table on Remotely operated vehicles (ROVs) - Year-over-year growth 2023-2028 (%)
    • 7.4 Sonar - Market size and forecast 2023-2028
      • Exhibit 64: Chart on Sonar - Market size and forecast 2023-2028 ($ million)
      • Exhibit 65: Data Table on Sonar - Market size and forecast 2023-2028 ($ million)
      • Exhibit 66: Chart on Sonar - Year-over-year growth 2023-2028 (%)
      • Exhibit 67: Data Table on Sonar - Year-over-year growth 2023-2028 (%)
    • 7.5 Marine seismic methods - Market size and forecast 2023-2028
      • Exhibit 68: Chart on Marine seismic methods - Market size and forecast 2023-2028 ($ million)
      • Exhibit 69: Data Table on Marine seismic methods - Market size and forecast 2023-2028 ($ million)
      • Exhibit 70: Chart on Marine seismic methods - Year-over-year growth 2023-2028 (%)
      • Exhibit 71: Data Table on Marine seismic methods - Year-over-year growth 2023-2028 (%)
    • 7.6 Market opportunity by Technology
      • Exhibit 72: Market opportunity by Technology ($ million)
      • Exhibit 73: Data Table on Market opportunity by Technology ($ million)

    8 Customer Landscape

    • 8.1 Customer landscape overview
      • Exhibit 74: Analysis of price sensitivity, lifecycle, customer purchase basket, adoption rates, and purchase criteria

    9 Geographic Landscape

    • 9.1 Geographic segmentation
      • Exhibit 75: Chart on Market share by geography 2023-2028 (%)
      • Exhibit 76: Data Table on Market share by geography 2023-2028 (%)
    • 9.2 Geographic comparison
      • Exhibit 77: Chart on Geographic comparison
      • Exhibit 78: Data Table on Geographic comparison
    • 9.3 North America - Market size and forecast 2023-2028
      • Exhibit 79: Chart on North America - Market size and forecast 2023-2028 ($ million)
      • Exhibit 80: Data Table on North America - Market size and forecast 2023-2028 ($ million)
      • Exhibit 81: Chart on North America - Year-over-year growth 2023-2028 (%)
      • Exhibit 82: Data Table on North America - Year-over-year growth 2023-2028 (%)
    • 9.4 Europe - Market size and forecast 2023-2028
      • Exhibit 83: Chart on Europe - Market size and forecast 2023-2028 ($ million)
      • Exhibit 84: Data Table on Europe - Market size and forecast 2023-2028 ($ million)
      • Exhibit 85: Chart on Europe - Year-over-year growth 2023-2028 (%)
      • Exhibit 86: Data Table on Europe - Year-over-year growth 2023-2028 (%)
    • 9.5 APAC - Market size and forecast 2023-2028
      • Exhibit 87: Chart on APAC - Market size and forecast 2023-2028 ($ million)
      • Exhibit 88: Data Table on APAC - Market size and forecast 2023-2028 ($ million)
      • Exhibit 89: Chart on APAC - Year-over-year growth 2023-2028 (%)
      • Exhibit 90: Data Table on APAC - Year-over-year growth 2023-2028 (%)
    • 9.6 South America - Market size and forecast 2023-2028
      • Exhibit 91: Chart on South America - Market size and forecast 2023-2028 ($ million)
      • Exhibit 92: Data Table on South America - Market size and forecast 2023-2028 ($ million)
      • Exhibit 93: Chart on South America - Year-over-year growth 2023-2028 (%)
      • Exhibit 94: Data Table on South America - Year-over-year growth 2023-2028 (%)
    • 9.7 Middle East and Africa - Market size and forecast 2023-2028
      • Exhibit 95: Chart on Middle East and Africa - Market size and forecast 2023-2028 ($ million)
      • Exhibit 96: Data Table on Middle East and Africa - Market size and forecast 2023-2028 ($ million)
      • Exhibit 97: Chart on Middle East and Africa - Year-over-year growth 2023-2028 (%)
      • Exhibit 98: Data Table on Middle East and Africa - Year-over-year growth 2023-2028 (%)
    • 9.8 US - Market size and forecast 2023-2028
      • Exhibit 99: Chart on US - Market size and forecast 2023-2028 ($ million)
      • Exhibit 100: Data Table on US - Market size and forecast 2023-2028 ($ million)
      • Exhibit 101: Chart on US - Year-over-year growth 2023-2028 (%)
      • Exhibit 102: Data Table on US - Year-over-year growth 2023-2028 (%)
    • 9.9 China - Market size and forecast 2023-2028
      • Exhibit 103: Chart on China - Market size and forecast 2023-2028 ($ million)
      • Exhibit 104: Data Table on China - Market size and forecast 2023-2028 ($ million)
      • Exhibit 105: Chart on China - Year-over-year growth 2023-2028 (%)
      • Exhibit 106: Data Table on China - Year-over-year growth 2023-2028 (%)
    • 9.10 Germany - Market size and forecast 2023-2028
      • Exhibit 107: Chart on Germany - Market size and forecast 2023-2028 ($ million)
      • Exhibit 108: Data Table on Germany - Market size and forecast 2023-2028 ($ million)
      • Exhibit 109: Chart on Germany - Year-over-year growth 2023-2028 (%)
      • Exhibit 110: Data Table on Germany - Year-over-year growth 2023-2028 (%)
    • 9.11 Norway - Market size and forecast 2023-2028
      • Exhibit 111: Chart on Norway - Market size and forecast 2023-2028 ($ million)
      • Exhibit 112: Data Table on Norway - Market size and forecast 2023-2028 ($ million)
      • Exhibit 113: Chart on Norway - Year-over-year growth 2023-2028 (%)
      • Exhibit 114: Data Table on Norway - Year-over-year growth 2023-2028 (%)
    • 9.12 France - Market size and forecast 2023-2028
      • Exhibit 115: Chart on France - Market size and forecast 2023-2028 ($ million)
      • Exhibit 116: Data Table on France - Market size and forecast 2023-2028 ($ million)
      • Exhibit 117: Chart on France - Year-over-year growth 2023-2028 (%)
      • Exhibit 118: Data Table on France - Year-over-year growth 2023-2028 (%)
    • 9.13 Market opportunity by geography
      • Exhibit 119: Market opportunity by geography ($ million)
      • Exhibit 120: Data Tables on Market opportunity by geography ($ million)

    10 Drivers, Challenges, and Trends

    • 10.1 Market drivers
      • 10.2 Market challenges
        • 10.3 Impact of drivers and challenges
          • Exhibit 121: Impact of drivers and challenges in 2023 and 2028
        • 10.4 Market trends

          11 Vendor Landscape

          • 11.1 Overview
            • 11.2 Vendor landscape
              • Exhibit 122: Overview on Criticality of inputs and Factors of differentiation
            • 11.3 Landscape disruption
              • Exhibit 123: Overview on factors of disruption
            • 11.4 Industry risks
              • Exhibit 124: Impact of key risks on business

            12 Vendor Analysis

            • 12.1 Vendors covered
              • Exhibit 125: Vendors covered
            • 12.2 Market positioning of vendors
              • Exhibit 126: Matrix on vendor position and classification
            • 12.3 AP Moller Maersk AS
              • Exhibit 127: AP Moller Maersk AS - Overview
              • Exhibit 128: AP Moller Maersk AS - Business segments
              • Exhibit 129: AP Moller Maersk AS - Key news
              • Exhibit 130: AP Moller Maersk AS - Key offerings
              • Exhibit 131: AP Moller Maersk AS - Segment focus
            • 12.4 China Minmetals Corp.
              • Exhibit 132: China Minmetals Corp. - Overview
              • Exhibit 133: China Minmetals Corp. - Product / Service
              • Exhibit 134: China Minmetals Corp. - Key offerings
            • 12.5 Collier Consulting Inc.
              • Exhibit 135: Collier Consulting Inc. - Overview
              • Exhibit 136: Collier Consulting Inc. - Product / Service
              • Exhibit 137: Collier Consulting Inc. - Key offerings
            • 12.6 De Beers Corp.
              • Exhibit 138: De Beers Corp. - Overview
              • Exhibit 139: De Beers Corp. - Product / Service
              • Exhibit 140: De Beers Corp. - Key offerings
            • 12.7 Deep Ocean Engineering Inc.
              • Exhibit 141: Deep Ocean Engineering Inc. - Overview
              • Exhibit 142: Deep Ocean Engineering Inc. - Product / Service
              • Exhibit 143: Deep Ocean Engineering Inc. - Key offerings
            • 12.8 DEME NV
              • Exhibit 144: DEME NV - Overview
              • Exhibit 145: DEME NV - Business segments
              • Exhibit 146: DEME NV - Key offerings
              • Exhibit 147: DEME NV - Segment focus
            • 12.9 DFR Gold Inc.
              • Exhibit 148: DFR Gold Inc. - Overview
              • Exhibit 149: DFR Gold Inc. - Product / Service
              • Exhibit 150: DFR Gold Inc. - Key offerings
            • 12.10 Groupe Gorge
              • Exhibit 151: Groupe Gorge - Overview
              • Exhibit 152: Groupe Gorge - Product / Service
              • Exhibit 153: Groupe Gorge - Key offerings
            • 12.11 Loke Marine Minerals AS
              • Exhibit 154: Loke Marine Minerals AS - Overview
              • Exhibit 155: Loke Marine Minerals AS - Product / Service
              • Exhibit 156: Loke Marine Minerals AS - Key offerings
            • 12.12 Ocean Minerals LLC
              • Exhibit 157: Ocean Minerals LLC - Overview
              • Exhibit 158: Ocean Minerals LLC - Product / Service
              • Exhibit 159: Ocean Minerals LLC - Key offerings
            • 12.13 RJE International Inc.
              • Exhibit 160: RJE International Inc. - Overview
              • Exhibit 161: RJE International Inc. - Product / Service
              • Exhibit 162: RJE International Inc. - Key offerings
            • 12.14 Royal IHC
              • Exhibit 163: Royal IHC - Overview
              • Exhibit 164: Royal IHC - Product / Service
              • Exhibit 165: Royal IHC - Key offerings
            • 12.15 SAMS Enterprise Ltd
              • Exhibit 166: SAMS Enterprise Ltd - Overview
              • Exhibit 167: SAMS Enterprise Ltd - Product / Service
              • Exhibit 168: SAMS Enterprise Ltd - Key offerings
            • 12.16 Specialist Machine Developments Ltd.
              • Exhibit 169: Specialist Machine Developments Ltd. - Overview
              • Exhibit 170: Specialist Machine Developments Ltd. - Product / Service
              • Exhibit 171: Specialist Machine Developments Ltd. - Key offerings
            • 12.17 TMC The Metal Co. Inc.
              • Exhibit 172: TMC The Metal Co. Inc. - Overview
              • Exhibit 173: TMC The Metal Co. Inc. - Product / Service
              • Exhibit 174: TMC The Metal Co. Inc. - Key offerings

            13 Appendix

            • 13.1 Scope of the report
              • 13.2 Inclusions and exclusions checklist
                • Exhibit 175: Inclusions checklist
                • Exhibit 176: Exclusions checklist
              • 13.3 Currency conversion rates for US$
                • Exhibit 177: Currency conversion rates for US$
              • 13.4 Research methodology
                • Exhibit 178: Research methodology
                • Exhibit 179: Validation techniques employed for market sizing
                • Exhibit 180: Information sources
              • 13.5 List of abbreviations
                • Exhibit 181: List of abbreviations

              Research Methodology

              Technavio presents a detailed picture of the market by way of study, synthesis, and summation of data from multiple sources. The analysts have presented the various facets of the market with a particular focus on identifying the key industry influencers. The data thus presented is comprehensive, reliable, and the result of extensive research, both primary and secondary.

              INFORMATION SOURCES

              Primary sources

              • Manufacturers and suppliers
              • Channel partners
              • Industry experts
              • Strategic decision makers

              Secondary sources

              • Industry journals and periodicals
              • Government data
              • Financial reports of key industry players
              • Historical data
              • Press releases

              DATA ANALYSIS

              Data Synthesis

              • Collation of data
              • Estimation of key figures
              • Analysis of derived insights

              Data Validation

              • Triangulation with data models
              • Reference against proprietary databases
              • Corroboration with industry experts

              REPORT WRITING

              Qualitative

              • Market drivers
              • Market challenges
              • Market trends
              • Five forces analysis

              Quantitative

              • Market size and forecast
              • Market segmentation
              • Geographical insights
              • Competitive landscape

              Interested in this report?

              Get your sample now to see our research methodology and insights!

              Download Now

              Frequently Asked Questions

              Marine Mining market growth will increase by $ 8252.78 mn during 2024-2028 .

              The Marine Mining market is expected to grow at a CAGR of 33.98% during 2024-2028 .

              Marine Mining market is segmented by Application( Precious metals, Automotive, Oil and gas, Electronics, Construction) Technology( Remotely operated vehicles (ROVs), Sonar, Marine seismic methods)

              AP Moller Maersk AS, China Minmetals Corp., Collier Consulting Inc., De Beers Corp., Deep Ocean Engineering Inc., DEME NV, DFR Gold Inc., Groupe Gorge, Loke Marine Minerals AS, Ocean Minerals LLC, RJE International Inc., Royal IHC, SAMS Enterprise Ltd, Specialist Machine Developments Ltd., TMC The Metal Co. Inc. are a few of the key vendors in the Marine Mining market.

              North America will register the highest growth rate of 33% among the other regions. Therefore, the Marine Mining market in North America is expected to garner significant business opportunities for the vendors during the forecast period.

              US, China, Germany, Norway, France

              • Growing focus on energy transition and renewable technologiesRenewable energy technologies is the driving factor this market.
              • such as wind turbines is the driving factor this market.
              • solar panels is the driving factor this market.
              • and electric vehicles is the driving factor this market.
              • rely heavily on critical minerals such as cobalt is the driving factor this market.
              • lithium is the driving factor this market.
              • nickel is the driving factor this market.
              • and REEs. These minerals are essential for manufacturing batteries is the driving factor this market.
              • magnets is the driving factor this market.
              • and other components of renewable energy systems. As the demand for renewable energy continues to grow is the driving factor this market.
              • so does the demand for these critical minerals is the driving factor this market.
              • driving interest in marine mining as a potential source. Deep-sea environments are known to host rich deposits of critical minerals is the driving factor this market.
              • including polymetallic nodules is the driving factor this market.
              • seafloor massive sulfides (SMS) is the driving factor this market.
              • and cobalt-rich ferromanganese crusts. Marine mining provides access to these strategic resources is the driving factor this market.
              • which are crucial for advancing the energy transition and achieving sustainability goals. Moreover is the driving factor this market.
              • governments and international organizations are increasingly recognizing the importance of sustainable resource development and the role of marine mining in supporting the energy transition. Regulatory support is the driving factor this market.
              • incentives is the driving factor this market.
              • and investment in research and development can accelerate the growth of the marine mining sector and facilitate responsible resource extraction. For instance is the driving factor this market.
              • in January 2024 is the driving factor this market.
              • the European Union (EU) announced the investment of more than $92 million in research projects related to deep-sea mining. These projects focus on the effects of deep-sea mining on the marine environment and environmentally friendly technologies. The EU research has highlighted significant knowledge gaps and the need for long-term studies to understand the full range of mining impacts on biodiversity. The EU objectives for deep-sea research include enhancing cross-sector dialogue and providing a platform for future partnerships between the scientific is the driving factor this market.
              • industry is the driving factor this market.
              • and socio-economic communities. Thus is the driving factor this market.
              • the growing focus on energy transition and renewable technologies creates opportunities for the marine mining sector to contribute to the sustainable supply of critical minerals needed for building a low-carbon economy is the driving factor this market.
              • which will propel the growth of the global marine mining market during the forecast period. is the driving factor this market.

              The Marine Mining market vendors should focus on grabbing business opportunities from the Precious metals segment as it accounted for the largest market share in the base year.