Japan Medical Devices Market Size 2025-2029
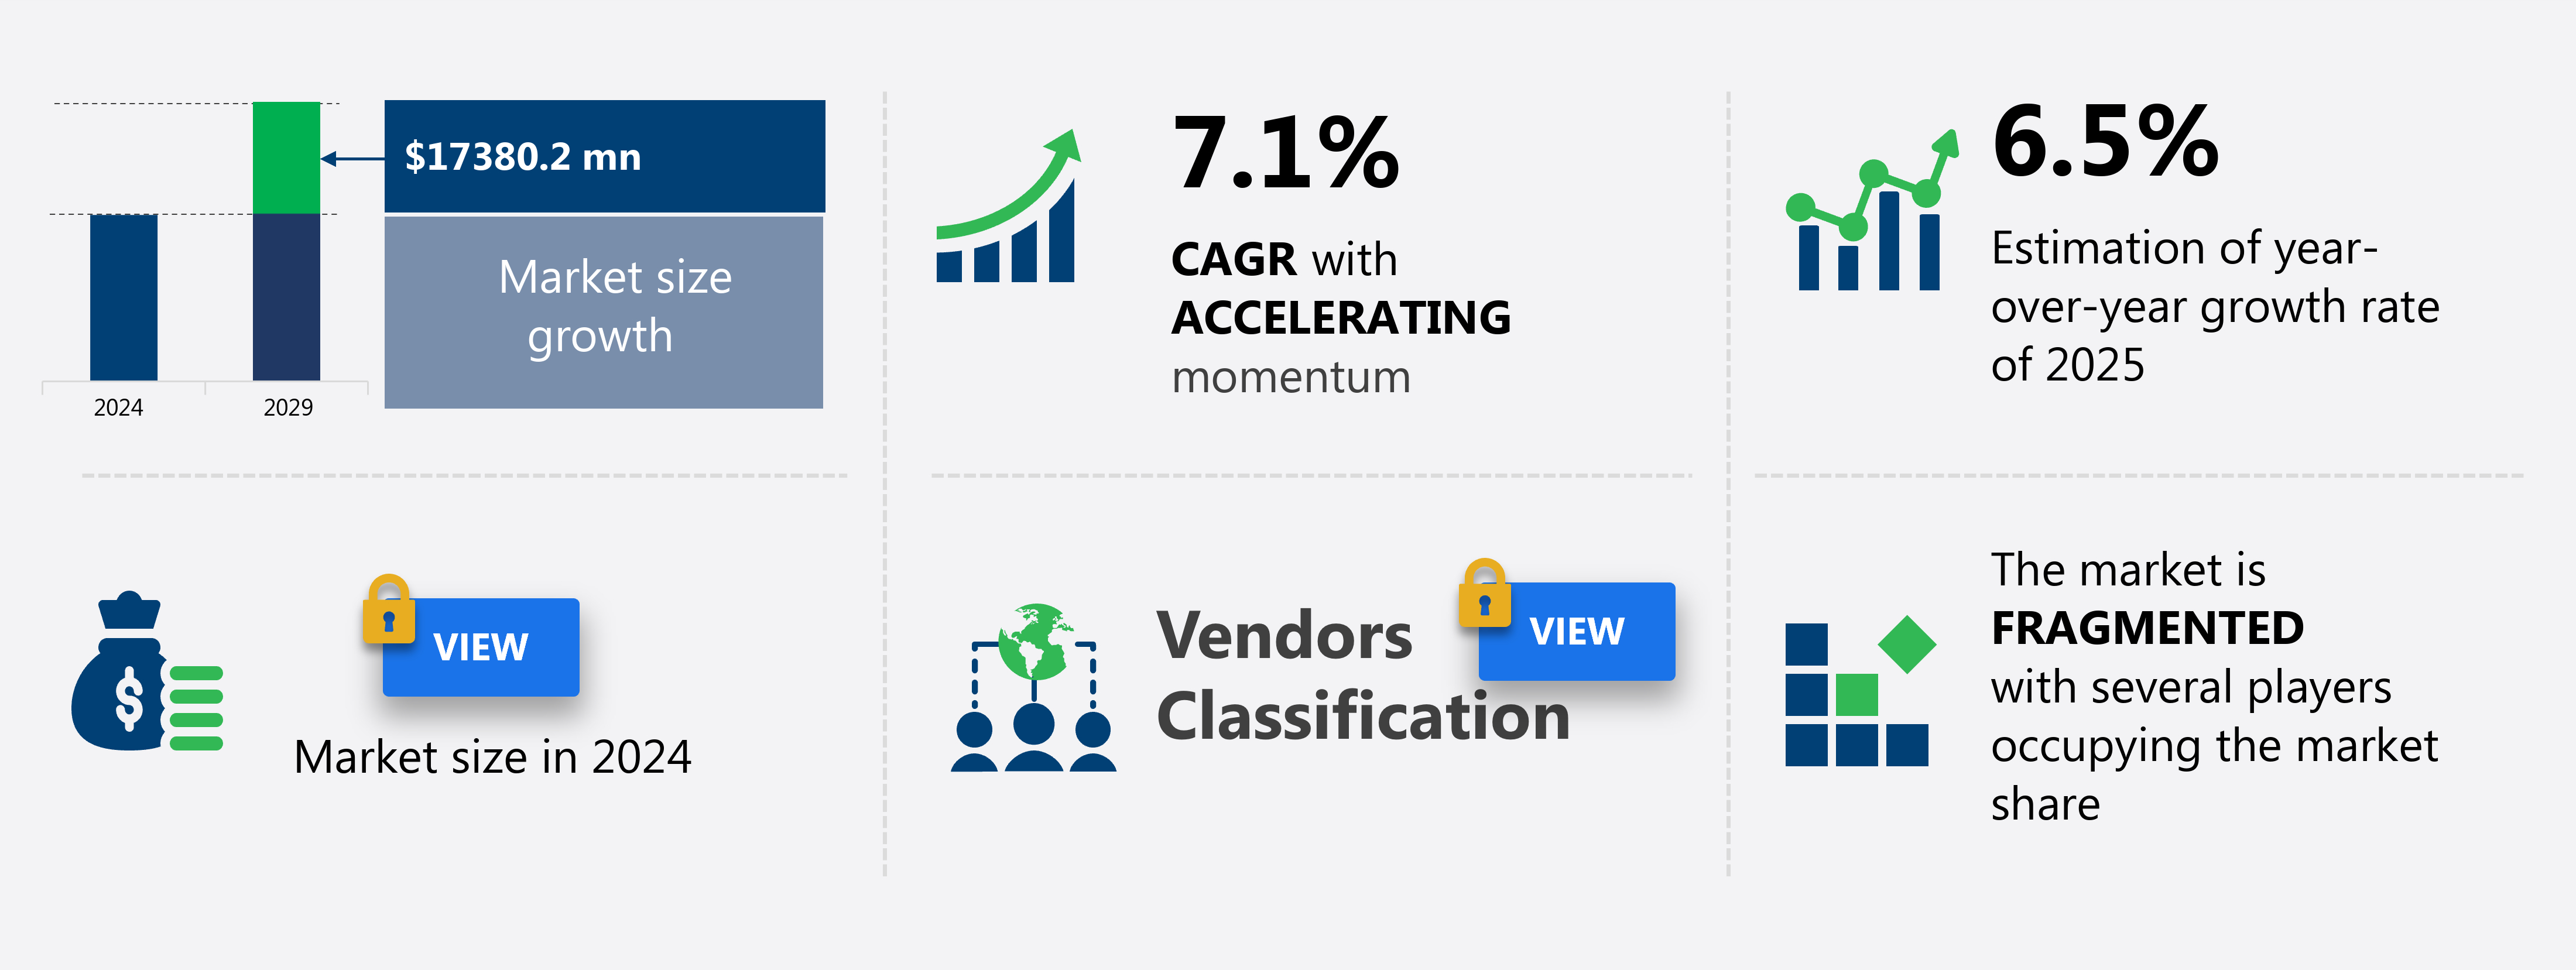
The medical devices market size in Japan is forecast to increase by USD 17.38 billion at a CAGR of 7.1% between 2024 and 2029.
-
The medical devices market is experiencing significant growth, driven by the increasing demand for minimally invasive procedures and the emergence of innovative technologies. In particular, the in-vitro diagnostics segment is gaining traction due to advancements in AI and robotics. Robotic surgical systems and surgical imaging devices are revolutionizing the healthcare industry, enabling precise and accurate diagnoses and treatments. However, challenges persist, including product recalls and limitations of medical devices. Raw materials, such as stainless steel, play a crucial role in the production of medical devices. Positron emission topography and telemedicine are also emerging trends, offering new opportunities for market expansion. As the US healthcare sector continues to evolve, staying informed about these trends and challenges is crucial for industry stakeholders.
What will be the Size of the market During the Forecast Period?
- The medical devices market encompasses a diverse range of products, including medical equipment for chronic conditions management in healthcare systems and home care settings, drug delivery devices, diagnostic devices, invasive devices, and electronic medical devices. This market is driven by the increasing prevalence of cardiovascular diseases, chronic diseases, and the growing demand for minimally invasive diagnostic procedures and surgical treatments. The market's size is significant, with a substantial number of inpatient admissions and capital equipment purchases each year.
- Wearable devices and electronic medical records are emerging trends, with a focus on improving patient outcomes and streamlining healthcare delivery. The market's direction is towards more personalized, minimally invasive, and cost-effective treatment options. Medical devices are integral to various diagnostic procedures, surgical procedures, and knee revision surgeries, making their role in healthcare indispensable.
How is this market segmented and which is the largest segment?
The market research report provides comprehensive data (region-wise segment analysis), with forecasts and estimates in "USD million" for the period 2025-2029, as well as historical data from 2019-2023 for the following segments.
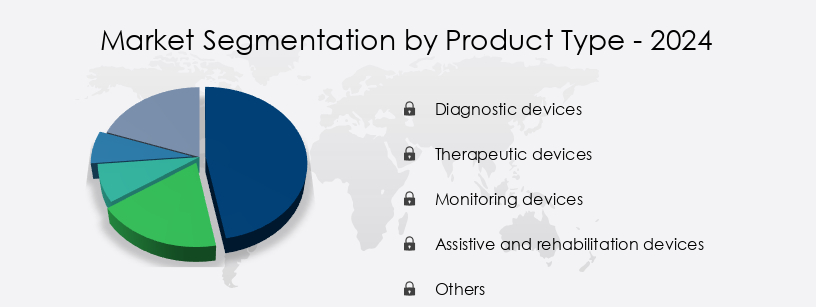
- Product Type
- Diagnostic devices
- Therapeutic devices
- Monitoring devices
- Assistive and rehabilitation devices
- Others
- Application
- Cardiovascular
- Orthopedic
- Diagnostic imaging
- Dental
- Others
- End-user
- Hospitals and clinics
- Diagnostic centers
- Others
- Geography
- Japan
By Product Type Insights
The diagnostic devices segment is estimated to witness significant growth during the forecast period. The diagnostic devices segment is a significant component of the market, offering advanced tools and technologies for accurate and efficient diagnosis of various medical conditions. These devices play a crucial role in healthcare, facilitating initial screenings, disease detection, and ongoing monitoring. With technological advancements, diagnostic devices continue to evolve, providing more precise and user-friendly solutions for clinical decision-making and patient care. The segment's importance will persist, fueled by the increasing demand for innovative diagnostic solutions. Non-invasive diagnostic tools will gain prominence, prioritizing patient comfort and adherence.
Chronic diseases, such as diabetes and cardiovascular conditions, will continue to drive market growth in this segment, as early and accurate diagnosis is essential for effective treatment and improved patient outcomes. Diagnostic imaging, ophthalmic diseases, and clinical diagnostic tests are among the sub-segments expected to witness substantial growth.
Get a glance at the market report of share of various segments Request Free Sample
Market Dynamics
Our Japan Medical Devices Market researchers analyzed the data with 2024 as the base year, along with the key drivers, trends, and challenges. A holistic analysis of drivers will help companies refine their marketing strategies to gain a competitive advantage.
What are the key market drivers leading to the rise in adoption of Japan Medical Devices Market?
- Increasing demand for minimally invasive procedures is the key driver of the market. The Medical Device Market is experiencing significant growth due to the increasing prevalence of chronic conditions and the subsequent demand for advanced medical equipment. Chronic diseases, such as cardiovascular diseases, diabetes, and ophthalmic diseases, require ongoing patient treatment and diagnostic procedures. As a result, there is a rising demand for diagnostic devices, drug delivery devices, and invasive devices, including respiratory therapeutic devices, electronic medical devices, and cardiovascular devices. Home care settings and ambulatory surgical centers are increasingly adopting medical devices to provide specialized care and improve patient outcomes. Healthcare innovation has led to the development of portable and wearable devices, such as fitness trackers and health monitoring systems, which enable remote monitoring and personalized treatment.
-
The integration of technologies like artificial intelligence (AI) and machine learning into medical devices has revolutionized healthcare. Minimally invasive devices, such as minimally invasive surgical instruments and robotic surgical systems, have become essential in hospitals and ASCs, reducing inpatient admissions and capital equipment costs. Moreover, regulatory changes have facilitated the adoption of advanced medical devices, enabling preventive healthcare and telemedicine platforms. The aging population and the increasing burden of chronic disorders have further fueled the demand for medical devices. In-vitro diagnostics (IVD) and clinical diagnostic tests have become crucial in early disease detection and treatment. The Medical Device Market encompasses a wide range of products, including dental devices, ENT devices, and diagnostic imaging equipment. Raw materials, such as stainless steel and 3D printing, are essential in the manufacturing of medical devices. The market is expected to continue growing, driven by the need for improved patient outcomes and the integration of advanced technologies.
What are the market trends shaping the Japan Medical Devices Market?
- Emergence of innovative medical technologies is the upcoming trend in the market. The Medical Device Market is experiencing significant growth due to the introduction of innovative technologies and devices that enhance disease diagnosis and treatment, particularly for chronic conditions. Regenerative medicine, surgical robots, liquid biopsy, and wearable medical devices are among the latest innovations. Regenerative medicine, which involves repairing or replacing damaged human cells, tissues, and organs using therapeutic stem cells, tissue engineering, and artificial organ production, is gaining prominence. Three-dimensional (3D) bioprinting or additive manufacturing is being adopted for producing regenerative medicines, enabling researchers to control product size, shape, pore size, geometry, and mechanical properties. This technology allows for the study of drug and treatment effects on human tissues, providing valuable insights into patient-specific treatments.
-
Electronic medical devices, diagnostic devices, invasive devices, drug delivery devices, respiratory therapeutic devices, and diagnostic imaging equipment are other significant market categories. Healthcare systems, home care settings, ambulatory surgical centers, and hospitals and ASCs are key end-users. Health policies, chronic diseases, treatment options, diagnostic procedures, surgical procedures, and healthcare expenditure are major drivers. Key technologies include artificial intelligence (AI) integration, smart monitoring, health management, personalized treatment, telemedicine platforms, and device innovation. Raw materials such as stainless steel and advanced manufacturing techniques like 3D printing are also shaping the market.
What challenges doesJapan Medical Devices Market face during the growth?
- Limitations of medical devices and product recalls is a key challenge affecting the market growth. Medical devices play a crucial role in various healthcare specialties, including cardiology, orthopedics, and neurology. However, these devices come with certain limitations and challenges. For instance, Cardiac Resynchronization Therapy-Defibrillators (CRT-Ds) and Implantable Cardioverter-Defibrillators (ICDs) have faced technological and physiological constraints, which have affected their effectiveness. Complications such as lead failures, deterioration in quality of life, inappropriate shocks, and premature battery complications have been reported in 4%-11% of new ICD implantations during the early discharge period. Similarly, the Single-Chamber Implantable Defibrillator (S-ICD) system has its limitations, as it cannot provide chronic anti-bradycardic and anti-tachycardic pacing and Cardiac Resynchronization Therapy (CRT).
- In the realm of medical devices, there are ongoing advancements in technology to address these challenges. Electronic medical devices, such as wearable fitness trackers and remote monitoring systems, are increasingly being integrated with Artificial Intelligence (AI) and Machine Learning algorithms to improve patient outcomes. Healthcare innovation continues to evolve, with a focus on patient-centric care, preventive healthcare, and telemedicine platforms. The medical device market encompasses a wide range of products, including drug delivery devices, diagnostic devices, invasive devices, respiratory therapeutic devices, and electronic medical devices. Chronic diseases, such as cardiovascular diseases, diabetes, and ophthalmic diseases, are major drivers of the medical device market, as they necessitate specialized care and treatment options.
- Health policies and regulatory changes are also shaping the market landscape, with a growing emphasis on minimally invasive devices, regenerative medicine, and home healthcare. Capital equipment, such as MRI machines, CT scanners, and 3D printing technology, are essential components of the medical device market. The aging population and increasing healthcare expenditure further fuel the demand for medical devices. The medical device market is a dynamic and evolving landscape, driven by technological advancements, healthcare innovation, and the growing prevalence of chronic diseases.
Exclusive Customer Landscape
The market forecasting report includes the adoption lifecycle of the market, covering from the innovator's stage to the laggard's stage. It focuses on adoption rates in different regions based on penetration. Furthermore, the market report also includes key purchase criteria and drivers of price sensitivity to help companies evaluate and develop their market growth analysis strategies.
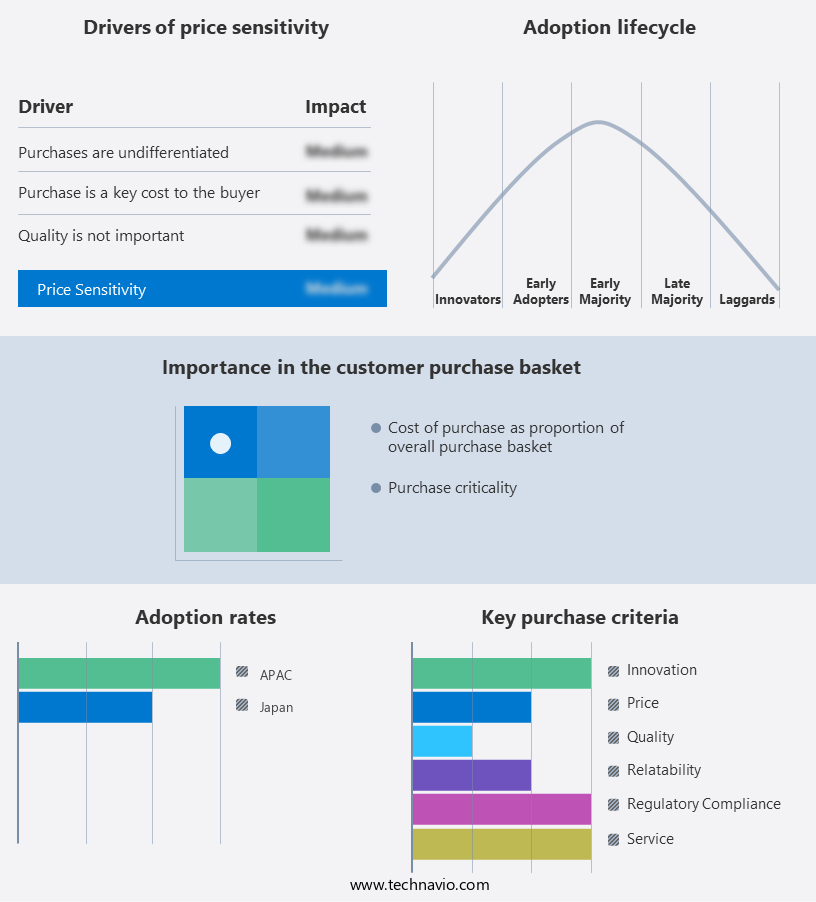
Customer Landscape
Key Companies & Market Insights
Companies are implementing various strategies, such as strategic alliances, market forecast , partnerships, mergers and acquisitions, geographical expansion, and product/service launches, to enhance their presence in the market.
AI Medical Service Inc. - The company specializes in advanced medical devices, including an AI-driven Gastric Endoscopic Diagnostic Imaging Support System.
The market research and growth report includes detailed analyses of the competitive landscape of the market and information about key companies, including:
- AI Medical Service Inc.
- ARKRAY Inc.
- ASTI Corp.
- B dot Medical Inc.
- Baxter International Inc.
- Becton Dickinson and Co.
- Canon Inc.
- Connect K.K.
- Cyfuse Biomedical K.K.
- F. Hoffmann La Roche Ltd.
- Fuji Seiko
- Fukuda Sangyo Co. Ltd.
- GE Healthcare Technologies Inc.
- Hitachi Ltd.
- Johnson and Johnson Services Inc.
- Medtronic Plc
- Nipro Corp.
- Perkin Elmer Inc.
- Siemens AG
- Terumo Medical Corp.
Qualitative and quantitative analysis of companies has been conducted to help clients understand the wider business environment as well as the strengths and weaknesses of key market players. Data is qualitatively analyzed to categorize companies as pure play, category-focused, industry-focused, and diversified; it is quantitatively analyzed to categorize companies as dominant, leading, strong, tentative, and weak.
Research Analyst Overview
The medical device market encompasses a broad range of technologies designed to improve patient outcomes and enhance healthcare delivery. Chronic conditions continue to be a significant driver of growth in this sector, as healthcare systems seek to manage the complexities of treating and caring for patients with ongoing health issues. Home care settings have emerged as a key area of focus for medical equipment manufacturers, as the trend toward decentralized care and remote monitoring continues to gain momentum. Drug delivery devices and diagnostic tools are particularly well-suited for home use, enabling patients to manage their conditions more effectively and reducing the need for frequent hospital visits.
Invasive devices, such as respiratory therapeutic devices and electronic medical devices, are also seeing increased demand as healthcare providers seek to improve patient outcomes and reduce the length of hospital stays. Cardiovascular diseases remain a major area of investment, with diagnostic imaging and minimally invasive surgical procedures playing crucial roles in early detection and treatment. Ophthalmic diseases and general surgery are other areas where medical devices are making a significant impact. Advances in diagnostic procedures and surgical techniques have led to improved patient outcomes and reduced recovery times. Knee revision surgeries and inpatient admissions are among the many procedures where medical devices are helping to streamline processes and enhance patient care.
Capital equipment, such as MRI machines and CT scanners, continue to be essential tools for healthcare agencies and hospitals. The aging population and the increasing prevalence of chronic disorders are driving demand for specialized care and innovative medical technologies. Health policies and regulatory changes are shaping the medical device market in significant ways. Preventive healthcare and personalized treatment are becoming increasingly important priorities, and medical devices are playing a key role in enabling these initiatives. Telemedicine platforms and AI integration are among the many technologies helping to make healthcare more accessible and efficient. Raw materials, such as stainless steel and 3D printing, are also having an impact on the medical device market.
Wearable devices and remote monitoring technologies are driving demand for new materials and manufacturing processes. Artificial intelligence (AI) and machine learning are being integrated into medical devices to improve clinical intelligence and enhance patient care. Minimally invasive devices and regenerative medicine are other areas of innovation, offering new treatment options for a range of conditions. Home healthcare and ambulatory surgical centers are also growing areas of focus, as healthcare providers seek to provide more convenient and cost-effective care options for patients. The medical device market is a dynamic and innovative sector, driven by the need to improve patient outcomes, enhance healthcare delivery, and address the challenges of an aging population and the increasing prevalence of chronic conditions. From drug delivery devices and diagnostic tools to capital equipment and surgical technologies, medical devices are playing a crucial role in shaping the future of healthcare.
|
Market Scope |
|
|
Report Coverage |
Details |
|
Page number |
197 |
|
Base year |
2024 |
|
Historic period |
2019-2023 |
|
Forecast period |
2025-2029 |
|
Growth momentum & CAGR |
Accelerate at a CAGR of 7.1% |
|
Market growth 2025-2029 |
USD 17.38 billion |
|
Market structure |
Fragmented |
|
YoY growth 2024-2025(%) |
6.5 |
|
Key countries |
Japan |
|
Competitive landscape |
Leading Companies, Market Positioning of Companies, Competitive Strategies, and Industry Risks |
What are the Key Data Covered in this Market Research and Growth Report?
- CAGR of the market during the forecast period
- Detailed information on factors that will drive the market growth and forecasting between 2025 and 2029
- Precise estimation of the size of the market and its contribution of the market in focus to the parent market
- Accurate predictions about upcoming market growth and trends and changes in consumer behaviour
- Growth of the market across Japan
- Thorough analysis of the market's competitive landscape and detailed information about companies
- Comprehensive analysis of factors that will challenge the growth of market companies
We can help! Our analysts can customize this market research report to meet your requirements. Get in touch
 RIA -
RIA - 
