Medical Imaging Software Market Analysis, Size, and Forecast 2026-2030: North America (US, Canada, and Mexico), Europe (UK, Germany, and France), APAC (China, India, and Japan), South America (Brazil), Middle East and Africa (South Africa, Saudi Arabia, and UAE), Asia, Rest of World (ROW)

Medical Imaging Software Market Analysis, Size, and Forecast 2026-2030:
North America (US, Canada, and Mexico), Europe (UK, Germany, and France), APAC (China, India, and Japan), South America (Brazil), Middle East and Africa (South Africa, Saudi Arabia, and UAE), Asia, Rest of World (ROW)

Published: Mar 2026 302 Pages SKU: IRTNTR81308

Market Overview at a Glance

$3.33 B
Market Opportunity
7.1%
CAGR 2025 - 2030
33%
North America Growth
$4.29 B
On-premises segment 2024

Medical Imaging Software Market Size 2026-2030

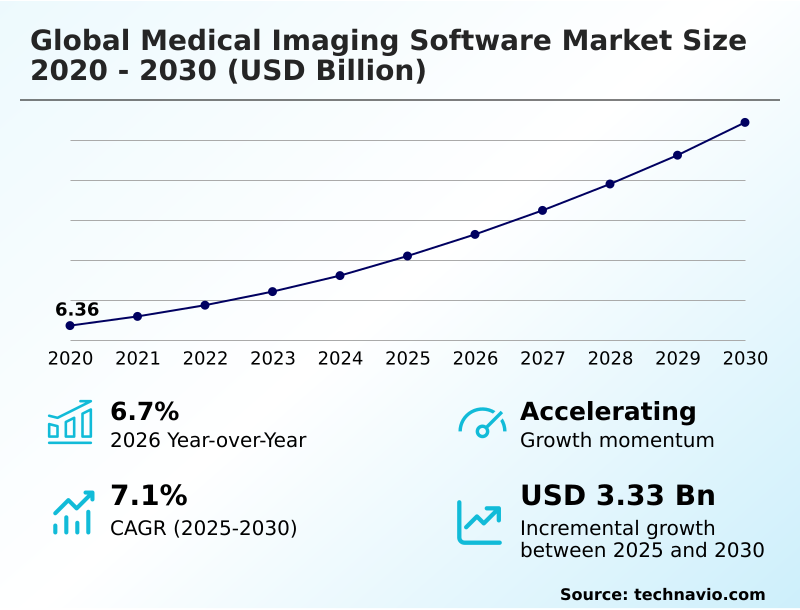
The medical imaging software market size is valued to increase by USD 3.33 billion, at a CAGR of 7.1% from 2025 to 2030. Transition toward precision medicine and utilization of quantitative imaging biomarkers will drive the medical imaging software market.

Major Market Trends & Insights

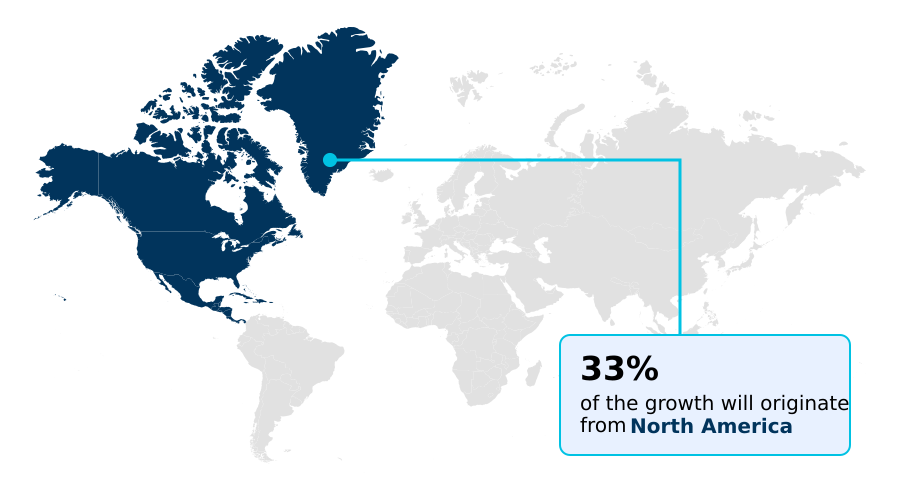
  • North America dominated the market and accounted for a 33% growth during the forecast period.
  • By Deployment - On-premises segment was valued at USD 4.29 billion in 2024
  • By End-user - Hospitals segment accounted for the largest market revenue share in 2024

Market Size & Forecast

  • Market Opportunities: USD 5.08 billion
  • Market Future Opportunities: USD 3.33 billion
  • CAGR from 2025 to 2030 : 7.1%

Market Summary

  • The medical imaging software market is undergoing a period of robust expansion, driven by the increasing integration of advanced digital technologies within clinical settings. This growth is primarily motivated by the rising prevalence of chronic conditions and the subsequent demand for precise diagnostic tools.
  • Healthcare organizations are progressively adopting sophisticated software solutions to streamline the interpretation of complex datasets and to reduce the workload of radiologists. The shift toward digital health ecosystems has made high levels of interoperability essential, allowing for the smooth exchange of information. For instance, a multi-site hospital network can implement an enterprise imaging platform that standardizes diagnostic protocols for oncology.
  • This enables seamless sharing of computed tomography and magnetic resonance imaging scans, facilitates AI-driven analysis for early tumor detection, and supports collaborative treatment planning, ultimately improving patient outcomes and operational efficiency across all facilities. The growth of the market is also supported by the increasing preference for non-invasive diagnostic procedures, which rely heavily on high-resolution imaging and sophisticated visualization tools.
  • Cloud-native solutions are becoming the standard for data storage and analysis, providing healthcare practitioners with the flexibility to access critical images from remote locations while maintaining data security.

What will be the Size of the Medical Imaging Software Market during the forecast period?

Get Key Insights on Market Forecast (PDF) Request Free Sample

How is the Medical Imaging Software Market Segmented?

The medical imaging software industry research report provides comprehensive data (region-wise segment analysis), with forecasts and estimates in "USD million" for the period 2026-2030, as well as historical data from 2020-2024 for the following segments.

  • Deployment
    • On-premises
    • Cloud-based
    • Hybrid
  • End-user
    • Hospitals
    • Diagnostic imaging centers
    • Others
  • Modality
    • Computed tomography
    • Magnetic resonance imaging
    • Ultrasound imaging
    • X-ray imaging
    • Others
  • Geography
    • North America
      • US
      • Canada
      • Mexico
    • Europe
      • UK
      • Germany
      • France
    • Asia
    • Rest of World (ROW)

By Deployment Insights

The on-premises segment is estimated to witness significant growth during the forecast period.

On-premises deployment remains a significant segment, largely driven by the need for high-speed data access and maximum control over patient data privacy compliance.

Healthcare institutions prioritize this model for its local system performance, which is crucial for real-time diagnostic workflows using picture archiving and communication systems.

This approach minimizes latency, reducing data access times by over 90% for critical cases that rely on server-side rendered medical images. However, achieving seamless electronic health records integration requires adherence to strict interoperability standards and data standardization protocols.

While digital health ecosystems are evolving toward cloud-based remote diagnostics platforms and centralized imaging archives, the security and performance benefits of on-premises solutions, governed by the digital imaging and communications in medicine standard, ensure their continued relevance in the market.

Request Free Sample

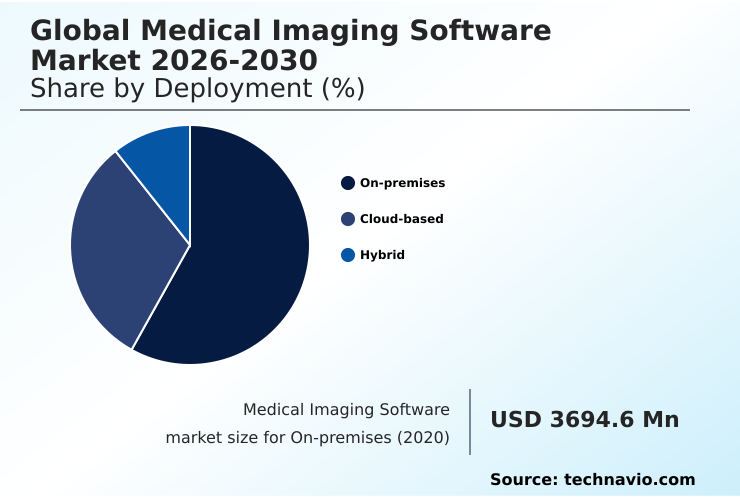
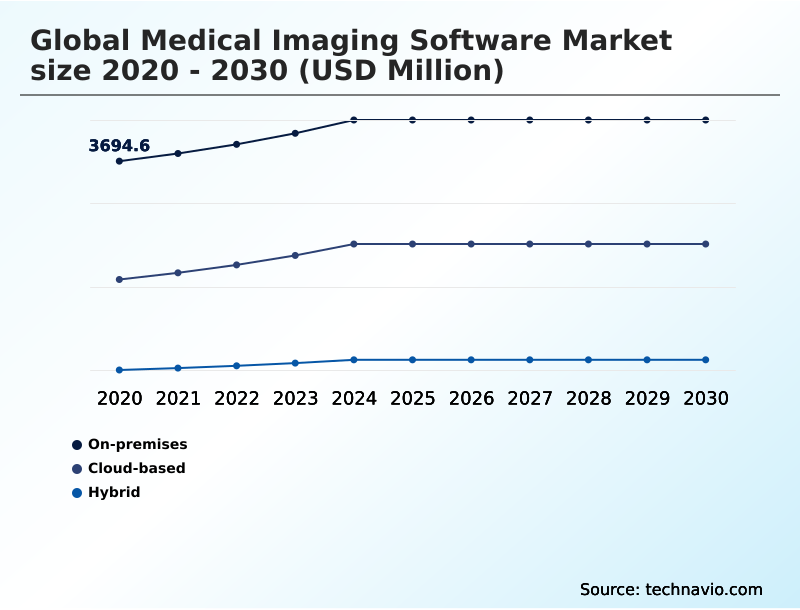
The On-premises segment was valued at USD 4.29 billion in 2024 and showed a gradual increase during the forecast period.

Request Free Sample

Regional Analysis

North America is estimated to contribute 33% to the growth of the global market during the forecast period.Technavio’s analysts have elaborately explained the regional trends and drivers that shape the market during the forecast period.

See How Medical Imaging Software Market Demand is Rising in North America Request Free Sample

The geographic landscape of the market is characterized by varied adoption rates and technological priorities. In North America, the focus is on optimizing mature digital health ecosystems with advanced ai-integrated enterprise imaging and ai-powered brain imaging solutions.

Growth in Asia outpaces other regions, with an 8.9% expansion rate compared to 6.2% in North America, driven by widespread digital health transformation and the deployment of cloud-native ris/pacs platforms.

Tele-radiology frameworks are critical in geographically dispersed areas like Australia, where tele-ultrasound capabilities have reduced diagnostic turnaround times by up to 40%. The adoption of point-of-care diagnostics and quantitative magnetic resonance imaging is accelerating globally.

Advanced techniques such as three-dimensional reconstruction and elastography software are becoming standard in surgical planning applications, improving procedural accuracy and patient outcomes.

Market Dynamics

Our researchers analyzed the data with 2025 as the base year, along with the key drivers, trends, and challenges. A holistic analysis of drivers will help companies refine their marketing strategies to gain a competitive advantage.

  • The evolution of the global medical imaging software market 2026-2030 is defined by a strategic shift from standalone systems to interconnected, intelligent platforms. Central to this transformation is the ai integration in diagnostic workflows, which leverages deep learning for image segmentation to automate analysis and improve accuracy.
  • The adoption of a cloud native architecture for medical imaging is accelerating, enabling saas models in radiology software that offer scalability and reduce capital expenditure. This infrastructure supports advanced applications like 3d visualization in surgical planning and multimodal imaging for oncology planning, which are critical for modern treatment paradigms.
  • Ensuring the interoperability of pacs and ehr systems remains a core objective, facilitated by vendor neutral archive data management solutions that break down data silos. Facilities using such platforms report up to 25% lower data migration costs compared to proprietary systems.
  • Concurrently, heightened cybersecurity in medical imaging data is a non-negotiable requirement, with gdpr compliance for imaging software and software as a medical device regulation shaping development standards. Innovations in point of care ultrasound software, virtual reality for preoperative rehearsals, and the use of quantitative biomarkers in precision medicine are pushing the boundaries of diagnostics.
  • Teleradiology frameworks for rural healthcare are expanding access, while developments like server side rendered image viewing, ai driven clinical data management, and ris pacs for automated workflows are optimizing efficiency. Furthermore, ai powered brain imaging analysis and the growth of theranostics in molecular imaging highlight the industry's trajectory toward highly personalized and predictive healthcare.

What are the key market drivers leading to the rise in the adoption of Medical Imaging Software Industry?

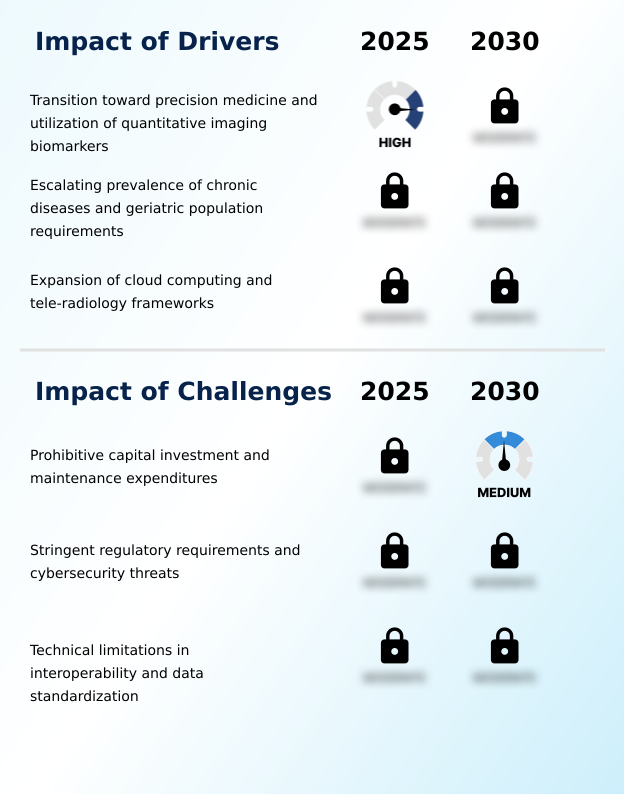
  • The transition toward precision medicine, underscored by the increasing utilization of quantitative imaging biomarkers, serves as a key driver propelling market expansion.

  • Market growth is fundamentally driven by the push for more precise and personalized healthcare. Precision medicine initiatives rely on quantitative imaging biomarkers and radiomics data characterization to provide deeper clinical insights, which aligns with the objectives of value-based healthcare models.
  • Advanced visualization software and multimodal imaging fusion are critical for complex cases, especially in oncology, where they support multi-disciplinary tumor boards and automated diagnostic reporting.
  • The use of longitudinal tracking software to facilitate longitudinal disease monitoring for chronic conditions has demonstrated a 95% consistency rate in tracking disease progression. As more software as a medical device solutions receive regulatory approval, their adoption is accelerating.
  • These tools, which include capabilities for positron emission tomography reconstruction, are essential for population health management and are improving patient outcomes.

What are the market trends shaping the Medical Imaging Software Industry?

  • The integration of artificial intelligence and machine learning algorithms into diagnostic workflows represents a defining market trend. This evolution is fundamentally enhancing diagnostic accuracy and operational efficiency.

  • Key trends are reshaping diagnostic capabilities, with a pronounced shift toward intelligent and immersive technologies. The adoption of deep learning algorithms for automated image segmentation and the deployment of predictive analytics models are enhancing diagnostic precision, with some systems improving anomaly detection accuracy by over 25%.
  • Cloud-native architectures are becoming standard, facilitating software-as-a-service models that reduce data retrieval times for remote consultations by up to 50%. This supports advanced applications in diagnostic imaging workflows, including virtual and augmented reality for minimally invasive procedures planning. Additionally, the market is seeing growth in real-time four-dimensional imaging and theranostics quantification, supported by ai-powered imaging informatics and ai-driven visualization software.
  • These innovations, combined with advances in cloud-based imaging informatics, are creating a more dynamic and responsive diagnostic environment.

What challenges does the Medical Imaging Software Industry face during its growth?

  • Prohibitive capital investment requirements and substantial ongoing maintenance expenditures present a significant challenge affecting widespread industry adoption and growth.

  • Despite technological advancements, significant challenges related to integration, cost, and security persist. The lack of standardized protocols across different enterprise imaging platforms impedes the creation of unified clinical workflows and vendor-neutral data management. This fragmentation can increase manual data reconciliation efforts by up to 30% and complicate the use of radiology information systems.
  • High capital costs for advanced technologies like high-intensity focused ultrasound and tomosynthesis software create barriers to adoption. Moreover, ensuring compliance with evolving cybersecurity mandates for healthcare is a constant concern, requiring robust security in both on-premise and cloud-enabled clinical decision support systems.
  • Efficiently processing data from digital radiography processing and utilizing tools like bone densitometry software and fluoroscopy image guidance depend on effective image reconstruction algorithms and interoperable infrastructure.

Exclusive Technavio Analysis on Customer Landscape

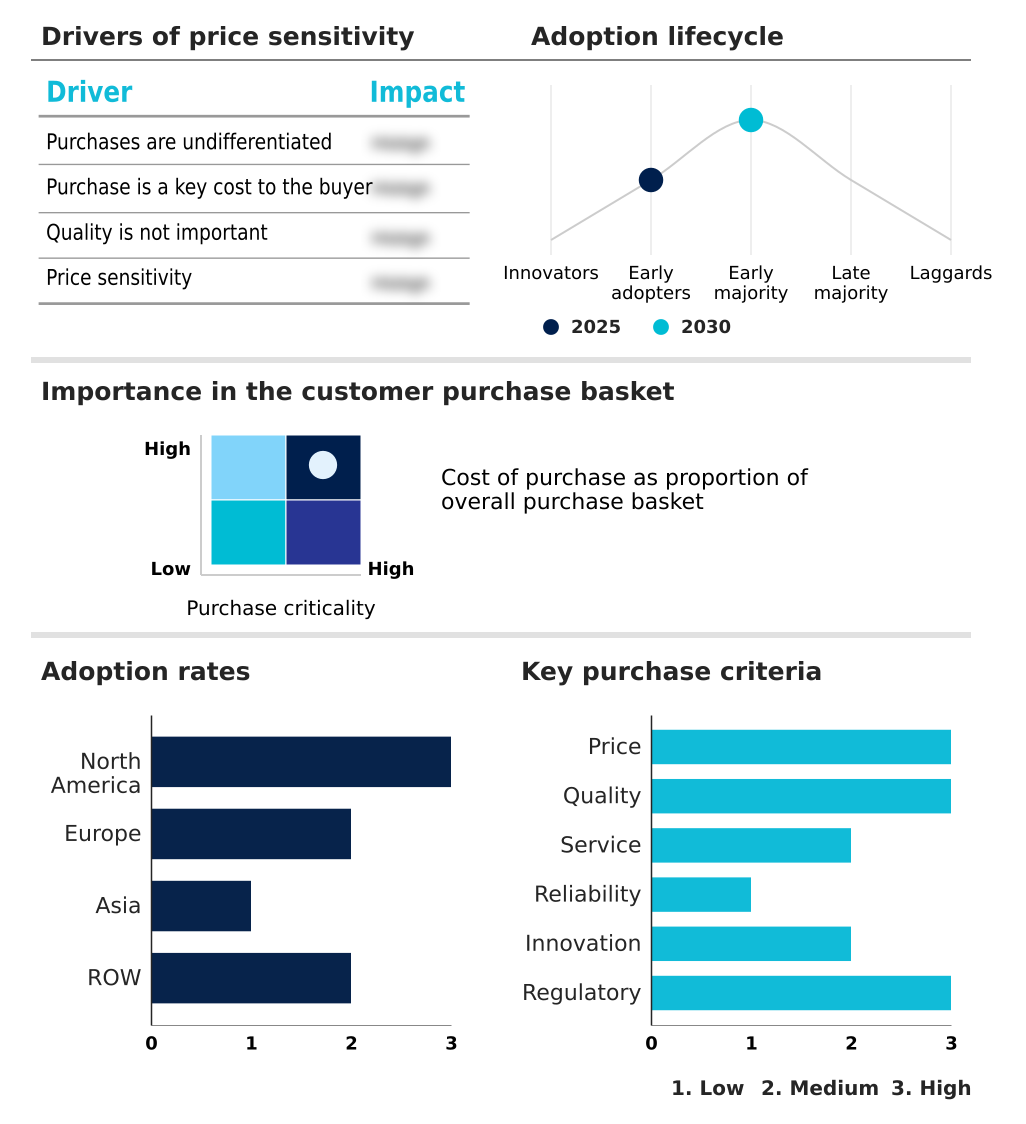
The medical imaging software market forecasting report includes the adoption lifecycle of the market, covering from the innovator’s stage to the laggard’s stage. It focuses on adoption rates in different regions based on penetration. Furthermore, the medical imaging software market report also includes key purchase criteria and drivers of price sensitivity to help companies evaluate and develop their market growth analysis strategies.

Customer Landscape of Medical Imaging Software Industry

Competitive Landscape

Companies are implementing various strategies, such as strategic alliances, medical imaging software market forecast, partnerships, mergers and acquisitions, geographical expansion, and product/service launches, to enhance their presence in the industry.

Agfa Gevaert NV - Enterprise imaging platforms consolidate image management, unifying diagnostic data across diverse medical departments for streamlined clinical workflows.

The industry research and growth report includes detailed analyses of the competitive landscape of the market and information about key companies, including:

  • Agfa Gevaert NV
  • Aidoc Medical Ltd.
  • AnalyzeDirect Inc.
  • Canon Medical Systems Corp.
  • Carestream Health Inc.
  • FUJIFILM Holdings Corp.
  • GE HealthCare Technologies
  • INFINITT North America
  • Koninklijke Philips N.V.
  • Merative L.P.
  • Microsoft Corp.
  • MIM Software Inc.
  • Mirada Medical Ltd.
  • NovaRad
  • NVIDIA Corp.
  • RamSoft Inc.
  • Sectra AB
  • Siemens Healthineers AG
  • United Health Group Inc.
  • Visage Imaging

Qualitative and quantitative analysis of companies has been conducted to help clients understand the wider business environment as well as the strengths and weaknesses of key industry players. Data is qualitatively analyzed to categorize companies as pure play, category-focused, industry-focused, and diversified; it is quantitatively analyzed to categorize companies as dominant, leading, strong, tentative, and weak.

Recent Development and News in Medical imaging software market

  • In February, 2025, the United States Department of Health and Human Services implemented a new cybersecurity mandate for all medical imaging software utilized in federal healthcare programs, aiming to protect patient data against advanced digital threats.
  • In January, 2025, Quibim secured $50 million in Series A financing to advance its development of AI-powered imaging biomarkers, accelerating its mission to integrate advanced imaging analytics into clinical decision-making for precision medicine.
  • In September, 2024, GE HealthCare announced an agreement to acquire icometrix, a company specializing in AI-powered brain imaging analysis for neurological disorders, to enhance its diagnostic capabilities in neurology.
  • In December, 2024, Philips announced an agreement to acquire SpectraWAVE Inc., aiming to advance next-generation coronary intravascular imaging and physiological assessment through the integration of artificial intelligence technologies.

Dive into Technavio’s robust research methodology, blending expert interviews, extensive data synthesis, and validated models for unparalleled Medical Imaging Software Market insights. See full methodology.

Market Scope
Page number 302
Base year 2025
Historic period 2020-2024
Forecast period 2026-2030
Growth momentum & CAGR Accelerate at a CAGR of 7.1%
Market growth 2026-2030 USD 3332.5 million
Market structure Fragmented
YoY growth 2025-2026(%) 6.7%
Key countries US, Canada, Mexico, UK, Germany, France, Italy, The Netherlands, Spain, Russia, China, India, Japan, South Korea, Indonesia, Thailand, Singapore, Australia, Brazil, South Africa, Saudi Arabia, UAE and Turkey
Competitive landscape Leading Companies, Market Positioning of Companies, Competitive Strategies, and Industry Risks

Request Free Sample

Research Analyst Overview

  • The medical imaging software market is driven by the imperative to translate vast amounts of visual data into actionable clinical insights. The integration of quantitative imaging biomarkers and radiomics data characterization is foundational to this shift, enabling a transition from qualitative assessment to objective measurement.
  • Boardroom decisions increasingly center on adopting advanced visualization software and multimodal imaging fusion technologies to maintain a competitive edge and improve diagnostic certainty. Deploying longitudinal tracking software is now a strategic priority for managing chronic diseases effectively. The adoption of deep learning algorithms for automated image segmentation has proven to increase radiologist throughput by over 20%.
  • Technologies such as three-dimensional reconstruction, virtual and augmented reality, and theranostics quantification are no longer niche but are becoming central to personalized treatment planning. Furthermore, the backbone of this evolution rests on cloud-native architectures, which support predictive analytics models and ensure seamless electronic health records integration through standards like digital imaging and communications in medicine.
  • Investments in picture archiving and communication systems and vendor-neutral archives are critical for future-proofing healthcare IT infrastructure.

What are the Key Data Covered in this Medical Imaging Software Market Research and Growth Report?

  • What is the expected growth of the Medical Imaging Software Market between 2026 and 2030?

    • USD 3.33 billion, at a CAGR of 7.1%

  • What segmentation does the market report cover?

    • The report is segmented by Deployment (On-premises, Cloud-based, and Hybrid), End-user (Hospitals, Diagnostic Imaging Centers, and Others), Modality (Computed tomography, Magnetic resonance imaging, Ultrasound imaging, X-ray imaging, and Others) and Geography (North America, Europe, Asia, Rest of World (ROW))

  • Which regions are analyzed in the report?

    • North America, Europe, Asia and Rest of World (ROW)

  • What are the key growth drivers and market challenges?

    • Transition toward precision medicine and utilization of quantitative imaging biomarkers, Prohibitive capital investment and maintenance expenditures

  • Who are the major players in the Medical Imaging Software Market?

    • Agfa Gevaert NV, Aidoc Medical Ltd., AnalyzeDirect Inc., Canon Medical Systems Corp., Carestream Health Inc., FUJIFILM Holdings Corp., GE HealthCare Technologies, INFINITT North America, Koninklijke Philips N.V., Merative L.P., Microsoft Corp., MIM Software Inc., Mirada Medical Ltd., NovaRad, NVIDIA Corp., RamSoft Inc., Sectra AB, Siemens Healthineers AG, United Health Group Inc. and Visage Imaging

Market Research Insights

  • The market's momentum is shaped by the convergence of advanced technology and evolving healthcare demands. The expansion of tele-radiology frameworks has broadened diagnostic access, while the adoption of software-as-a-service models is lowering financial barriers to entry, reducing upfront IT expenditure by over 60% compared to traditional installations.
  • Value-based healthcare models are driving investment in solutions that deliver measurable clinical and financial returns. This shift is supported by AI-driven visualization software and cloud-enabled clinical decision support tools that improve diagnostic precision. The integration of ai-powered brain imaging is enhancing neurological assessments, with some algorithms improving anomaly detection rates by 25%.
  • Consequently, unified clinical workflows are becoming standard, streamlining operations from image acquisition to reporting.

We can help! Our analysts can customize this medical imaging software market research report to meet your requirements.

Get in touch

1. Executive Summary

1.1 Market overview

Executive Summary - Chart on Market Overview
Executive Summary - Data Table on Market Overview
Executive Summary - Chart on Global Market Characteristics
Executive Summary - Chart on Market by Geography
Executive Summary - Chart on Market Segmentation by Deployment
Executive Summary - Chart on Market Segmentation by End-user
Executive Summary - Chart on Market Segmentation by Modality
Executive Summary - Chart on Incremental Growth
Executive Summary - Data Table on Incremental Growth
Executive Summary - Chart on Company Market Positioning

2. Technavio Analysis

2.1 Analysis of price sensitivity, lifecycle, customer purchase basket, adoption rates, and purchase criteria

2.2 Criticality of inputs and Factors of differentiation

Chart on Overview on criticality of inputs and factors of differentiation

2.3 Factors of disruption

Chart on Overview on factors of disruption

2.4 Impact of drivers and challenges

Chart on Impact of drivers and challenges in 2025 and 2030

3. Market Landscape

3.1 Market ecosystem

Chart on Parent Market
Data Table on - Parent Market

3.2 Market characteristics

Chart on Market characteristics analysis

3.3 Value chain analysis

Chart on Value chain analysis

4. Market Sizing

4.1 Market definition

Data Table on Offerings of companies included in the market definition

4.2 Market segment analysis

Market segments

4.3 Market size 2025

4.4 Market outlook: Forecast for 2025-2030

Chart on Global - Market size and forecast 2025-2030 ($ million)
Data Table on Global - Market size and forecast 2025-2030 ($ million)
Chart on Global Market: Year-over-year growth 2025-2030 (%)
Data Table on Global Market: Year-over-year growth 2025-2030 (%)

5. Historic Market Size

5.1 Global Medical Imaging Software Market 2020 - 2024

Historic Market Size - Data Table on Global Medical Imaging Software Market 2020 - 2024 ($ million)

5.2 Deployment segment analysis 2020 - 2024

Historic Market Size - Deployment Segment 2020 - 2024 ($ million)

5.3 End-user segment analysis 2020 - 2024

Historic Market Size - End-user Segment 2020 - 2024 ($ million)

5.4 Modality segment analysis 2020 - 2024

Historic Market Size - Modality Segment 2020 - 2024 ($ million)

5.5 Geography segment analysis 2020 - 2024

Historic Market Size - Geography Segment 2020 - 2024 ($ million)

5.6 Country segment analysis 2020 - 2024

Historic Market Size - Country Segment 2020 - 2024 ($ million)

6. Qualitative Analysis

6.1 Impact of AI on Global Medical Imaging Software Market

7. Five Forces Analysis

7.1 Five forces summary

Five forces analysis - Comparison between 2025 and 2030

7.2 Bargaining power of buyers

Bargaining power of buyers - Impact of key factors 2025 and 2030

7.3 Bargaining power of suppliers

Bargaining power of suppliers - Impact of key factors in 2025 and 2030

7.4 Threat of new entrants

Threat of new entrants - Impact of key factors in 2025 and 2030

7.5 Threat of substitutes

Threat of substitutes - Impact of key factors in 2025 and 2030

7.6 Threat of rivalry

Threat of rivalry - Impact of key factors in 2025 and 2030

7.7 Market condition

Chart on Market condition - Five forces 2025 and 2030

8. Market Segmentation by Deployment

8.1 Market segments

Chart on Deployment - Market share 2025-2030 (%)
Data Table on Deployment - Market share 2025-2030 (%)

8.2 Comparison by Deployment

Chart on Comparison by Deployment
Data Table on Comparison by Deployment

8.3 On-premises - Market size and forecast 2025-2030

Chart on On-premises - Market size and forecast 2025-2030 ($ million)
Data Table on On-premises - Market size and forecast 2025-2030 ($ million)
Chart on On-premises - Year-over-year growth 2025-2030 (%)
Data Table on On-premises - Year-over-year growth 2025-2030 (%)

8.4 Cloud-based - Market size and forecast 2025-2030

Chart on Cloud-based - Market size and forecast 2025-2030 ($ million)
Data Table on Cloud-based - Market size and forecast 2025-2030 ($ million)
Chart on Cloud-based - Year-over-year growth 2025-2030 (%)
Data Table on Cloud-based - Year-over-year growth 2025-2030 (%)

8.5 Hybrid - Market size and forecast 2025-2030

Chart on Hybrid - Market size and forecast 2025-2030 ($ million)
Data Table on Hybrid - Market size and forecast 2025-2030 ($ million)
Chart on Hybrid - Year-over-year growth 2025-2030 (%)
Data Table on Hybrid - Year-over-year growth 2025-2030 (%)

8.6 Market opportunity by Deployment

Market opportunity by Deployment ($ million)
Data Table on Market opportunity by Deployment ($ million)

9. Market Segmentation by End-user

9.1 Market segments

Chart on End-user - Market share 2025-2030 (%)
Data Table on End-user - Market share 2025-2030 (%)

9.2 Comparison by End-user

Chart on Comparison by End-user
Data Table on Comparison by End-user

9.3 Hospitals - Market size and forecast 2025-2030

Chart on Hospitals - Market size and forecast 2025-2030 ($ million)
Data Table on Hospitals - Market size and forecast 2025-2030 ($ million)
Chart on Hospitals - Year-over-year growth 2025-2030 (%)
Data Table on Hospitals - Year-over-year growth 2025-2030 (%)

9.4 Diagnostic imaging centers - Market size and forecast 2025-2030

Chart on Diagnostic imaging centers - Market size and forecast 2025-2030 ($ million)
Data Table on Diagnostic imaging centers - Market size and forecast 2025-2030 ($ million)
Chart on Diagnostic imaging centers - Year-over-year growth 2025-2030 (%)
Data Table on Diagnostic imaging centers - Year-over-year growth 2025-2030 (%)

9.5 Others - Market size and forecast 2025-2030

Chart on Others - Market size and forecast 2025-2030 ($ million)
Data Table on Others - Market size and forecast 2025-2030 ($ million)
Chart on Others - Year-over-year growth 2025-2030 (%)
Data Table on Others - Year-over-year growth 2025-2030 (%)

9.6 Market opportunity by End-user

Market opportunity by End-user ($ million)
Data Table on Market opportunity by End-user ($ million)

10. Market Segmentation by Modality

10.1 Market segments

Chart on Modality - Market share 2025-2030 (%)
Data Table on Modality - Market share 2025-2030 (%)

10.2 Comparison by Modality

Chart on Comparison by Modality
Data Table on Comparison by Modality

10.3 Computed tomography - Market size and forecast 2025-2030

Chart on Computed tomography - Market size and forecast 2025-2030 ($ million)
Data Table on Computed tomography - Market size and forecast 2025-2030 ($ million)
Chart on Computed tomography - Year-over-year growth 2025-2030 (%)
Data Table on Computed tomography - Year-over-year growth 2025-2030 (%)

10.4 Magnetic resonance imaging - Market size and forecast 2025-2030

Chart on Magnetic resonance imaging - Market size and forecast 2025-2030 ($ million)
Data Table on Magnetic resonance imaging - Market size and forecast 2025-2030 ($ million)
Chart on Magnetic resonance imaging - Year-over-year growth 2025-2030 (%)
Data Table on Magnetic resonance imaging - Year-over-year growth 2025-2030 (%)

10.5 Ultrasound imaging - Market size and forecast 2025-2030

Chart on Ultrasound imaging - Market size and forecast 2025-2030 ($ million)
Data Table on Ultrasound imaging - Market size and forecast 2025-2030 ($ million)
Chart on Ultrasound imaging - Year-over-year growth 2025-2030 (%)
Data Table on Ultrasound imaging - Year-over-year growth 2025-2030 (%)

10.6 X-ray imaging - Market size and forecast 2025-2030

Chart on X-ray imaging - Market size and forecast 2025-2030 ($ million)
Data Table on X-ray imaging - Market size and forecast 2025-2030 ($ million)
Chart on X-ray imaging - Year-over-year growth 2025-2030 (%)
Data Table on X-ray imaging - Year-over-year growth 2025-2030 (%)

10.7 Others - Market size and forecast 2025-2030

Chart on Others - Market size and forecast 2025-2030 ($ million)
Data Table on Others - Market size and forecast 2025-2030 ($ million)
Chart on Others - Year-over-year growth 2025-2030 (%)
Data Table on Others - Year-over-year growth 2025-2030 (%)

10.8 Market opportunity by Modality

Market opportunity by Modality ($ million)
Data Table on Market opportunity by Modality ($ million)

11. Customer Landscape

11.1 Customer landscape overview

Analysis of price sensitivity, lifecycle, customer purchase basket, adoption rates, and purchase criteria

12. Geographic Landscape

12.1 Geographic segmentation

Chart on Market share by geography 2025-2030 (%)
Data Table on Market share by geography 2025-2030 (%)

12.2 Geographic comparison

Chart on Geographic comparison
Data Table on Geographic comparison

12.3 North America - Market size and forecast 2025-2030

Chart on North America - Market size and forecast 2025-2030 ($ million)
Data Table on North America - Market size and forecast 2025-2030 ($ million)
Chart on North America - Year-over-year growth 2025-2030 (%)
Data Table on North America - Year-over-year growth 2025-2030 (%)
Chart on Regional Comparison - North America
Data Table on Regional Comparison - North America

12.3.1 US - Market size and forecast 2025-2030

Chart on US - Market size and forecast 2025-2030 ($ million)
Data Table on US - Market size and forecast 2025-2030 ($ million)
Chart on US - Year-over-year growth 2025-2030 (%)
Data Table on US - Year-over-year growth 2025-2030 (%)

12.3.2 Canada - Market size and forecast 2025-2030

Chart on Canada - Market size and forecast 2025-2030 ($ million)
Data Table on Canada - Market size and forecast 2025-2030 ($ million)
Chart on Canada - Year-over-year growth 2025-2030 (%)
Data Table on Canada - Year-over-year growth 2025-2030 (%)

12.3.3 Mexico - Market size and forecast 2025-2030

Chart on Mexico - Market size and forecast 2025-2030 ($ million)
Data Table on Mexico - Market size and forecast 2025-2030 ($ million)
Chart on Mexico - Year-over-year growth 2025-2030 (%)
Data Table on Mexico - Year-over-year growth 2025-2030 (%)

12.4 Europe - Market size and forecast 2025-2030

Chart on Europe - Market size and forecast 2025-2030 ($ million)
Data Table on Europe - Market size and forecast 2025-2030 ($ million)
Chart on Europe - Year-over-year growth 2025-2030 (%)
Data Table on Europe - Year-over-year growth 2025-2030 (%)
Chart on Regional Comparison - Europe
Data Table on Regional Comparison - Europe

12.4.1 UK - Market size and forecast 2025-2030

Chart on UK - Market size and forecast 2025-2030 ($ million)
Data Table on UK - Market size and forecast 2025-2030 ($ million)
Chart on UK - Year-over-year growth 2025-2030 (%)
Data Table on UK - Year-over-year growth 2025-2030 (%)

12.4.2 Germany - Market size and forecast 2025-2030

Chart on Germany - Market size and forecast 2025-2030 ($ million)
Data Table on Germany - Market size and forecast 2025-2030 ($ million)
Chart on Germany - Year-over-year growth 2025-2030 (%)
Data Table on Germany - Year-over-year growth 2025-2030 (%)

12.4.3 France - Market size and forecast 2025-2030

Chart on France - Market size and forecast 2025-2030 ($ million)
Data Table on France - Market size and forecast 2025-2030 ($ million)
Chart on France - Year-over-year growth 2025-2030 (%)
Data Table on France - Year-over-year growth 2025-2030 (%)

12.4.4 Italy - Market size and forecast 2025-2030

Chart on Italy - Market size and forecast 2025-2030 ($ million)
Data Table on Italy - Market size and forecast 2025-2030 ($ million)
Chart on Italy - Year-over-year growth 2025-2030 (%)
Data Table on Italy - Year-over-year growth 2025-2030 (%)

12.4.5 The Netherlands - Market size and forecast 2025-2030

Chart on The Netherlands - Market size and forecast 2025-2030 ($ million)
Data Table on The Netherlands - Market size and forecast 2025-2030 ($ million)
Chart on The Netherlands - Year-over-year growth 2025-2030 (%)
Data Table on The Netherlands - Year-over-year growth 2025-2030 (%)

12.4.6 Spain - Market size and forecast 2025-2030

Chart on Spain - Market size and forecast 2025-2030 ($ million)
Data Table on Spain - Market size and forecast 2025-2030 ($ million)
Chart on Spain - Year-over-year growth 2025-2030 (%)
Data Table on Spain - Year-over-year growth 2025-2030 (%)

12.4.7 Russia - Market size and forecast 2025-2030

Chart on Russia - Market size and forecast 2025-2030 ($ million)
Data Table on Russia - Market size and forecast 2025-2030 ($ million)
Chart on Russia - Year-over-year growth 2025-2030 (%)
Data Table on Russia - Year-over-year growth 2025-2030 (%)

12.5 Asia - Market size and forecast 2025-2030

Chart on Asia - Market size and forecast 2025-2030 ($ million)
Data Table on Asia - Market size and forecast 2025-2030 ($ million)
Chart on Asia - Year-over-year growth 2025-2030 (%)
Data Table on Asia - Year-over-year growth 2025-2030 (%)
Chart on Regional Comparison - Asia
Data Table on Regional Comparison - Asia

12.5.1 China - Market size and forecast 2025-2030

Chart on China - Market size and forecast 2025-2030 ($ million)
Data Table on China - Market size and forecast 2025-2030 ($ million)
Chart on China - Year-over-year growth 2025-2030 (%)
Data Table on China - Year-over-year growth 2025-2030 (%)

12.5.2 India - Market size and forecast 2025-2030

Chart on India - Market size and forecast 2025-2030 ($ million)
Data Table on India - Market size and forecast 2025-2030 ($ million)
Chart on India - Year-over-year growth 2025-2030 (%)
Data Table on India - Year-over-year growth 2025-2030 (%)

12.5.3 Japan - Market size and forecast 2025-2030

Chart on Japan - Market size and forecast 2025-2030 ($ million)
Data Table on Japan - Market size and forecast 2025-2030 ($ million)
Chart on Japan - Year-over-year growth 2025-2030 (%)
Data Table on Japan - Year-over-year growth 2025-2030 (%)

12.5.4 South Korea - Market size and forecast 2025-2030

Chart on South Korea - Market size and forecast 2025-2030 ($ million)
Data Table on South Korea - Market size and forecast 2025-2030 ($ million)
Chart on South Korea - Year-over-year growth 2025-2030 (%)
Data Table on South Korea - Year-over-year growth 2025-2030 (%)

12.5.5 Indonesia - Market size and forecast 2025-2030

Chart on Indonesia - Market size and forecast 2025-2030 ($ million)
Data Table on Indonesia - Market size and forecast 2025-2030 ($ million)
Chart on Indonesia - Year-over-year growth 2025-2030 (%)
Data Table on Indonesia - Year-over-year growth 2025-2030 (%)

12.5.6 Thailand - Market size and forecast 2025-2030

Chart on Thailand - Market size and forecast 2025-2030 ($ million)
Data Table on Thailand - Market size and forecast 2025-2030 ($ million)
Chart on Thailand - Year-over-year growth 2025-2030 (%)
Data Table on Thailand - Year-over-year growth 2025-2030 (%)

12.5.7 Singapore - Market size and forecast 2025-2030

Chart on Singapore - Market size and forecast 2025-2030 ($ million)
Data Table on Singapore - Market size and forecast 2025-2030 ($ million)
Chart on Singapore - Year-over-year growth 2025-2030 (%)
Data Table on Singapore - Year-over-year growth 2025-2030 (%)

12.6 Rest of World (ROW) - Market size and forecast 2025-2030

Chart on Rest of World (ROW) - Market size and forecast 2025-2030 ($ million)
Data Table on Rest of World (ROW) - Market size and forecast 2025-2030 ($ million)
Chart on Rest of World (ROW) - Year-over-year growth 2025-2030 (%)
Data Table on Rest of World (ROW) - Year-over-year growth 2025-2030 (%)
Chart on Regional Comparison - Rest of World (ROW)
Data Table on Regional Comparison - Rest of World (ROW)

12.6.1 Australia - Market size and forecast 2025-2030

Chart on Australia - Market size and forecast 2025-2030 ($ million)
Data Table on Australia - Market size and forecast 2025-2030 ($ million)
Chart on Australia - Year-over-year growth 2025-2030 (%)
Data Table on Australia - Year-over-year growth 2025-2030 (%)

12.6.2 Brazil - Market size and forecast 2025-2030

Chart on Brazil - Market size and forecast 2025-2030 ($ million)
Data Table on Brazil - Market size and forecast 2025-2030 ($ million)
Chart on Brazil - Year-over-year growth 2025-2030 (%)
Data Table on Brazil - Year-over-year growth 2025-2030 (%)

12.6.3 South Africa - Market size and forecast 2025-2030

Chart on South Africa - Market size and forecast 2025-2030 ($ million)
Data Table on South Africa - Market size and forecast 2025-2030 ($ million)
Chart on South Africa - Year-over-year growth 2025-2030 (%)
Data Table on South Africa - Year-over-year growth 2025-2030 (%)

12.6.4 Saudi Arabia - Market size and forecast 2025-2030

Chart on Saudi Arabia - Market size and forecast 2025-2030 ($ million)
Data Table on Saudi Arabia - Market size and forecast 2025-2030 ($ million)
Chart on Saudi Arabia - Year-over-year growth 2025-2030 (%)
Data Table on Saudi Arabia - Year-over-year growth 2025-2030 (%)

12.6.5 UAE - Market size and forecast 2025-2030

Chart on UAE - Market size and forecast 2025-2030 ($ million)
Data Table on UAE - Market size and forecast 2025-2030 ($ million)
Chart on UAE - Year-over-year growth 2025-2030 (%)
Data Table on UAE - Year-over-year growth 2025-2030 (%)

12.6.6 Turkey - Market size and forecast 2025-2030

Chart on Turkey - Market size and forecast 2025-2030 ($ million)
Data Table on Turkey - Market size and forecast 2025-2030 ($ million)
Chart on Turkey - Year-over-year growth 2025-2030 (%)
Data Table on Turkey - Year-over-year growth 2025-2030 (%)

12.7 Market opportunity by geography

Market opportunity by geography ($ million)
Data Tables on Market opportunity by geography ($ million)

13. Drivers, Challenges, and Opportunity

13.1 Market drivers

Transition toward precision medicine and utilization of quantitative imaging biomarkers
Escalating prevalence of chronic diseases and geriatric population requirements
Expansion of cloud computing and tele-radiology frameworks

13.2 Market challenges

Prohibitive capital investment and maintenance expenditures
Stringent regulatory requirements and cybersecurity threats
Technical limitations in interoperability and data standardization

13.3 Impact of drivers and challenges

Impact of drivers and challenges in 2025 and 2030

13.4 Market opportunities

Integration of AI and machine learning in diagnostic workflows
Proliferation of cloud-native architectures and software-as-a-service models
Expansion of multimodal imaging and three-dimensional visualization

14. Competitive Landscape

14.1 Overview

14.2

Overview on criticality of inputs and factors of differentiation

14.3 Landscape disruption

Overview on factors of disruption

14.4 Industry risks

Impact of key risks on business

15. Competitive Analysis

15.1 Companies profiled

Companies covered

15.2 Company ranking index

15.3 Market positioning of companies

Matrix on companies position and classification

15.4 Agfa Gevaert NV

Agfa Gevaert NV - Overview
Agfa Gevaert NV - Business segments
Agfa Gevaert NV - Key news
Agfa Gevaert NV - Key offerings
Agfa Gevaert NV - Segment focus
SWOT

15.5 AnalyzeDirect Inc.

AnalyzeDirect Inc. - Overview
AnalyzeDirect Inc. - Product / Service
AnalyzeDirect Inc. - Key offerings
SWOT

15.6 Carestream Health Inc.

Carestream Health Inc. - Overview
Carestream Health Inc. - Product / Service
Carestream Health Inc. - Key offerings
SWOT

15.7 FUJIFILM Holdings Corp.

FUJIFILM Holdings Corp. - Overview
FUJIFILM Holdings Corp. - Business segments
FUJIFILM Holdings Corp. - Key news
FUJIFILM Holdings Corp. - Key offerings
FUJIFILM Holdings Corp. - Segment focus
SWOT

15.8 GE HealthCare Technologies

GE HealthCare Technologies - Overview
GE HealthCare Technologies - Business segments
GE HealthCare Technologies - Key news
GE HealthCare Technologies - Key offerings
GE HealthCare Technologies - Segment focus
SWOT

15.9 Koninklijke Philips N.V.

Koninklijke Philips N.V. - Overview
Koninklijke Philips N.V. - Business segments
Koninklijke Philips N.V. - Key news
Koninklijke Philips N.V. - Key offerings
Koninklijke Philips N.V. - Segment focus
SWOT

15.10 Merative L.P.

Merative L.P. - Overview
Merative L.P. - Product / Service
Merative L.P. - Key offerings
SWOT

15.11 Microsoft Corp.

Microsoft Corp. - Overview
Microsoft Corp. - Business segments
Microsoft Corp. - Key news
Microsoft Corp. - Key offerings
Microsoft Corp. - Segment focus
SWOT

15.12 Mirada Medical Ltd.

Mirada Medical Ltd. - Overview
Mirada Medical Ltd. - Product / Service
Mirada Medical Ltd. - Key offerings
SWOT

15.13 NovaRad

NovaRad - Overview
NovaRad - Product / Service
NovaRad - Key offerings
SWOT

15.14 RamSoft Inc.

RamSoft Inc. - Overview
RamSoft Inc. - Product / Service
RamSoft Inc. - Key offerings
SWOT

15.15 Sectra AB

Sectra AB - Overview
Sectra AB - Business segments
Sectra AB - Key offerings
Sectra AB - Segment focus
SWOT

15.16 Siemens Healthineers AG

Siemens Healthineers AG - Overview
Siemens Healthineers AG - Business segments
Siemens Healthineers AG - Key news
Siemens Healthineers AG - Key offerings
Siemens Healthineers AG - Segment focus
SWOT

15.17 United Health Group Inc.

United Health Group Inc. - Overview
United Health Group Inc. - Business segments
United Health Group Inc. - Key offerings
United Health Group Inc. - Segment focus
SWOT

15.18 Visage Imaging

Visage Imaging - Overview
Visage Imaging - Product / Service
Visage Imaging - Key offerings
SWOT

16. Appendix

16.1 Scope of the report

Market definition
Objectives
Notes and caveats

16.2 Inclusions and exclusions checklist

Inclusions checklist
Exclusions checklist

16.3 Currency conversion rates for US$

16.4 Research methodology

16.5 Data procurement

Information sources

16.6 Data validation

16.7 Validation techniques employed for market sizing

16.8 Data synthesis

16.9 360 degree market analysis

16.10 List of abbreviations

Research Methodology

Technavio presents a detailed picture of the market by way of study, synthesis, and summation of data from multiple sources. The analysts have presented the various facets of the market with a particular focus on identifying the key industry influencers. The data thus presented is comprehensive, reliable, and the result of extensive research, both primary and secondary.

INFORMATION SOURCES

Primary sources

  • Manufacturers and suppliers
  • Channel partners
  • Industry experts
  • Strategic decision makers

Secondary sources

  • Industry journals and periodicals
  • Government data
  • Financial reports of key industry players
  • Historical data
  • Press releases

DATA ANALYSIS

Data Synthesis

  • Collation of data
  • Estimation of key figures
  • Analysis of derived insights

Data Validation

  • Triangulation with data models
  • Reference against proprietary databases
  • Corroboration with industry experts

REPORT WRITING

Qualitative

  • Market drivers
  • Market challenges
  • Market trends
  • Five forces analysis

Quantitative

  • Market size and forecast
  • Market segmentation
  • Geographical insights
  • Competitive landscape

Interested in this report?

Get your sample now to see our research methodology and insights!

Download Now

Frequently Asked Questions

Medical Imaging Software market growth will increase by USD 3332.5 million during 2026-2030.

The Medical Imaging Software market is expected to grow at a CAGR of 7.1% during 2026-2030.

Medical Imaging Software market is segmented by Deployment (On-premises, Cloud-based, Hybrid) End-user (Hospitals, Diagnostic imaging centers, Others) Modality (Computed tomography, Magnetic resonance imaging, Ultrasound imaging, X-ray imaging, Others)

Agfa Gevaert NV, Aidoc Medical Ltd., AnalyzeDirect Inc., Canon Medical Systems Corp., Carestream Health Inc., FUJIFILM Holdings Corp., GE HealthCare Technologies, INFINITT North America, Koninklijke Philips N.V., Merative L.P., Microsoft Corp., MIM Software Inc., Mirada Medical Ltd., NovaRad, NVIDIA Corp., RamSoft Inc., Sectra AB, Siemens Healthineers AG, United Health Group Inc., Visage Imaging are a few of the key vendors in the Medical Imaging Software market.

North America will register the highest growth rate of 33% among the other regions. Therefore, the Medical Imaging Software market in North America is expected to garner significant business opportunities for the vendors during the forecast period.

US, Canada, Mexico, UK, Germany, France, Italy, The Netherlands, Spain, Russia, China, India, Japan, South Korea, Indonesia, Thailand, Singapore, Australia, Brazil, South Africa, Saudi Arabia, UAE, Turkey

  • Transition toward precision medicine and utilization of quantitative imaging biomarkers is the driving factor this market.

The Medical Imaging Software market vendors should focus on grabbing business opportunities from the Deployment segment as it accounted for the largest market share in the base year.
RIA - Research AI Assistant
Ask RIA