MEMS Energy Harvesting Devices Market Size 2024-2028
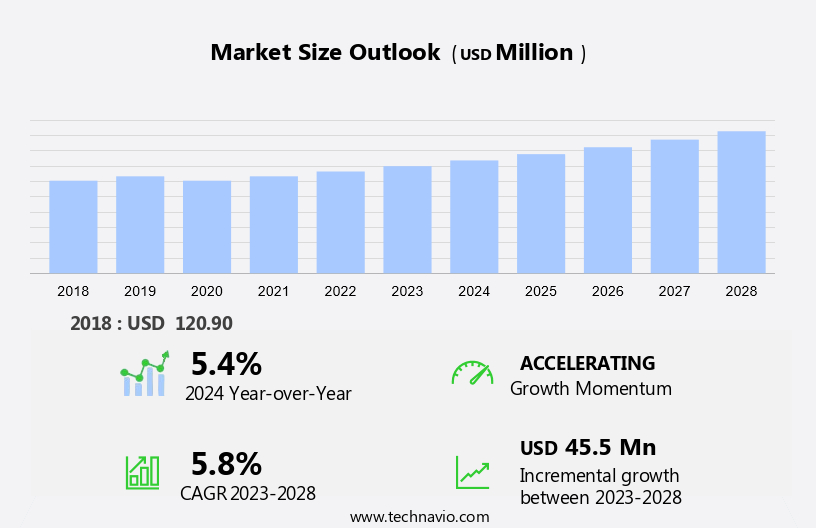
The MEMS energy harvesting devices market size is forecast to increase by USD 45.5 million at a CAGR of 5.8% between 2023 and 2028.
- MEMS (Micro-Electro-Mechanical Systems) energy harvesting devices have gained significant traction in various industries due to their ability to convert ambient energy into electrical power. The market for these devices is driven by several growth factors, including the increasing usage of MEMS energy harvesters as alternatives to micro batteries. Additionally, the integration of MEMS energy harvesters in monitoring devices and sensors is a major trend, as it enables the development of self-sufficient systems that do not require frequent battery replacements. However, there are challenges associated with piezoelectric MEMS energy harvesters, such as their limited power output and sensitivity to vibration levels.
What will be the Size of the Market During the Forecast Period?
- The MEMS (Microelectromechanical Systems) energy harvesting devices market encompasses the production and application of MEMS technologies for generating electrical power from various sources, including vibration, solar, and thermal energy. This market is witnessing significant growth due to the increasing demand for self-sufficient IoT (Internet of Things) devices in industries such as building automation, industry automation, automotive vehicles, smart cities, security systems, and national defense. These solutions enable wireless communication and data transfer in autonomous devices, reducing the need for frequent battery replacements. Key applications include sensors and actuators in bicycle dynamos, solar panels, and vibration energy harvesting from machinery.
- The integration of these devices with big data and IoT technologies is expected to drive market expansion. Overall, this market is poised for strong growth as the demand for sustainable, autonomous, and wireless solutions continues to escalate.
How is this Industry segmented and which is the largest segment?
The industry research report provides comprehensive data (region-wise segment analysis), with forecasts and estimates in "USD million" for the period 2024-2028, as well as historical data from 2018-2022 for the following segments.
- Application
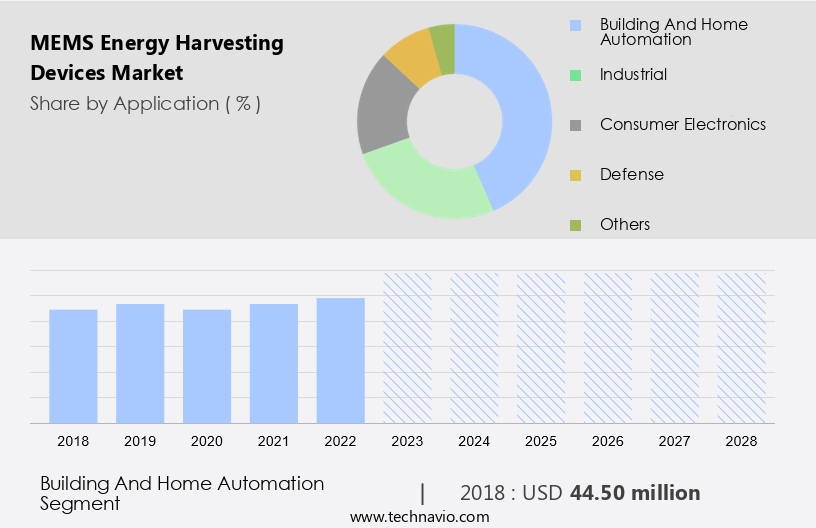
- Building and home automation
- Industrial
- Consumer electronics
- Defense
- Others
- Geography
- Europe
- Germany
- UK
- France
- North America
- Canada
- US
- APAC
- China
- India
- Japan
- South Korea
- Middle East and Africa
- South America
- Europe
By Application Insights
- The building and home automation segment is estimated to witness significant growth during the forecast period.
MEMS energy harvesting devices have gained significant traction in building and home automation applications in developed markets, including Europe and North America. These regions have witnessed a increase In the adoption of smart home devices, such as wireless switches from companies like General Electric, Teleco Automation, Belkin International, and Eaton Corporation. This technology provides power solutions for these wireless switches, offering advantages such as lower inclusion loss, greater isolation, and minimal intermodulation distortion. In addition to smart homes, these devices are utilized in various sectors, including industry automation, automotive vehicles, and smart cities. Applications include temperature gradient harvesting, mechanical vibrations, electromagnetic radiations, and solar radiations.
Get a glance at the MEMS Energy Harvesting Devices Industry report of share of various segments Request Free Sample
The building and home automation segment was valued at USD 44.50 million in 2018 and showed a gradual increase during the forecast period.
Regional Analysis
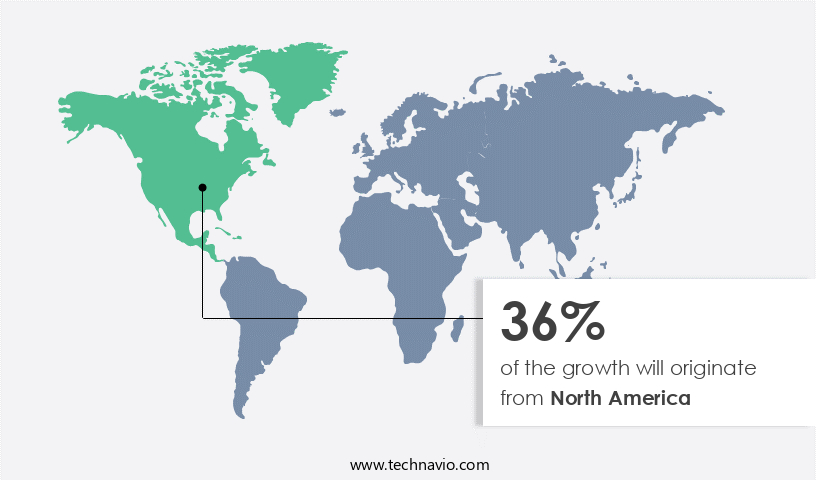
- North America is estimated to contribute 36% to the growth of the global market during the forecast period.
Technavio's analysts have elaborately explained the regional trends and drivers that shape the market during the forecast period.
For more insights on the market share of various regions, Request Free Sample
The market experienced significant growth in Europe in 2023, driven by the automotive industry's expansion in countries like the UK, Germany, and France. These devices are increasingly being used in automotive applications, particularly for tire pressure monitoring systems (TPMS), which can be located on the rim or inner-liner of car tires. Traditional TPMS modules rely on batteries with limited lifetimes, necessitating frequent replacements. MEMS energy harvesters, however, provide long-lasting, small power sources, enabling a few tens of a microwatt average power. This technology offers cost-saving potential for automotive manufacturers and consumers alike. These devices also find applications in building automation, industry automation, smart cities, security systems, big data, IoT, wireless solutions, and various consumer electronics.
Market Dynamics
Our researchers analyzed the data with 2023 as the base year, along with the key drivers, trends, and challenges. A holistic analysis of drivers will help companies refine their marketing strategies to gain a competitive advantage.
What are the key market drivers leading to the rise In the adoption of MEMS Energy Harvesting Devices Industry?
Increasing usage over alternatives such as micro batteries is the key driver of the market.
- MEMS energy harvesting devices, based on Microelectromechanical Systems (MEMS) technology, are gaining traction as a viable alternative to conventional micro-batteries in various industries. The proliferation of IoT technologies and wireless solutions in sectors like building automation, industry automation, automotive vehicles, smart cities, security systems, and consumer electronics necessitates the use of cost-effective and energy-efficient devices. MEMS sensors, actuators, and electronic circuits can harness energy from mechanical vibrations, thermal gradients, electromagnetic radiations, and solar radiations. These energy harvesters power IoT-sensing nodes, enabling the continuous operation of sensors and actuators without the need for frequent battery replacements. The integration of these devices in HVAC systems, energy-efficient LED lighting, and HVAC controls enhances energy efficiency and reduces emissions.
- In the automotive sector, MEMS energy harvesting technology can be used in ambient energy sources like solar panels, bicycle dynamos, and temperature gradient harvesting to power various applications, including smart thermostats and wireless sensor networks. The cost-saving potential of these devices makes them an attractive option for various industries striving towards net zero targets and emissions reduction.
What are the market trends shaping the MEMS Energy Harvesting Devices Industry?
Usage of MEMS energy harvesters in monitoring devices and sensors is the upcoming market trend.
- MEMS energy harvesters, derived from Microelectromechanical Systems (MEMS), have gained significant traction in various monitoring devices and sensors due to their ability to convert ambient energy into electrical power. These applications span from structural health monitoring in inaccessible locations to traffic pattern analysis and natural disaster detection. The impracticality of using batteries In these scenarios, particularly in extreme temperatures or hazardous terrain, necessitates alternative energy solutions. Recent advancements in ultrasmall power integrated circuits have made large-scale integration possible, enabling energy harvesting from mechanical vibrations, thermal gradients, electromagnetic radiations, and solar radiations. This development is crucial for IoT-sensing nodes, sensors/actuators, and energy harvesters, which are essential components of smart cities, building automation, industry automation, automotive vehicles, security systems, smart home devices, wearables, remote patient monitoring, telehealth, HVAC, consumer electronics, clean energy technologies, and net zero targets.
- The integration of MEMS sensors with energy-efficient LED lighting, HVAC controls, and wireless solutions has further enhanced energy efficiency, contributing to emissions reduction and cost savings. MEMS energy harvesters are also utilized in national defense applications, autonomous devices, and wireless sensor networks. The cost-saving potential of MEMS energy harvesters is substantial, particularly in large-scale deployments, making them a valuable investment for businesses and organizations.
What challenges does the MEMS Energy Harvesting Devices Industry face during its growth?
Challenges associated with piezoelectric MEMS energy harvesters is a key challenge affecting the industry growth.
- MEMS (Microelectromechanical Systems) energy harvesters, a key component of IoT (Internet of Things) technologies, convert mechanical vibrations, thermal gradients, electromagnetic radiations, and solar radiations into electrical energy. In various industries, including building automation, industry automation, automotive vehicles, smart cities, security systems, and consumer electronics, MEMS energy harvesters are employed to power sensors, actuators, and electronic circuits. These harvesters are essential for wireless solutions and IoT-sensing nodes, enabling energy-efficient applications such as smart home devices, wearables, remote patient monitoring, telehealth, HVAC controls, energy-efficient LED lighting, and HVAC. MEMS sensors play a crucial role in emissions reduction and net zero targets. MEMS energy harvesters can be categorized based on their active material and power density.
- Piezoelectric MEMS energy harvesters, for instance, convert mechanical vibrations into electrical energy. However, their performance is influenced by their resonant frequency and the ambient energy source. Harvesters with high resonant frequencies or those requiring high ambient energy sources may not be practical for less ambient environments. Furthermore, the bandwidth of piezoelectric harvesters is an essential characteristic, as it determines their performance under unpredictable ambient vibrations. A narrow bandwidth harvester is impractical for most applications due to the uncontrollable frequency of ambient vibrations. MEMS energy harvesters contribute significantly to the cost-saving potential of IoT-enabled systems and autonomous devices, making them a valuable investment for businesses and organizations.
Exclusive Customer Landscape
The market forecasting report includes the adoption lifecycle of the market, covering from the innovator's stage to the laggard's stage. It focuses on adoption rates in different regions based on penetration. Furthermore, the market report also includes key purchase criteria and drivers of price sensitivity to help companies evaluate and develop their market growth analysis strategies.

Customer Landscape
Key Companies & Market Insights
Companies are implementing various strategies, such as strategic alliances, market forecast, partnerships, mergers and acquisitions, geographical expansion, and product/service launches, to enhance their presence in the industry.
The industry research and growth report includes detailed analyses of the competitive landscape of the market and information about key companies, including:
- 8power Ltd.
- ABB Ltd.
- Analog Devices Inc.
- CSEM SA
- Cymbet Corp.
- EH4 GmbH
- Enervibe labs
- EngeniusMicro
- EnOcean GmbH
- Fujitsu Ltd.
- Holst Centre
- Lam Research Corp.
- Parker Hannifin Corp.
- Powercast Corp.
- Radiance Technologies Inc.
- Silent Sensors
- STMicroelectronics International NV
- Texas Instruments Inc.
Qualitative and quantitative analysis of companies has been conducted to help clients understand the wider business environment as well as the strengths and weaknesses of key industry players. Data is qualitatively analyzed to categorize companies as pure play, category-focused, industry-focused, and diversified; it is quantitatively analyzed to categorize companies as dominant, leading, strong, tentative, and weak.
Research Analyst Overview
The market encompasses a range of technologies that convert ambient energy sources into electrical power. This segment of the technology landscape is gaining significant traction due to the increasing demand for self-sufficient, wireless devices and the push towards energy efficiency in various industries. These devices offer a promising solution for powering Internet of Things (IoT) sensors and actuators in building automation, industry automation, and automotive applications. In the realm of building automation, MEMS energy harvesting can provide power for HVAC controls, smart thermostats, and wireless sensor networks, enabling improved energy efficiency and emissions reduction.
Moreover, industry automation stands to benefit from MEMS energy harvesting in various ways. For instance, MEMS sensors can be used to monitor machine performance and detect anomalies, while energy harvesting technologies can power wireless communication between sensors and control systems. This results in a more efficient and cost-effective industrial ecosystem. The automotive sector is another major area of growth for MEMS energy harvesting. MEMS sensors can be integrated into vehicles for various applications, such as temperature monitoring, vibration analysis, and emissions reduction. Energy harvesting technologies can provide power for these sensors and other wireless solutions, eliminating the need for traditional batteries and reducing vehicle weight.
Furthermore, smart cities are another promising application area for MEMS energy harvesting. These cities rely on a vast network of sensors and communication systems to monitor and manage various aspects of urban infrastructure. MEMS energy harvesting can provide power for these IoT-sensing nodes, enabling cost savings and increased efficiency. Security systems represent another application area for MEMS energy harvesting. MEMS sensors can be used to detect intrusions and other security threats, while energy harvesting technologies can power these sensors and wireless communication systems. This results in a more secure and self-sufficient security infrastructure. The integration of MEMS energy harvesting in consumer electronics, clean energy technologies, and wearables is also gaining momentum.
In addition, MEMS sensors can be used in energy-efficient LED lighting, while energy harvesting technologies can provide power for portable devices and smart home devices. This harvesting can also be used in telehealth applications, such as remote patient monitoring, enabling more efficient and cost-effective healthcare delivery. MEMS energy harvesting technologies can harness various energy sources, including mechanical vibrations, thermal gradients, electromagnetic radiations, and solar radiations. These technologies can be used to power ultra-low-power devices, such as sensors and actuators, and can contribute to net zero targets in various industries. The MEMS energy harvesting market is driven by several factors, including the increasing demand for energy efficiency, the proliferation of IoT devices, and the need for self-sufficient, wireless solutions.
Additionally, the market is being fueled by advancements in MEMS sensor technology and the development of more efficient energy harvesting technologies. The market is expected to continue growing as the demand for self-sufficient, wireless devices and the push towards energy efficiency intensifies.
|
Market Scope |
|
|
Report Coverage |
Details |
|
Page number |
167 |
|
Base year |
2023 |
|
Historic period |
2018-2022 |
|
Forecast period |
2024-2028 |
|
Growth momentum & CAGR |
Accelerate at a CAGR of 5.8% |
|
Market growth 2024-2028 |
USD 45.5 million |
|
Market structure |
Fragmented |
|
YoY growth 2023-2024(%) |
5.4 |
|
Key countries |
US, Germany, UK, China, France, Japan, The Netherlands, India, Canada, and South Korea |
|
Competitive landscape |
Leading Companies, market growth and forecasting , Market Positioning of Companies, Competitive Strategies, and Industry Risks |
What are the Key Data Covered in this Market Research and Growth Report?
- CAGR of the MEMS Energy Harvesting Devices industry during the forecast period
- Detailed information on factors that will drive the growth and forecasting between 2024 and 2028
- Precise estimation of the size of the market and its contribution of the industry in focus to the parent market
- Accurate predictions about upcoming growth and trends and changes in consumer behaviour
- Growth of the market across Europe, North America, APAC, Middle East and Africa, and South America
- Thorough analysis of the market's competitive landscape and detailed information about companies
- Comprehensive analysis of factors that will challenge the mems energy harvesting devices market growth of industry companies
We can help! Our analysts can customize this mems energy harvesting devices market research report to meet your requirements.
 RIA -
RIA - 
