MEP Services Market Analysis, Size, and Forecast 2026-2030: North America (US, Canada, and Mexico), APAC (China, India, and Japan), Europe (Germany, UK, and France), South America (Brazil and Argentina), Middle East and Africa (Saudi Arabia, UAE, and South Africa), and Rest of World (ROW)

MEP Services Market Analysis, Size, and Forecast 2026-2030:
North America (US, Canada, and Mexico), APAC (China, India, and Japan), Europe (Germany, UK, and France), South America (Brazil and Argentina), Middle East and Africa (Saudi Arabia, UAE, and South Africa), and Rest of World (ROW)

Published: Mar 2026 283 Pages SKU: IRTNTR74799

Market Overview at a Glance

$124.48 B
Market Opportunity
12.7%
CAGR 2025 - 2030
45.9%
North America Growth
$56.59 B
C and E segment 2024

MEP Services Market Size 2026-2030

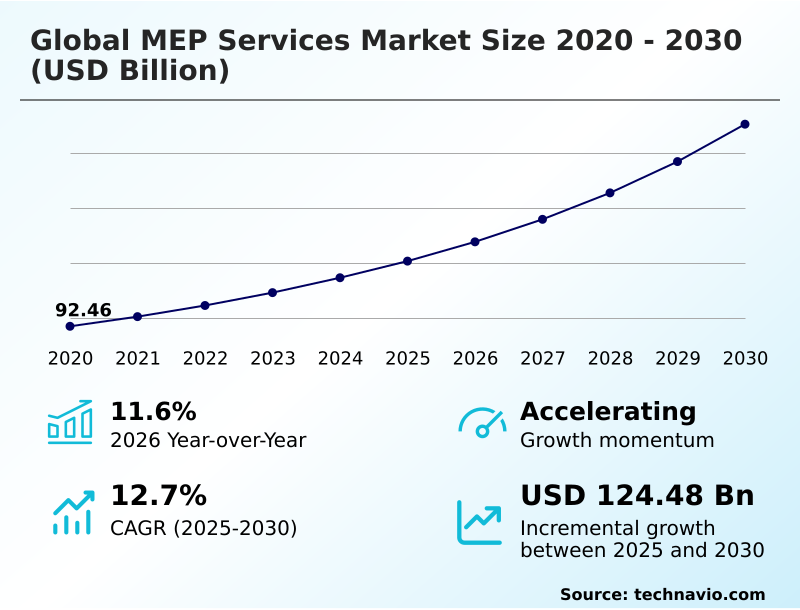
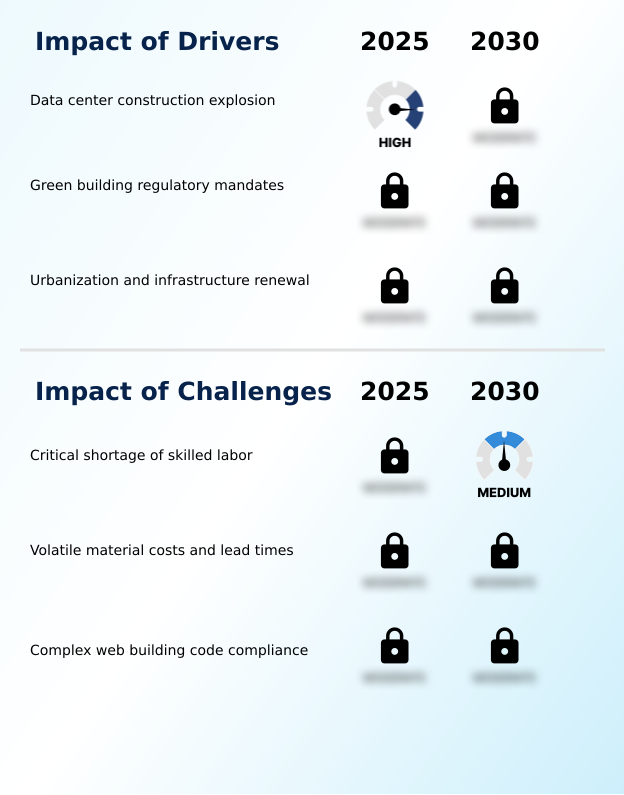
The mep services market size is valued to increase by USD 124.48 billion, at a CAGR of 12.7% from 2025 to 2030. Data center construction explosion will drive the mep services market.

Major Market Trends & Insights

  • North America dominated the market and accounted for a 45.9% growth during the forecast period.
  • By Service - C and E segment was valued at USD 56.59 billion in 2024
  • By End-user - Commercial segment accounted for the largest market revenue share in 2024

Market Size & Forecast

  • Market Opportunities: USD 183.73 billion
  • Market Future Opportunities: USD 124.48 billion
  • CAGR from 2025 to 2030 : 12.7%

Market Summary

  • The MEP services market is undergoing a profound transformation, shifting from traditional construction trades to a data-centric discipline focused on high-performance building systems. This evolution is driven by the critical need for energy efficiency mandates and the global push toward net-zero carbon footprints.
  • The surge in high-density data centers and advanced manufacturing facilities necessitates sophisticated power systems engineering and thermal management. A key trend is the integration of building information modeling and digital twin integration, which allows for predictive maintenance and asset lifecycle management.
  • For instance, in a commercial building retrofit, MEP firms leverage IoT sensors and automated control systems to upgrade legacy equipment. This retrofitting legacy buildings approach not only ensures compliance with modern energy performance standards but also optimizes operational costs through improved water management solutions and hvac maintenance contracts.
  • However, the industry's ability to capitalize on these opportunities is constrained by a persistent shortage of skilled labor, which affects project delivery and profitability. The adoption of prefabrication and modular mep offers a partial solution by moving construction into controlled environments, improving both efficiency and quality assurance. This focus on decarbonization services and sustainable design strategies defines the market's trajectory.

What will be the Size of the MEP Services Market during the forecast period?

Get Key Insights on Market Forecast (PDF) Request Free Sample

How is the MEP Services Market Segmented?

The mep services industry research report provides comprehensive data (region-wise segment analysis), with forecasts and estimates in "USD million" for the period 2026-2030, as well as historical data from 2020-2024 for the following segments.
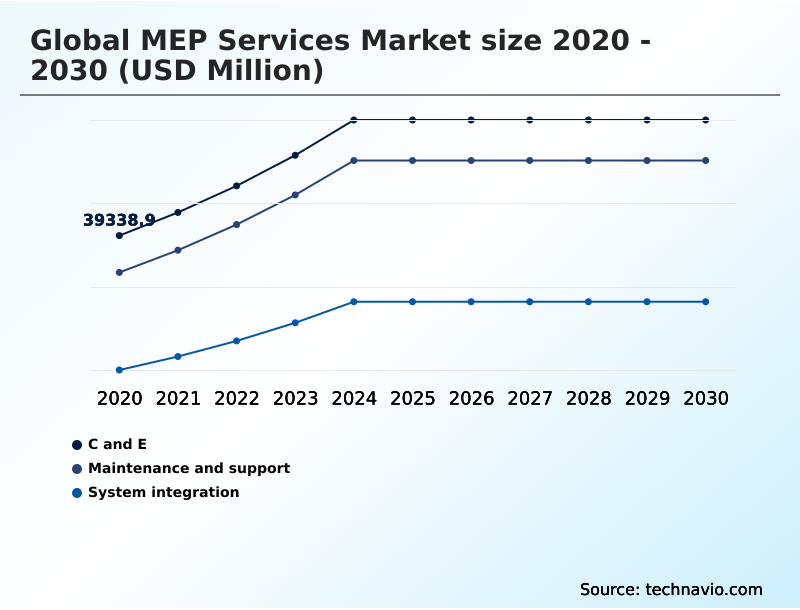
  • Service
    • C and E
    • Maintenance and support
    • System integration
  • End-user
    • Commercial
    • Government
    • Residential
  • Application
    • New construction
    • Renovation and retrofit
    • Maintenance and operations
  • Geography
    • North America
      • US
      • Canada
      • Mexico
    • APAC
      • China
      • India
      • Japan
    • Europe
      • Germany
      • UK
      • France
    • South America
      • Brazil
      • Argentina
    • Middle East and Africa
      • Saudi Arabia
      • UAE
      • South Africa
    • Rest of World (ROW)

By Service Insights

The c and e segment is estimated to witness significant growth during the forecast period.

The market is segmented by service, with consulting and engineering providing the intellectual framework for complex projects. This segment focuses on initial design, feasibility, and pre-construction strategies for heating ventilation and air conditioning, electrical power distribution, and plumbing network design.

Demand for sustainable building consulting and energy efficiency analysis is surging for projects targeting net-zero carbon footprints, especially in high-density data centers. Advanced mep system integration and mep commissioning services are critical.

Firms utilizing digital-first workflows for building thermal management and advanced fire suppression planning report that early-stage modeling improves design accuracy by over 15%.

This approach integrates environmental health sciences considerations and ensures robust construction quality assurance from the outset, moving beyond basic smart building automation.

Request Free Sample

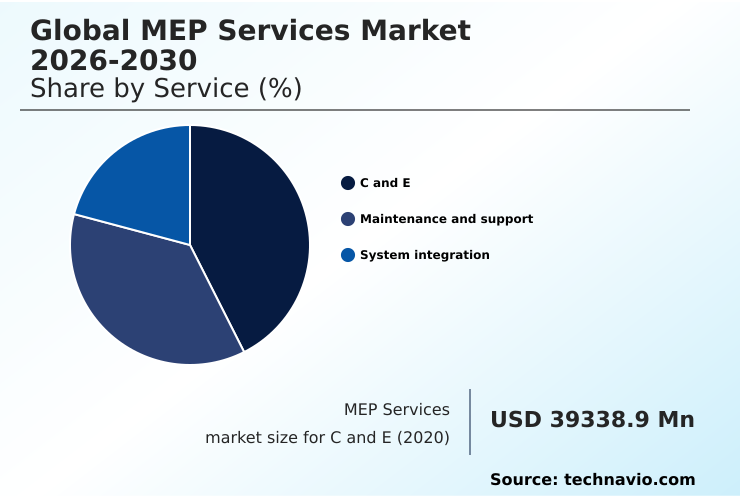
The C and E segment was valued at USD 56.59 billion in 2024 and showed a gradual increase during the forecast period.

Request Free Sample

Regional Analysis

North America is estimated to contribute 45.9% to the growth of the global market during the forecast period.Technavio’s analysts have elaborately explained the regional trends and drivers that shape the market during the forecast period.

See How MEP Services Market Demand is Rising in North America Request Free Sample

North America leads the market, contributing over 45% of incremental growth, driven by extensive infrastructure upgrades and adherence to strict energy efficiency mandates.

The region’s focus on integrated project delivery models and the use of building information modeling are key differentiators.

The APAC region shows the fastest expansion, fueled by significant government-led infrastructure program management and investments in high-tech manufacturing that require specialized cleanroom facility engineering.

Europe's market is defined by its commitment to sustainability, with clean energy consulting and digital twin integration being pivotal. The adoption of advanced project management consultancy for civil engineering services is roughly 30% higher in Western markets.

These firms utilize computational fluid dynamics modeling for electrical load calculation and power redundancy planning for critical facilities, integrating geospatial solutions for mep with architectural design support.

Market Dynamics

Our researchers analyzed the data with 2025 as the base year, along with the key drivers, trends, and challenges. A holistic analysis of drivers will help companies refine their marketing strategies to gain a competitive advantage.

  • The evolution of the global MEP services market 2026-2030 is marked by increasing specialization, driven by complex client demands across various sectors. For instance, mep services for hyperscale data center construction now require advanced liquid cooling solutions for ai data racks to manage extreme thermal loads.
  • The use of bim integration for mep clash detection has become standard practice, improving coordination on intricate projects. This digital approach extends to digital twin technology for mep lifecycle optimization, providing long-term operational value. In the healthcare sector, modular mep prefabrication for healthcare facilities accelerates construction timelines while ensuring quality.
  • Simultaneously, the push for green buildings drives demand for sustainable mep design for net-zero buildings, including the electrification of hvac systems in building retrofits. This complexity requires a new project delivery approach, with integrated project delivery for complex mep projects gaining favor.
  • Such models are crucial for large-scale initiatives like mep retrofitting for aging government buildings and developing mep services for smart city infrastructure. From a technical standpoint, power distribution design for mission-critical facilities and robust fire suppression system design for industrial facilities are non-negotiable.
  • Moreover, mep compliance with ashrae 90.1 standards and effective plumbing design for water-saving initiatives are key regulatory and sustainability considerations. Firms are also leveraging predictive maintenance for mep using iot sensors and automated building controls for energy reduction.
  • In fact, companies that fully integrate these digital tools report a project completion rate that is notably faster than those using traditional methods. However, the industry continues to grapple with addressing skilled labor shortages in mep trades and managing the impact of volatile material costs on mep bids.
  • Finally, the growing semiconductor industry also fuels demand for specialized mep engineering for semiconductor fabrication plants.

What are the key market drivers leading to the rise in the adoption of MEP Services Industry?

  • The exponential growth in data center construction, fueled by digitalization and AI, serves as a primary driver for the market.

  • A key driver is the global investment in grid modernization services and water infrastructure projects, which necessitates advanced water management solutions.
  • The explosion in data center construction also fuels demand, as these facilities require flawless building operations support and facility maintenance services. Governments are funding urban infrastructure planning, including smart-traffic electrical grids, creating opportunities for firms offering turnkey contracting solutions.
  • There is also rising demand for comprehensive security risk management and fire protection engineering. The use of predictive maintenance software is growing, with adopters reporting a 30% reduction in unplanned downtime.
  • This is supported by building performance simulation and code compliance consulting to meet evolving regulations. These complex projects require integrated structural engineering support and a thorough environmental impact assessment.

What are the market trends shaping the MEP Services Industry?

  • The adoption of prefabrication and modular MEP assembly is a significant market trend. This approach is driven by the demand for accelerated project timelines and improved quality control.

  • A primary market trend is the shift toward prefabrication and modular mep, which shortens project timelines by up to 25%. This manufacturing-led approach enhances quality for high-performance building systems. Another key trend is the focus on full asset lifecycle management, driven by decarbonization services and renewable energy integration.
  • Automated control systems are central to this, enabling dynamic mechanical system design and electrical system management. Advanced energy recovery ventilation systems are now standard in new constructions, improving air quality while reducing energy use by 18%.
  • This trend benefits providers of ongoing technical facility services and specialized industrial maintenance solutions, as well as those managing long-term hvac maintenance contracts and utility services engineering for high-tech facility solutions and commercial property management.

What challenges does the MEP Services Industry face during its growth?

  • A critical shortage of skilled labor presents a key challenge, impacting project timelines and constraining industry growth potential.

  • A significant challenge is the complexity of retrofitting legacy buildings to meet modern energy performance standards. Integrating internet of things sensors and automated plumbing diagnostics into aging infrastructure often leads to unforeseen issues, with such projects experiencing schedule overruns 15% more frequently than new builds.
  • The severe shortage of skilled technicians trained in power systems engineering and digital engineering services exacerbates this problem. Volatile material costs also disrupt engineering procurement and construction budgets. Furthermore, ensuring flawless plumbing network design and system integration during building commissioning and retro-commissioning is difficult.
  • Firms must rely on clash detection software to mitigate risks, while also navigating complex life safety code consulting and delivering robust industrial system solutions. This requires a greater emphasis on energy audit services and long-term operation and maintenance contracts.

Exclusive Technavio Analysis on Customer Landscape

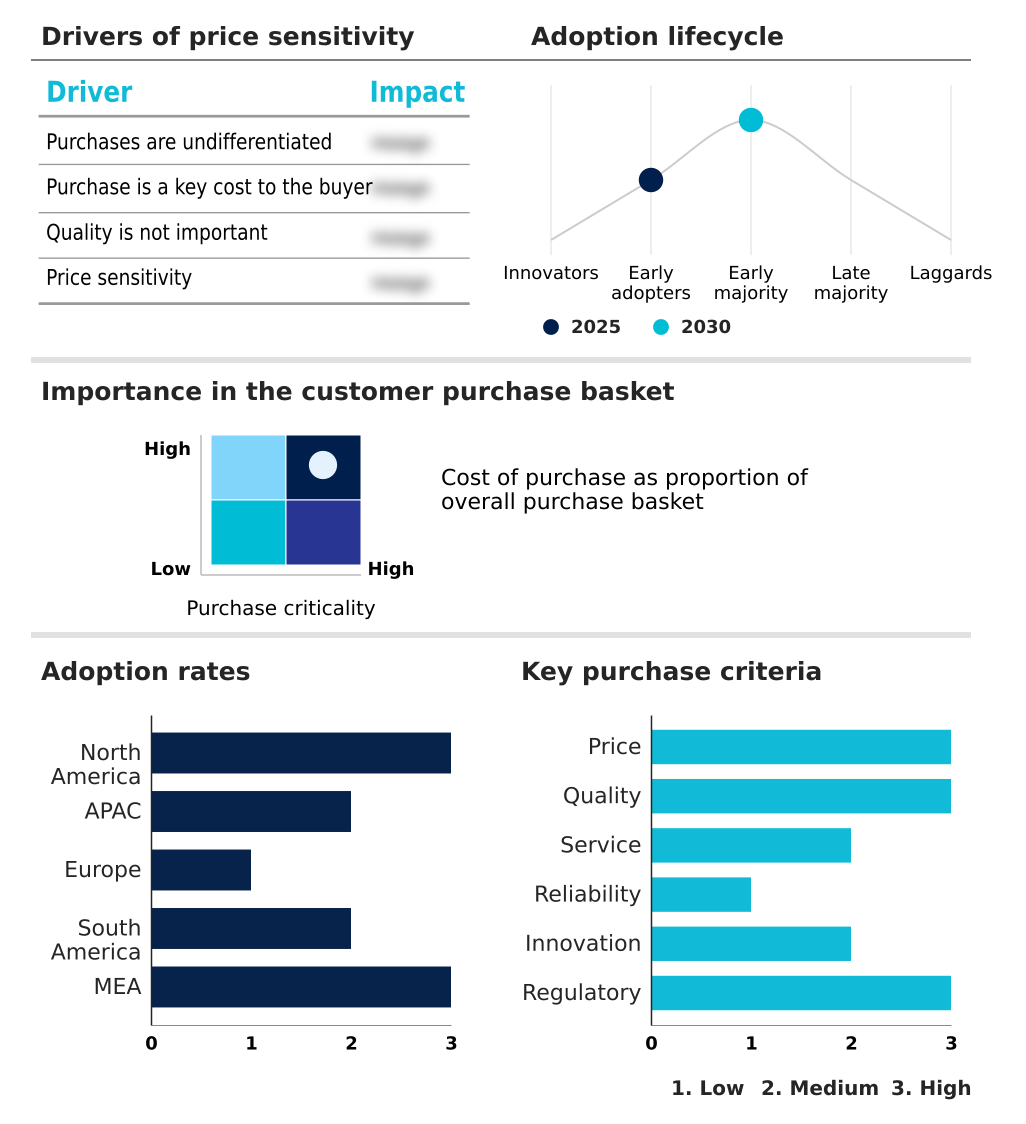
The mep services market forecasting report includes the adoption lifecycle of the market, covering from the innovator’s stage to the laggard’s stage. It focuses on adoption rates in different regions based on penetration. Furthermore, the mep services market report also includes key purchase criteria and drivers of price sensitivity to help companies evaluate and develop their market growth analysis strategies.

Customer Landscape of MEP Services Industry

Competitive Landscape

Companies are implementing various strategies, such as strategic alliances, mep services market forecast, partnerships, mergers and acquisitions, geographical expansion, and product/service launches, to enhance their presence in the industry.

AECOM - Delivers integrated design, engineering, and project management, specializing in complex, large-scale infrastructure and building initiatives on a global scale.

The industry research and growth report includes detailed analyses of the competitive landscape of the market and information about key companies, including:

  • AECOM
  • Burns and McDonnell
  • Continuum Services
  • Crockett Facilities Services
  • Dohn Engineering PLC
  • EMCOR Group Inc.
  • Exyte GmbH
  • Global Facility Solutions LLC
  • IMEG Corp.
  • Jacobs Solutions Inc.
  • Jensen Hughes
  • Knight Facilities Management
  • MEP Engineering Inc.
  • Mott MacDonald
  • NV5 Global Inc.
  • Resolute Engineering
  • Sterling and Wilson Energy
  • WSP Global Inc.

Qualitative and quantitative analysis of companies has been conducted to help clients understand the wider business environment as well as the strengths and weaknesses of key industry players. Data is qualitatively analyzed to categorize companies as pure play, category-focused, industry-focused, and diversified; it is quantitatively analyzed to categorize companies as dominant, leading, strong, tentative, and weak.

Recent Development and News in Mep services market

  • In September, 2024, Vantage Data Centers announced it had secured $1.6 billion in funding to accelerate the expansion of its high-density data center portfolio across the APAC region.
  • In November, 2024, CDC Data Centers received regulatory approval for a major $3.1 billion campus development in Australia, designed to support mission-critical government and enterprise clients.
  • In February, 2025, Google confirmed a $5.5 billion investment plan for developing new computing infrastructure and renewable energy projects in Germany, driving demand for advanced MEP services.
  • In April, 2025, WSP Global Inc. announced a definitive agreement to acquire TRC Companies for approximately $3.3 billion, a strategic move to bolster its capabilities in grid modernization and water infrastructure services in North America.

Dive into Technavio’s robust research methodology, blending expert interviews, extensive data synthesis, and validated models for unparalleled MEP Services Market insights. See full methodology.

Market Scope
Page number 283
Base year 2025
Historic period 2020-2024
Forecast period 2026-2030
Growth momentum & CAGR Accelerate at a CAGR of 12.7%
Market growth 2026-2030 USD 124477.2 million
Market structure Fragmented
YoY growth 2025-2026(%) 11.6%
Key countries US, Canada, Mexico, China, India, Japan, South Korea, Indonesia, Australia, Germany, UK, France, Italy, Spain, The Netherlands, Brazil, Argentina, Chile, Saudi Arabia, UAE, South Africa, Turkey and Israel
Competitive landscape Leading Companies, Market Positioning of Companies, Competitive Strategies, and Industry Risks

Request Free Sample

Research Analyst Overview

  • The MEP services market is defined by a critical pivot towards high-performance building systems and integrated digital engineering services. Core activities now revolve around heating ventilation and air conditioning optimization, electrical power distribution resilience, and innovative water management solutions.
  • The adoption of building information modeling and digital twin integration is no longer optional but a strategic imperative for managing complex projects like high-density data centers and cleanroom facility engineering.
  • Boardroom decisions increasingly focus on investing in predictive maintenance software and automated control systems, as firms using these tools have demonstrated up to a 20% improvement in asset lifecycle management efficiency. This shift is essential for delivering on decarbonization services and achieving net-zero carbon footprints.
  • The technical scope has expanded to include power systems engineering, computational fluid dynamics modeling, and precise electrical load calculation, supported by clash detection software. Key trends include prefabrication and modular mep, which enhances quality control, and retrofitting legacy buildings to meet new energy performance standards.
  • From advanced fire suppression and building thermal management to power redundancy planning, every aspect of a project requires specialized expertise. This includes sustainable design strategies, energy recovery ventilation, and comprehensive facility maintenance services.
  • Firms that master integrated project delivery models and offer end-to-end turnkey contracting solutions for grid modernization services and water infrastructure projects are best positioned for success in this evolving landscape, which also covers smart-traffic electrical grids, automated plumbing diagnostics, and the use of internet of things sensors.

What are the Key Data Covered in this MEP Services Market Research and Growth Report?

  • What is the expected growth of the MEP Services Market between 2026 and 2030?

    • USD 124.48 billion, at a CAGR of 12.7%

  • What segmentation does the market report cover?

    • The report is segmented by Service (C and E, Maintenance and support, and System integration), End-user (Commercial, Government, and Residential), Application (New construction, Renovation and retrofit, and Maintenance and operations) and Geography (North America, APAC, Europe, South America, Middle East and Africa)

  • Which regions are analyzed in the report?

    • North America, APAC, Europe, South America and Middle East and Africa

  • What are the key growth drivers and market challenges?

    • Data center construction explosion, Critical shortage of skilled labor

  • Who are the major players in the MEP Services Market?

    • AECOM, Burns and McDonnell, Continuum Services, Crockett Facilities Services, Dohn Engineering PLC, EMCOR Group Inc., Exyte GmbH, Global Facility Solutions LLC, IMEG Corp., Jacobs Solutions Inc., Jensen Hughes, Knight Facilities Management, MEP Engineering Inc., Mott MacDonald, NV5 Global Inc., Resolute Engineering, Sterling and Wilson Energy and WSP Global Inc.

Market Research Insights

  • The market's dynamism is driven by a shift toward specialized consulting and full lifecycle services. Firms offering sustainable building consulting and energy efficiency analysis are gaining traction as clients prioritize operational performance. The adoption of advanced project management consultancy has been shown to reduce project overruns by up to 20% compared to traditional methods.
  • Furthermore, building commissioning and retro-commissioning services now achieve an average 15% reduction in energy consumption in older commercial properties. This value proposition, supported by comprehensive engineering procurement and construction and long-term operation and maintenance contracts, is becoming crucial.
  • As a result, providers of technical facility services and infrastructure program management that demonstrate verifiable ROI are outperforming competitors by a significant margin.

We can help! Our analysts can customize this mep services market research report to meet your requirements.

Get in touch

1. Executive Summary

1.1 Market overview

Executive Summary - Chart on Market Overview
Executive Summary - Data Table on Market Overview
Executive Summary - Chart on Global Market Characteristics
Executive Summary - Chart on Market by Geography
Executive Summary - Chart on Market Segmentation by Service
Executive Summary - Chart on Market Segmentation by End-user
Executive Summary - Chart on Market Segmentation by Application
Executive Summary - Chart on Incremental Growth
Executive Summary - Data Table on Incremental Growth
Executive Summary - Chart on Company Market Positioning

2. Technavio Analysis

2.1 Analysis of price sensitivity, lifecycle, customer purchase basket, adoption rates, and purchase criteria

2.2 Criticality of inputs and Factors of differentiation

Chart on Overview on criticality of inputs and factors of differentiation

2.3 Factors of disruption

Chart on Overview on factors of disruption

2.4 Impact of drivers and challenges

Chart on Impact of drivers and challenges in 2025 and 2030

3. Market Landscape

3.1 Market ecosystem

Chart on Parent Market
Data Table on - Parent Market

3.2 Market characteristics

Chart on Market characteristics analysis

3.3 Value chain analysis

Chart on Value chain analysis

4. Market Sizing

4.1 Market definition

Data Table on Offerings of companies included in the market definition

4.2 Market segment analysis

Market segments

4.3 Market size 2025

4.4 Market outlook: Forecast for 2025-2030

Chart on Global - Market size and forecast 2025-2030 ($ million)
Data Table on Global - Market size and forecast 2025-2030 ($ million)
Chart on Global Market: Year-over-year growth 2025-2030 (%)
Data Table on Global Market: Year-over-year growth 2025-2030 (%)

5. Historic Market Size

5.1 Global MEP Services Market 2020 - 2024

Historic Market Size - Data Table on Global MEP Services Market 2020 - 2024 ($ million)

5.2 Service segment analysis 2020 - 2024

Historic Market Size - Service Segment 2020 - 2024 ($ million)

5.3 End-user segment analysis 2020 - 2024

Historic Market Size - End-user Segment 2020 - 2024 ($ million)

5.4 Application segment analysis 2020 - 2024

Historic Market Size - Application Segment 2020 - 2024 ($ million)

5.5 Geography segment analysis 2020 - 2024

Historic Market Size - Geography Segment 2020 - 2024 ($ million)

5.6 Country segment analysis 2020 - 2024

Historic Market Size - Country Segment 2020 - 2024 ($ million)

6. Qualitative Analysis

6.1 Impact of AI in global MEP services market

7. Five Forces Analysis

7.1 Five forces summary

Five forces analysis - Comparison between 2025 and 2030

7.2 Bargaining power of buyers

Bargaining power of buyers - Impact of key factors 2025 and 2030

7.3 Bargaining power of suppliers

Bargaining power of suppliers - Impact of key factors in 2025 and 2030

7.4 Threat of new entrants

Threat of new entrants - Impact of key factors in 2025 and 2030

7.5 Threat of substitutes

Threat of substitutes - Impact of key factors in 2025 and 2030

7.6 Threat of rivalry

Threat of rivalry - Impact of key factors in 2025 and 2030

7.7 Market condition

Chart on Market condition - Five forces 2025 and 2030

8. Market Segmentation by Service

8.1 Market segments

Chart on Service - Market share 2025-2030 (%)
Data Table on Service - Market share 2025-2030 (%)

8.2 Comparison by Service

Chart on Comparison by Service
Data Table on Comparison by Service

8.3 C and E - Market size and forecast 2025-2030

Chart on C and E - Market size and forecast 2025-2030 ($ million)
Data Table on C and E - Market size and forecast 2025-2030 ($ million)
Chart on C and E - Year-over-year growth 2025-2030 (%)
Data Table on C and E - Year-over-year growth 2025-2030 (%)

8.4 Maintenance and support - Market size and forecast 2025-2030

Chart on Maintenance and support - Market size and forecast 2025-2030 ($ million)
Data Table on Maintenance and support - Market size and forecast 2025-2030 ($ million)
Chart on Maintenance and support - Year-over-year growth 2025-2030 (%)
Data Table on Maintenance and support - Year-over-year growth 2025-2030 (%)

8.5 System integration - Market size and forecast 2025-2030

Chart on System integration - Market size and forecast 2025-2030 ($ million)
Data Table on System integration - Market size and forecast 2025-2030 ($ million)
Chart on System integration - Year-over-year growth 2025-2030 (%)
Data Table on System integration - Year-over-year growth 2025-2030 (%)

8.6 Market opportunity by Service

Market opportunity by Service ($ million)
Data Table on Market opportunity by Service ($ million)

9. Market Segmentation by End-user

9.1 Market segments

Chart on End-user - Market share 2025-2030 (%)
Data Table on End-user - Market share 2025-2030 (%)

9.2 Comparison by End-user

Chart on Comparison by End-user
Data Table on Comparison by End-user

9.3 Commercial - Market size and forecast 2025-2030

Chart on Commercial - Market size and forecast 2025-2030 ($ million)
Data Table on Commercial - Market size and forecast 2025-2030 ($ million)
Chart on Commercial - Year-over-year growth 2025-2030 (%)
Data Table on Commercial - Year-over-year growth 2025-2030 (%)

9.4 Government - Market size and forecast 2025-2030

Chart on Government - Market size and forecast 2025-2030 ($ million)
Data Table on Government - Market size and forecast 2025-2030 ($ million)
Chart on Government - Year-over-year growth 2025-2030 (%)
Data Table on Government - Year-over-year growth 2025-2030 (%)

9.5 Residential - Market size and forecast 2025-2030

Chart on Residential - Market size and forecast 2025-2030 ($ million)
Data Table on Residential - Market size and forecast 2025-2030 ($ million)
Chart on Residential - Year-over-year growth 2025-2030 (%)
Data Table on Residential - Year-over-year growth 2025-2030 (%)

9.6 Market opportunity by End-user

Market opportunity by End-user ($ million)
Data Table on Market opportunity by End-user ($ million)

10. Market Segmentation by Application

10.1 Market segments

Chart on Application - Market share 2025-2030 (%)
Data Table on Application - Market share 2025-2030 (%)

10.2 Comparison by Application

Chart on Comparison by Application
Data Table on Comparison by Application

10.3 New construction - Market size and forecast 2025-2030

Chart on New construction - Market size and forecast 2025-2030 ($ million)
Data Table on New construction - Market size and forecast 2025-2030 ($ million)
Chart on New construction - Year-over-year growth 2025-2030 (%)
Data Table on New construction - Year-over-year growth 2025-2030 (%)

10.4 Renovation and retrofit - Market size and forecast 2025-2030

Chart on Renovation and retrofit - Market size and forecast 2025-2030 ($ million)
Data Table on Renovation and retrofit - Market size and forecast 2025-2030 ($ million)
Chart on Renovation and retrofit - Year-over-year growth 2025-2030 (%)
Data Table on Renovation and retrofit - Year-over-year growth 2025-2030 (%)

10.5 Maintenance and operations - Market size and forecast 2025-2030

Chart on Maintenance and operations - Market size and forecast 2025-2030 ($ million)
Data Table on Maintenance and operations - Market size and forecast 2025-2030 ($ million)
Chart on Maintenance and operations - Year-over-year growth 2025-2030 (%)
Data Table on Maintenance and operations - Year-over-year growth 2025-2030 (%)

10.6 Market opportunity by Application

Market opportunity by Application ($ million)
Data Table on Market opportunity by Application ($ million)

11. Customer Landscape

11.1 Customer landscape overview

Analysis of price sensitivity, lifecycle, customer purchase basket, adoption rates, and purchase criteria

12. Geographic Landscape

12.1 Geographic segmentation

Chart on Market share by geography 2025-2030 (%)
Data Table on Market share by geography 2025-2030 (%)

12.2 Geographic comparison

Chart on Geographic comparison
Data Table on Geographic comparison

12.3 North America - Market size and forecast 2025-2030

Chart on North America - Market size and forecast 2025-2030 ($ million)
Data Table on North America - Market size and forecast 2025-2030 ($ million)
Chart on North America - Year-over-year growth 2025-2030 (%)
Data Table on North America - Year-over-year growth 2025-2030 (%)
Chart on Regional Comparison - North America
Data Table on Regional Comparison - North America

12.3.1 US - Market size and forecast 2025-2030

Chart on US - Market size and forecast 2025-2030 ($ million)
Data Table on US - Market size and forecast 2025-2030 ($ million)
Chart on US - Year-over-year growth 2025-2030 (%)
Data Table on US - Year-over-year growth 2025-2030 (%)

12.3.2 Canada - Market size and forecast 2025-2030

Chart on Canada - Market size and forecast 2025-2030 ($ million)
Data Table on Canada - Market size and forecast 2025-2030 ($ million)
Chart on Canada - Year-over-year growth 2025-2030 (%)
Data Table on Canada - Year-over-year growth 2025-2030 (%)

12.3.3 Mexico - Market size and forecast 2025-2030

Chart on Mexico - Market size and forecast 2025-2030 ($ million)
Data Table on Mexico - Market size and forecast 2025-2030 ($ million)
Chart on Mexico - Year-over-year growth 2025-2030 (%)
Data Table on Mexico - Year-over-year growth 2025-2030 (%)

12.4 APAC - Market size and forecast 2025-2030

Chart on APAC - Market size and forecast 2025-2030 ($ million)
Data Table on APAC - Market size and forecast 2025-2030 ($ million)
Chart on APAC - Year-over-year growth 2025-2030 (%)
Data Table on APAC - Year-over-year growth 2025-2030 (%)
Chart on Regional Comparison - APAC
Data Table on Regional Comparison - APAC

12.4.1 China - Market size and forecast 2025-2030

Chart on China - Market size and forecast 2025-2030 ($ million)
Data Table on China - Market size and forecast 2025-2030 ($ million)
Chart on China - Year-over-year growth 2025-2030 (%)
Data Table on China - Year-over-year growth 2025-2030 (%)

12.4.2 India - Market size and forecast 2025-2030

Chart on India - Market size and forecast 2025-2030 ($ million)
Data Table on India - Market size and forecast 2025-2030 ($ million)
Chart on India - Year-over-year growth 2025-2030 (%)
Data Table on India - Year-over-year growth 2025-2030 (%)

12.4.3 Japan - Market size and forecast 2025-2030

Chart on Japan - Market size and forecast 2025-2030 ($ million)
Data Table on Japan - Market size and forecast 2025-2030 ($ million)
Chart on Japan - Year-over-year growth 2025-2030 (%)
Data Table on Japan - Year-over-year growth 2025-2030 (%)

12.4.4 South Korea - Market size and forecast 2025-2030

Chart on South Korea - Market size and forecast 2025-2030 ($ million)
Data Table on South Korea - Market size and forecast 2025-2030 ($ million)
Chart on South Korea - Year-over-year growth 2025-2030 (%)
Data Table on South Korea - Year-over-year growth 2025-2030 (%)

12.4.5 Indonesia - Market size and forecast 2025-2030

Chart on Indonesia - Market size and forecast 2025-2030 ($ million)
Data Table on Indonesia - Market size and forecast 2025-2030 ($ million)
Chart on Indonesia - Year-over-year growth 2025-2030 (%)
Data Table on Indonesia - Year-over-year growth 2025-2030 (%)

12.4.6 Australia - Market size and forecast 2025-2030

Chart on Australia - Market size and forecast 2025-2030 ($ million)
Data Table on Australia - Market size and forecast 2025-2030 ($ million)
Chart on Australia - Year-over-year growth 2025-2030 (%)
Data Table on Australia - Year-over-year growth 2025-2030 (%)

12.5 Europe - Market size and forecast 2025-2030

Chart on Europe - Market size and forecast 2025-2030 ($ million)
Data Table on Europe - Market size and forecast 2025-2030 ($ million)
Chart on Europe - Year-over-year growth 2025-2030 (%)
Data Table on Europe - Year-over-year growth 2025-2030 (%)
Chart on Regional Comparison - Europe
Data Table on Regional Comparison - Europe

12.5.1 Germany - Market size and forecast 2025-2030

Chart on Germany - Market size and forecast 2025-2030 ($ million)
Data Table on Germany - Market size and forecast 2025-2030 ($ million)
Chart on Germany - Year-over-year growth 2025-2030 (%)
Data Table on Germany - Year-over-year growth 2025-2030 (%)

12.5.2 UK - Market size and forecast 2025-2030

Chart on UK - Market size and forecast 2025-2030 ($ million)
Data Table on UK - Market size and forecast 2025-2030 ($ million)
Chart on UK - Year-over-year growth 2025-2030 (%)
Data Table on UK - Year-over-year growth 2025-2030 (%)

12.5.3 France - Market size and forecast 2025-2030

Chart on France - Market size and forecast 2025-2030 ($ million)
Data Table on France - Market size and forecast 2025-2030 ($ million)
Chart on France - Year-over-year growth 2025-2030 (%)
Data Table on France - Year-over-year growth 2025-2030 (%)

12.5.4 Italy - Market size and forecast 2025-2030

Chart on Italy - Market size and forecast 2025-2030 ($ million)
Data Table on Italy - Market size and forecast 2025-2030 ($ million)
Chart on Italy - Year-over-year growth 2025-2030 (%)
Data Table on Italy - Year-over-year growth 2025-2030 (%)

12.5.5 Spain - Market size and forecast 2025-2030

Chart on Spain - Market size and forecast 2025-2030 ($ million)
Data Table on Spain - Market size and forecast 2025-2030 ($ million)
Chart on Spain - Year-over-year growth 2025-2030 (%)
Data Table on Spain - Year-over-year growth 2025-2030 (%)

12.5.6 The Netherlands - Market size and forecast 2025-2030

Chart on The Netherlands - Market size and forecast 2025-2030 ($ million)
Data Table on The Netherlands - Market size and forecast 2025-2030 ($ million)
Chart on The Netherlands - Year-over-year growth 2025-2030 (%)
Data Table on The Netherlands - Year-over-year growth 2025-2030 (%)

12.6 South America - Market size and forecast 2025-2030

Chart on South America - Market size and forecast 2025-2030 ($ million)
Data Table on South America - Market size and forecast 2025-2030 ($ million)
Chart on South America - Year-over-year growth 2025-2030 (%)
Data Table on South America - Year-over-year growth 2025-2030 (%)
Chart on Regional Comparison - South America
Data Table on Regional Comparison - South America

12.6.1 Brazil - Market size and forecast 2025-2030

Chart on Brazil - Market size and forecast 2025-2030 ($ million)
Data Table on Brazil - Market size and forecast 2025-2030 ($ million)
Chart on Brazil - Year-over-year growth 2025-2030 (%)
Data Table on Brazil - Year-over-year growth 2025-2030 (%)

12.6.2 Argentina - Market size and forecast 2025-2030

Chart on Argentina - Market size and forecast 2025-2030 ($ million)
Data Table on Argentina - Market size and forecast 2025-2030 ($ million)
Chart on Argentina - Year-over-year growth 2025-2030 (%)
Data Table on Argentina - Year-over-year growth 2025-2030 (%)

12.6.3 Chile - Market size and forecast 2025-2030

Chart on Chile - Market size and forecast 2025-2030 ($ million)
Data Table on Chile - Market size and forecast 2025-2030 ($ million)
Chart on Chile - Year-over-year growth 2025-2030 (%)
Data Table on Chile - Year-over-year growth 2025-2030 (%)

12.7 Middle East and Africa - Market size and forecast 2025-2030

Chart on Middle East and Africa - Market size and forecast 2025-2030 ($ million)
Data Table on Middle East and Africa - Market size and forecast 2025-2030 ($ million)
Chart on Middle East and Africa - Year-over-year growth 2025-2030 (%)
Data Table on Middle East and Africa - Year-over-year growth 2025-2030 (%)
Chart on Regional Comparison - Middle East and Africa
Data Table on Regional Comparison - Middle East and Africa

12.7.1 Saudi Arabia - Market size and forecast 2025-2030

Chart on Saudi Arabia - Market size and forecast 2025-2030 ($ million)
Data Table on Saudi Arabia - Market size and forecast 2025-2030 ($ million)
Chart on Saudi Arabia - Year-over-year growth 2025-2030 (%)
Data Table on Saudi Arabia - Year-over-year growth 2025-2030 (%)

12.7.2 UAE - Market size and forecast 2025-2030

Chart on UAE - Market size and forecast 2025-2030 ($ million)
Data Table on UAE - Market size and forecast 2025-2030 ($ million)
Chart on UAE - Year-over-year growth 2025-2030 (%)
Data Table on UAE - Year-over-year growth 2025-2030 (%)

12.7.3 South Africa - Market size and forecast 2025-2030

Chart on South Africa - Market size and forecast 2025-2030 ($ million)
Data Table on South Africa - Market size and forecast 2025-2030 ($ million)
Chart on South Africa - Year-over-year growth 2025-2030 (%)
Data Table on South Africa - Year-over-year growth 2025-2030 (%)

12.7.4 Turkey - Market size and forecast 2025-2030

Chart on Turkey - Market size and forecast 2025-2030 ($ million)
Data Table on Turkey - Market size and forecast 2025-2030 ($ million)
Chart on Turkey - Year-over-year growth 2025-2030 (%)
Data Table on Turkey - Year-over-year growth 2025-2030 (%)

12.7.5 Israel - Market size and forecast 2025-2030

Chart on Israel - Market size and forecast 2025-2030 ($ million)
Data Table on Israel - Market size and forecast 2025-2030 ($ million)
Chart on Israel - Year-over-year growth 2025-2030 (%)
Data Table on Israel - Year-over-year growth 2025-2030 (%)

12.8 Market opportunity by geography

Market opportunity by geography ($ million)
Data Tables on Market opportunity by geography ($ million)

13. Drivers, Challenges, and Opportunity

13.1 Market drivers

Data center construction explosion
Green building regulatory mandates
Urbanization and infrastructure renewal

13.2 Market challenges

Critical shortage of skilled labor
Volatile material costs and lead times
Complex web building code compliance

13.3 Impact of drivers and challenges

Impact of drivers and challenges in 2025 and 2030

13.4 Market opportunities

Prefabrication and modular MEP assembly
Digital twin integration for lifecycle
Electrification of heating and cooling

14. Competitive Landscape

14.1 Overview

14.2

Overview on criticality of inputs and factors of differentiation

14.3 Landscape disruption

Overview on factors of disruption

14.4 Industry risks

Impact of key risks on business

15. Competitive Analysis

15.1 Companies profiled

Companies covered

15.2 Company ranking index

15.3 Market positioning of companies

Matrix on companies position and classification

15.4 AECOM

AECOM - Overview
AECOM - Business segments
AECOM - Key news
AECOM - Key offerings
AECOM - Segment focus
SWOT

15.5 Burns and McDonnell

Burns and McDonnell - Overview
Burns and McDonnell - Product / Service
Burns and McDonnell - Key offerings
SWOT

15.6 Continuum Services

Continuum Services - Overview
Continuum Services - Product / Service
Continuum Services - Key offerings
SWOT

15.7 Crockett Facilities Services

Crockett Facilities Services - Overview
Crockett Facilities Services - Product / Service
Crockett Facilities Services - Key offerings
SWOT

15.8 Dohn Engineering PLC

Dohn Engineering PLC - Overview
Dohn Engineering PLC - Product / Service
Dohn Engineering PLC - Key offerings
SWOT

15.9 EMCOR Group Inc.

EMCOR Group Inc. - Overview
EMCOR Group Inc. - Business segments
EMCOR Group Inc. - Key offerings
EMCOR Group Inc. - Segment focus
SWOT

15.10 Exyte GmbH

Exyte GmbH - Overview
Exyte GmbH - Product / Service
Exyte GmbH - Key offerings
SWOT

15.11 Global Facility Solutions LLC

Global Facility Solutions LLC - Overview
Global Facility Solutions LLC - Product / Service
Global Facility Solutions LLC - Key offerings
SWOT

15.12 Jacobs Solutions Inc.

Jacobs Solutions Inc. - Overview
Jacobs Solutions Inc. - Business segments
Jacobs Solutions Inc. - Key offerings
Jacobs Solutions Inc. - Segment focus
SWOT

15.13 Knight Facilities Management

Knight Facilities Management - Overview
Knight Facilities Management - Product / Service
Knight Facilities Management - Key offerings
SWOT

15.14 MEP Engineering Inc.

MEP Engineering Inc. - Overview
MEP Engineering Inc. - Product / Service
MEP Engineering Inc. - Key offerings
SWOT

15.15 NV5 Global Inc.

NV5 Global Inc. - Overview
NV5 Global Inc. - Business segments
NV5 Global Inc. - Key offerings
NV5 Global Inc. - Segment focus
SWOT

15.16 Resolute Engineering

Resolute Engineering - Overview
Resolute Engineering - Product / Service
Resolute Engineering - Key offerings
SWOT

15.17 Sterling and Wilson Energy

Sterling and Wilson Energy - Overview
Sterling and Wilson Energy - Business segments
Sterling and Wilson Energy - Key offerings
Sterling and Wilson Energy - Segment focus
SWOT

15.18 WSP Global Inc.

WSP Global Inc. - Overview
WSP Global Inc. - Business segments
WSP Global Inc. - Key offerings
WSP Global Inc. - Segment focus
SWOT

16. Appendix

16.1 Scope of the report

Market definition
Objectives
Notes and caveats

16.2 Inclusions and exclusions checklist

Inclusions checklist
Exclusions checklist

16.3 Currency conversion rates for US$

16.4 Research methodology

16.5 Data procurement

Information sources

16.6 Data validation

16.7 Validation techniques employed for market sizing

16.8 Data synthesis

16.9 360 degree market analysis

16.10 List of abbreviations

Research Methodology

Technavio presents a detailed picture of the market by way of study, synthesis, and summation of data from multiple sources. The analysts have presented the various facets of the market with a particular focus on identifying the key industry influencers. The data thus presented is comprehensive, reliable, and the result of extensive research, both primary and secondary.

INFORMATION SOURCES

Primary sources

  • Manufacturers and suppliers
  • Channel partners
  • Industry experts
  • Strategic decision makers

Secondary sources

  • Industry journals and periodicals
  • Government data
  • Financial reports of key industry players
  • Historical data
  • Press releases

DATA ANALYSIS

Data Synthesis

  • Collation of data
  • Estimation of key figures
  • Analysis of derived insights

Data Validation

  • Triangulation with data models
  • Reference against proprietary databases
  • Corroboration with industry experts

REPORT WRITING

Qualitative

  • Market drivers
  • Market challenges
  • Market trends
  • Five forces analysis

Quantitative

  • Market size and forecast
  • Market segmentation
  • Geographical insights
  • Competitive landscape

Interested in this report?

Get your sample now to see our research methodology and insights!

Download Now

Frequently Asked Questions

MEP Services market growth will increase by USD 124477.2 million during 2026-2030.

The MEP Services market is expected to grow at a CAGR of 12.7% during 2026-2030.

MEP Services market is segmented by Service (C and E, Maintenance and support, System integration) End-user (Commercial, Government, Residential) Application (New construction, Renovation and retrofit, Maintenance and operations)

AECOM, Burns and McDonnell, Continuum Services, Crockett Facilities Services, Dohn Engineering PLC, EMCOR Group Inc., Exyte GmbH, Global Facility Solutions LLC, IMEG Corp., Jacobs Solutions Inc., Jensen Hughes, Knight Facilities Management, MEP Engineering Inc., Mott MacDonald, NV5 Global Inc., Resolute Engineering, Sterling and Wilson Energy, WSP Global Inc. are a few of the key vendors in the MEP Services market.

North America will register the highest growth rate of 45.9% among the other regions. Therefore, the MEP Services market in North America is expected to garner significant business opportunities for the vendors during the forecast period.

US, Canada, Mexico, China, India, Japan, South Korea, Indonesia, Australia, Germany, UK, France, Italy, Spain, The Netherlands, Brazil, Argentina, Chile, Saudi Arabia, UAE, South Africa, Turkey, Israel

  • Data center construction explosion is the driving factor this market.

The MEP Services market vendors should focus on grabbing business opportunities from the Service segment as it accounted for the largest market share in the base year.
RIA - Research AI Assistant
Ask RIA