
What is the Message Queuing Services Market Size?
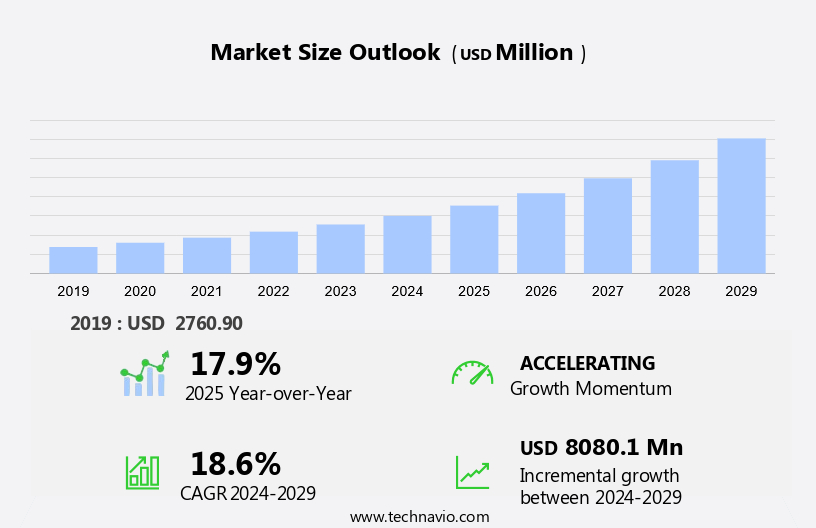
The message queuing services market size is forecast to increase by USD 8.08 billion, at a CAGR of 18.6% between 2024 and 2029. The market is witnessing significant growth due to several key factors. Firstly, the increasing focus on web security updates is driving the adoption of message queuing services to ensure secure and reliable data transfer. Secondly, the trend towards cloud-based solutions is gaining momentum, as organizations seek to reduce IT infrastructure costs and improve scalability. Lastly, the integration of message queuing services with legacy systems is enabling seamless communication between old and new technologies, thereby enhancing overall business efficiency. These trends are expected to continue shaping the market dynamics in the coming years. Overall, the market for message queuing services is poised for strong growth, providing ample opportunities for companies and stakeholders alike.
What will be the size of the Market during the forecast period?
Request Free Message Queuing Services Market Sample
Market Segmentation
The market research report provides comprehensive data (region-wise segment analysis), with forecasts and estimates in "USD billion" for the period 2025-2029, as well as historical data from 2019 - 2023 for the following segments.
- Type
- Point-to-point messaging
- Publish and subscribe messaging
- Others
- End-user
- Enterprises
- SMEs
- Geography
- North America
- US
- Europe
- Germany
- UK
- France
- Spain
- APAC
- China
- India
- Japan
- South America
- Brazil
- Middle East and Africa
- North America
Which is the largest segment driving market growth?
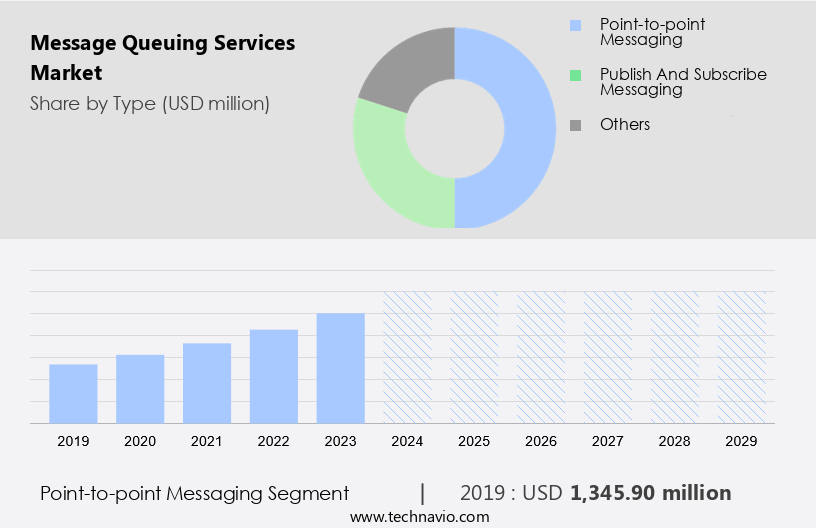
The point-to-point messaging segment is estimated to witness significant growth during the forecast period. Message queuing services enable point-to-point communication between applications by acting as event brokers. In this setup, producers and consumers exchange messages through designated destinations, ensuring reliable and direct communication.
Get a glance at the market share of various regions. Download the PDF Sample
The point-to-point messaging segment was valued at USD 1.35 billion in 2019. Component manufacturers also leverage message queuing services for seamless integration of their products into complex systems.
Which region is leading the market?
For more insights on the market share of various regions, Request Free Sample
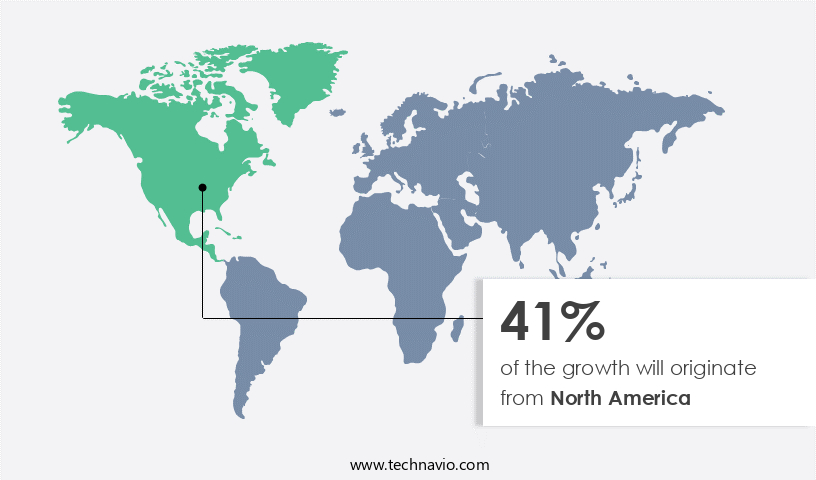
North Ameirca is estimated to contribute 41% to the growth of the global market during the forecast period. Technavio's analysts have elaborately explained the regional trends and drivers that shape the market during the forecast period. The market in North America is experiencing growth due to technological advancements and regulatory initiatives.
How do company ranking index and market positioning come to your aid?
Companies are implementing various strategies, such as strategic alliances, partnerships, mergers and acquisitions, geographical expansion, and product/service launches, to enhance their presence in the market.
ABLY Inc. - The company offers ably queues, a message queuing service that provides a dependable and simple technique for ingesting, processing, storing, enhancing, or rerouting data from their real-time platform.
Technavio provides the ranking index for the top 20 companies along with insights on the market positioning of:
- Alibaba Cloud
- Alphabet Inc.
- Amazon Web Services Inc.
- Boomi LP
- Cloudera Inc.
- CONFLUENT Inc
- EMQ Technologies Inc.
- Huawei Technologies Co. Ltd.
- Informatica Inc.
- International Business Machines Corp.
- Microsoft Corp
- MuleSoft
- Oracle Corp
- RabbitMQ
- Red Hat Inc.
- SAP SE
- Software AG
- Solace
- TIBCO Software Inc.
Explore our company rankings and market positioning. Request Free Sample
How can Technavio assist you in making critical decisions?
What is the market structure and year-over-year growth of the Market?
|
Market structure |
Fragmented |
|
YoY growth 2024-2025 |
17.9 |
Market Dynamics
Message queuing services have become an essential component of modern business operations, enabling service quality improvement and data-driven decision making. These services facilitate the management of customer requests, ensuring customer service excellence by optimizing customer flow and enhancing the overall customer experience. Predictive analytics plays a crucial role in this process, providing valuable customer experience insights that help businesses identify trends and patterns, leading to improved customer satisfaction. Queue optimization is a key benefit of message queuing services, allowing businesses to manage customer interactions more efficiently and effectively. Healthcare queue management is a prime example of this, ensuring that patients are attended to in a timely and organized manner. Real-time data visualization and digital signage are additional features that enhance the customer experience, providing transparency and improving communication. The integration of automated customer service and cloud-based queue management into message queuing services has led to significant digital transformation in various industries.
Visitor security is another important application, ensuring that queues are managed efficiently while maintaining a high level of security. The market is driven by several factors, including reliability, industry 4.0, business process automation, and cost optimization. Quantitative data is used extensively to measure service performance and identify areas for improvement. A message broker acts as the intermediary between different applications, ensuring seamless communication and integration through event-driven architecture. Microservices architecture and cloud messaging have further enhanced the capabilities of message queuing services, enabling real-time messaging and software development. The use of integration platforms and real-time messaging ensures that various systems and applications can communicate effectively, leading to a more efficient and streamlined business process. Our researchers analyzed the data with 2024 as the base year, along with the key drivers, trends, and challenges. A holistic analysis of drivers will help companies refine their marketing strategies to gain a competitive advantage.
What are the primary factors driving the market growth?
Web security update initiatives are notably driving market growth. The market is experiencing significant growth due to the increasing demand for continuous improvement and innovation in various sectors. In healthcare, for instance, the implementation of a Queue Management System (QMS) based on MQS is enhancing patient experience by reducing wait times and improving customer responses. Similarly, in hospitality, AI and machine learning are being integrated with MQS to analyze customer flow and engagement, leading to increased productivity and employee satisfaction. In the public transportation sector, MQS is being used to optimize network performance by analyzing sensor data from connected devices in real-time. This data is then used to provide on-screen information to passengers, ensuring positive customer responses and improved traffic management.
Public transportation providers are also leveraging MQS to automate their systems, leading to more efficient and accurate lead services. Cloud computing is another area where MQS is gaining traction, as infrastructure providers and service providers seek to offer more advanced services. Component manufacturers are also integrating MQS into their offerings to ensure real-time monitoring and error handling, reducing inaccuracies and improving overall system performance. Security remains a critical concern in the MQS market, with funding for QMS and web security updates increasing to address potential vulnerabilities. Thus, such factors are driving the growth of the market during the forecast period.
What are the significant trends being witnessed in the market?
Focus on cloud-based solutions is an emerging trend shaping the market growth. The market is experiencing notable growth due to the increasing adoption of cloud computing and the integration of advanced technologies such as AI, machine learning, and blockchain. This trend is driven by the need for continuous improvement, real-time monitoring, and analytics-driven insights to enhance customer experience and employee satisfaction across various industries. In healthcare, for instance, queue management systems (QMS) are being used to optimize patient flow and reduce wait times, leading to positive customer responses. Similarly, in hospitality, AI-powered modules are being integrated into MQS to improve customer engagement and personalize services. Public transportation networks are also leveraging MQS to manage customer traffic and improve the overall efficiency of their operations. Real-time monitoring of customer queues and sensor data from connected devices is enabling service providers to provide accurate and timely information to passengers, leading to increased productivity and improved guest security.
Component manufacturers and infrastructure providers are also investing in MQS to streamline their operations and improve communication between different systems. The use of cloud computing and ML algorithms is enabling real-time data analytics, allowing businesses to make informed decisions and respond to customer needs in a timely and effective manner. Overall, the market is witnessing significant innovation, with new solutions and advancements being introduced regularly to meet the evolving needs of businesses and consumers. From AI-powered automation to blockchain-enabled security, the future of MQS is promising, with the potential to transform the way businesses communicate and interact with their customers and employees. Thus, such market trends will shape the growth of the market during the forecast period.
What are the major market challenges?
Integration with legacy systems is a significant challenge hindering the market growth. is witnessing significant growth due to the increasing demand for continuous improvement and innovation in various industries. QMS (Queue Management Systems) are becoming essential for managing customer responses, employee satisfaction, and customer traffic in sectors like healthcare, hospitality, and public transportation. Message queuing services enable real-time monitoring and automation of customer queues using AI, machine learning, and analytics-driven insights. However, integrating these modern technologies with legacy systems, such as mainframe systems. These older systems, with their rigid architectures and outdated data formats, can hinder seamless communication with contemporary message brokers. The data transformation and migration process can be resource-intensive and time-consuming, making it a substantial hurdle for organizations aiming to modernize their IT infrastructure.
Moreover, the adoption of message queuing services is being driven by the increasing use of connected devices, cloud computing, and infrastructure providers and service providers offering automated systems and real-time monitoring. The integration of sensor data and AI in public transportation networks is improving guest security and on-screen information, leading to positive customer responses and increased productivity. Component manufacturers and infrastructure providers are also investing in message queuing services to enhance customer flow and data analytics, while ML and AI modules are being integrated to improve customer engagement and automate lead services. Hence, the above factors will impede the growth of the market during the forecast period.
Exclusive Customer Landscape
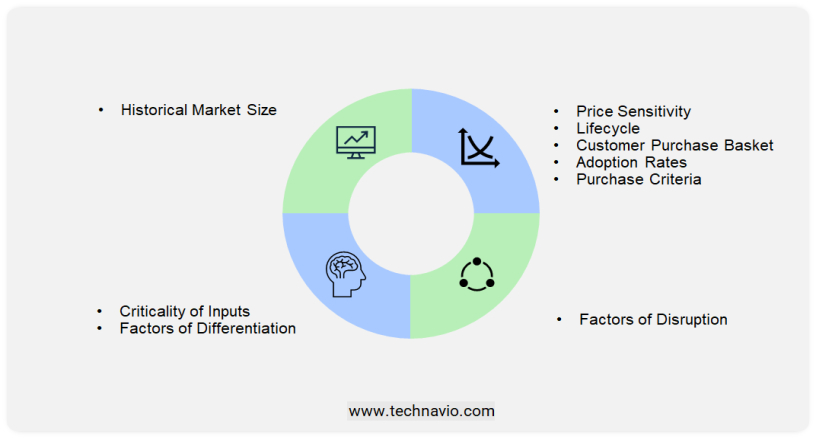
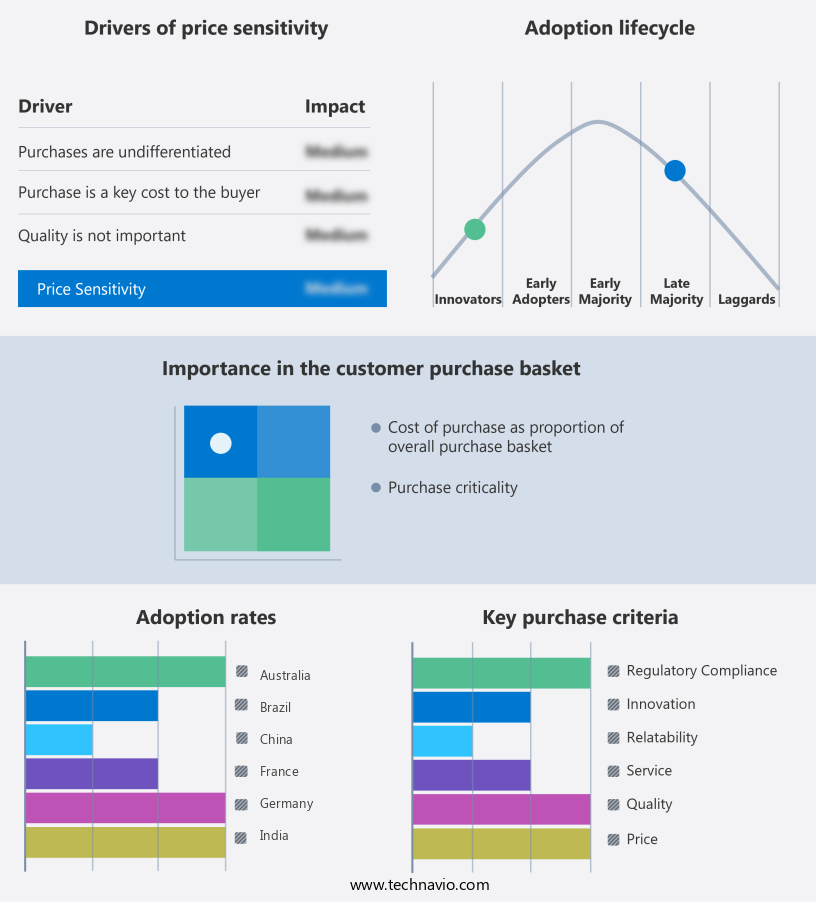
The market forecasting report includes the adoption lifecycle of the market research and growth, covering from the innovator's stage to the laggard's stage. It focuses on adoption rates in different regions based on penetration. Furthermore, the report also includes key purchase criteria and drivers of price sensitivity to help companies evaluate and develop their market growth analysis strategies.
Customer Landscape
Market Analyst Overview
Message queuing services have emerged as a crucial component of modern business infrastructure, enabling seamless communication between different applications and systems. These services facilitate the exchange of messages between various components, ensuring efficient and reliable data transfer. One of the primary drivers of the market is the growing need for continuous improvement and innovation. Businesses are increasingly relying on real-time data analytics and insights to optimize their operations and enhance customer experiences. Message queuing services play a vital role in this process by enabling the collection, processing, and distribution of data in a timely and efficient manner. Another significant trend in the market is the adoption of artificial intelligence (AI) and machine learning (ML) technologies. These advanced technologies enable automated system responses, real-time monitoring, and predictive analytics, leading to improved productivity and customer satisfaction. For instance, in the healthcare sector, queue management systems (QMS) have been implemented to optimize patient flow and reduce waiting times, leading to positive customer responses.
In addition, the increasing use of connected devices and cloud computing is also driving the growth of the market. Infrastructure providers and service providers are leveraging these technologies to offer scalable and flexible solutions that cater to the diverse needs of businesses. Component manufacturers are also investing in the development of new modules and features to enhance the functionality and capabilities of message queuing services. However, the market for message queuing services is not without its challenges. One of the major challenges is ensuring the accuracy and reliability of data transfer. Inaccuracies in message delivery can lead to significant issues, such as delayed responses, miscommunication, and even security breaches. To address this challenge, message queuing services are being integrated with advanced analytics tools and AI algorithms to detect and correct errors in real-time. Another challenge facing the market is the need to cater to the diverse needs of various industries. For example, in the hospitality industry, message queuing services are used to manage customer engagement and improve employee satisfaction. In public transportation networks, these services are used to optimize customer traffic and ensure guest security. In each case, the specific requirements and use cases vary, necessitating customized solutions that can adapt to the unique needs of each industry.
|
Market Scope |
|
|
Report Coverage |
Details |
|
Page number |
205 |
|
Base year |
2024 |
|
Historic period |
2019 - 2023 |
|
Forecast period |
2025-2029 |
|
Growth momentum & CAGR |
Accelerate at a CAGR of 18.6% |
|
Market Growth 2025-2029 |
USD 8.08 billion |
|
Regional analysis |
North America, Europe, APAC, South America, and Middle East and Africa |
|
Performing market contribution |
North America at 41% |
|
Key countries |
US, China, Germany, UK, France, Spain, Japan, Australia, India, and Brazil |
|
Competitive landscape |
Leading Companies, Market Positioning of Companies, Competitive Strategies, and Industry Risks |
|
Key companies profiled |
ABLY Inc., Alibaba Cloud, Alphabet Inc., Amazon Web Services Inc., Boomi LP, Cloudera Inc., CONFLUENT Inc, EMQ Technologies Inc., Huawei Technologies Co. Ltd., Informatica Inc., International Business Machines Corp., Microsoft Corp, MuleSoft, Oracle Corp, RabbitMQ, Red Hat Inc., SAP SE, Software AG, Solace, and TIBCO Software Inc. |
|
Market Segmentation |
Type (Point-to-point messaging, Publish and subscribe messaging, and Others), End-user (Enterprises and SMEs), and Geography (North America, Europe, APAC, South America, and Middle East and Africa) |
|
Customization purview |
If our market report has not included the data that you are looking for, you can reach out to our analysts and get segments customized. |
What are the Key Data Covered in this Market Research Report?
- CAGR of the market during the market forecast period
- Detailed information on factors that will drive the market growth and forecasting between 2025 and 2029
- Precise estimation of the size of the market and its contribution of the market in focus to the parent market
- Accurate predictions about upcoming market growth and trends and changes in consumer behavior
- Growth of the market across North America, Europe, APAC, South America, and Middle East and Africa
- Thorough analysis of the market's competitive landscape and detailed information about companies
- Comprehensive analysis of factors that will challenge the growth of market companies
 RIA -
RIA - 
