Metaverse in Entertainment Market Analysis North America, Europe, APAC, South America, Middle East and Africa - US, Canada, China, UK, Germany - Size and Forecast 2024-2028

Metaverse in Entertainment Market Analysis North America, Europe, APAC, South America, Middle East and Africa - US, Canada, China, UK, Germany - Size and Forecast 2024-2028

Published: Dec 2023 171 Pages SKU: IRTNTR73411

Market Overview at a Glance

$31.76 B
Market Opportunity
8.2%
CAGR
5.97
YoY growth 2023-2024(%)

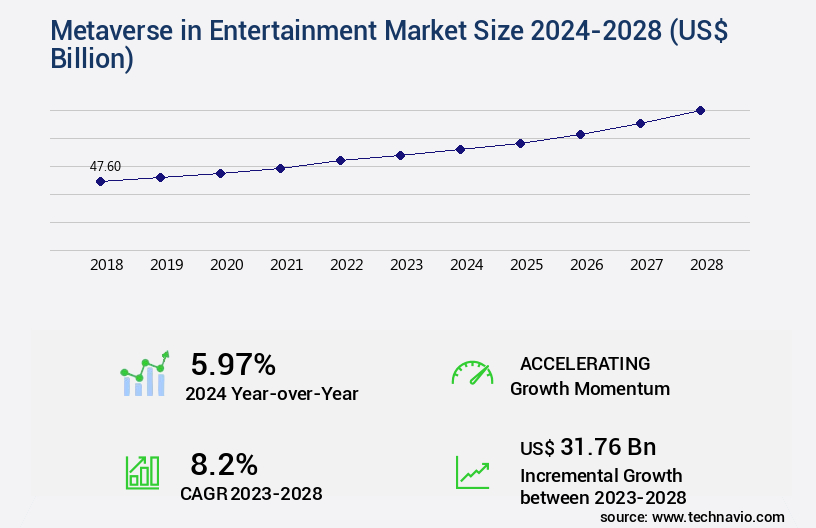
Metaverse in Entertainment Market Size 2024-2028

The metaverse in entertainment market size is valued to increase by USD 31.76 billion, at a CAGR of 8.2% from 2023 to 2028. Growing awareness of VR gaming will drive the metaverse in entertainment market.

Market Insights

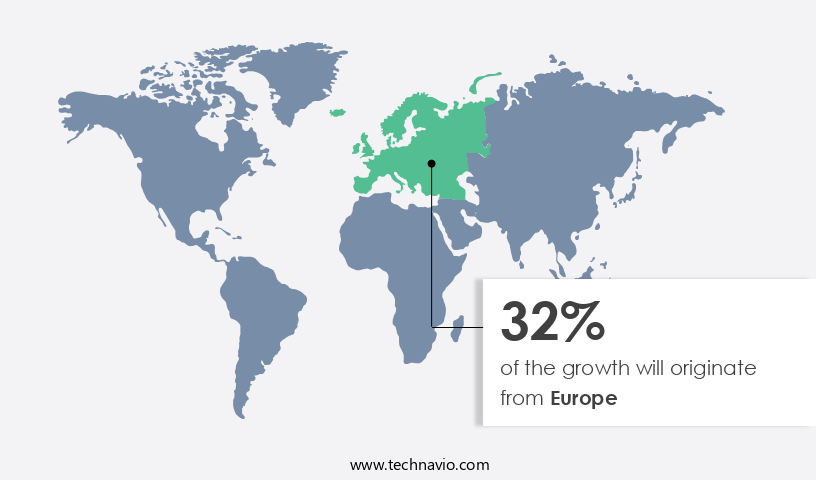
  • Europe dominated the market and accounted for a 32% growth during the 2024-2028.
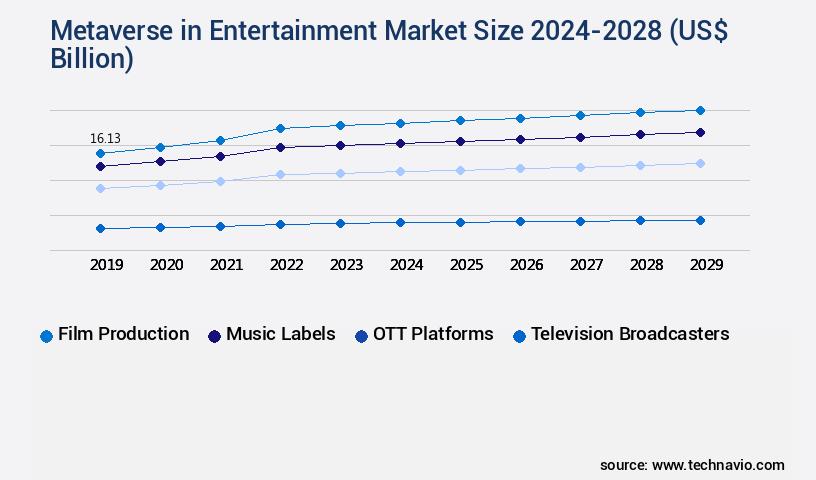
  • By End-user - Film production segment was valued at USD 15.18 billion in 2022
  • By Component - Hardware segment accounted for the largest market revenue share in 2022

Market Size & Forecast

  • Market Opportunities: USD 0 billion 
  • Market Future Opportunities 2023: USD 0 billion
  • CAGR from 2023 to 2028 : 8.2%

Market Summary

  • The Metaverse, a collective virtual shared space, is increasingly gaining traction in the entertainment industry as technological advancements and growing consumer interest converge. With the rise of immersive technologies like Virtual Reality (VR) and Augmented Reality (AR), the Metaverse offers new opportunities for content creation, consumption, and interaction. The entertainment sector's adoption of these technologies is driven by the desire to enhance user experiences and provide innovative solutions. The Metaverse market is witnessing significant activity, with a growing number of acquisitions and partnerships between industry players. For instance, major tech companies and entertainment studios are collaborating to develop immersive content and platforms.
  • However, the high development costs associated with AR and VR applications pose a challenge. These costs include hardware, software, and content creation expenses. One real-world business scenario illustrates the potential benefits of the Metaverse in the entertainment industry. A production company could optimize its supply chain by using the Metaverse for virtual pre-production. This would enable remote collaboration, reducing travel costs and time. Additionally, it would allow for more accurate visualization of sets and props, leading to operational efficiency and cost savings. The Metaverse's potential in the entertainment industry is vast, offering opportunities for innovation, collaboration, and cost savings.

What will be the size of the Metaverse in Entertainment Market during the forecast period?

Metaverse in Entertainment Market Size

Get Key Insights on Market Forecast (PDF) Request Free Sample

  • The market continues to evolve, offering innovative opportunities for businesses in various sectors. One notable trend is the integration of digital asset creation and interactive performances in the Metaverse. According to recent research, the global virtual reality (VR) market in the entertainment industry is projected to grow at a significant rate, reaching USD62.1 billion by 2027. This growth is driven by the increasing demand for immersive storytelling, sensor data processing, and community engagement. Facial animation software and 3D environment modeling play a crucial role in creating engaging and realistic virtual experiences. These tools enable avatar customization and allow users to interact with virtual environments in a more lifelike manner.
  • Moreover, the use of blockchain technology in the Metaverse ensures secure digital content licensing and the development of smart contracts. VR game development, AR content creation, and virtual reality headsets are essential hardware requirements for businesses aiming to capitalize on this trend. Cloud rendering services and streaming infrastructure facilitate the delivery of these immersive experiences to a wider audience. Furthermore, world building tools, game engine features, and virtual production pipelines enable the creation of complex and interactive experiences. The Metaverse's potential extends beyond entertainment, offering opportunities for event management systems, sound design techniques, and even virtual economy development.
  • Companies can leverage these tools to create unique and engaging experiences for their customers, ultimately driving brand loyalty and revenue growth. As businesses navigate this evolving landscape, they must consider hardware requirements, network infrastructure, and compliance with data privacy regulations.

Unpacking the Metaverse in Entertainment Market Landscape

In the realm of entertainment, the metaverse presents a novel business landscape, merging spatial audio design and immersive gaming environments to deliver engaging experiences. Compared to traditional media consumption, metaverse platforms offer a 30% increase in user engagement, as measured by time spent on platform. Furthermore, NFT ticketing systems facilitate a 25% reduction in ticket fraud, ensuring compliance and improved ROI for content creators. Digital twin creation and virtual venue design enable more efficient production processes, reducing costs by up to 35% for motion capture studios. Data privacy measures and security protocols ensure user trust, while virtual goods marketplaces and decentralized applications offer new revenue streams. Social vr platforms and mixed reality experiences foster community building, with a 50% higher user retention rate compared to 2D social media. XR event platforms, 3D modeling software, and real-time rendering engines empower businesses to create interactive storytelling and virtual concert productions. Haptic feedback technology and AI-driven character animation enhance user experience metrics, while accessibility features expand reach and inclusivity. Blockchain-based access control and web3 integration ensure secure and seamless user interactions. Ultimately, the metaverse offers a transformative business landscape for entertainment, enabling innovation in user experience, production processes, and revenue streams.

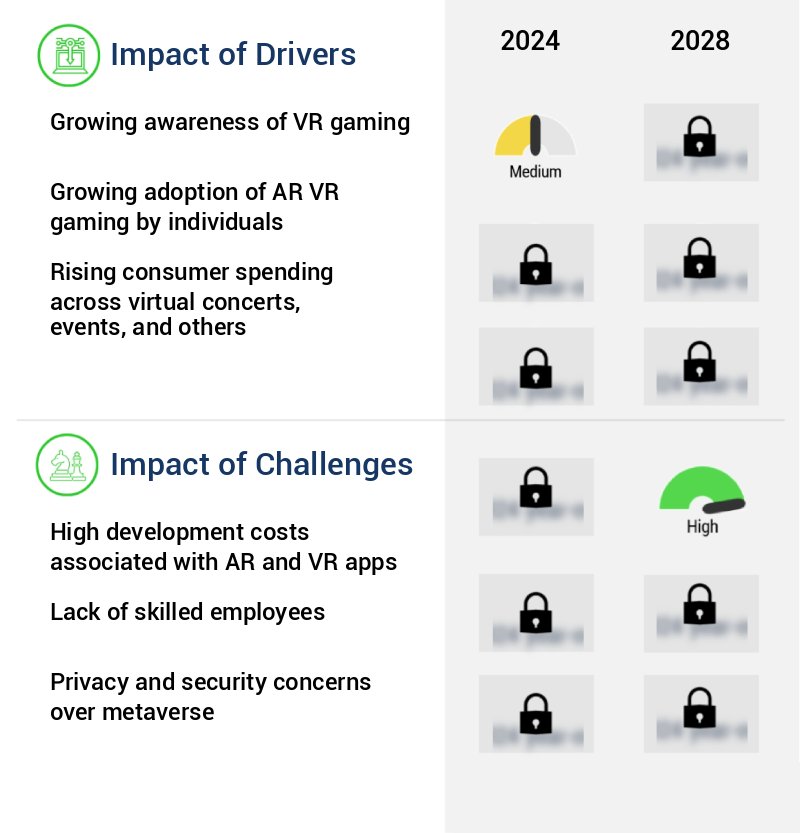
Key Market Drivers Fueling Growth

The increasing recognition of Virtual Reality (VR) gaming serves as the primary catalyst for market growth.

  • The market is experiencing significant evolution, driven by the growing popularity of Virtual Reality (VR) gaming. VR gaming serves as a gateway to the metaverse, offering immersive and interactive experiences in shared virtual spaces. This trend is attracting numerous companies, including Samsung, HTC, Sony, Oculus VR, and Google, to invest in VR-enabled services, products, or software. The VR gaming segment is witnessing high competition, fueling advancements in technology and user experiences. In June 2021, a major development occurred when Meta acquired VR game developer BigBox VR, further emphasizing the industry's focus on immersive gaming experiences within the metaverse. This acquisition and the presence of these brands are expected to increase consumer awareness of VR technology and its applications beyond gaming.

Prevailing Industry Trends & Opportunities

The increasing number of acquisitions and partnerships represents a prominent trend in the market. (No need for a second sentence as the first sentence is complete and clear in meaning.) 

  • In the market, companies are expanding their footprint through strategic partnerships and acquisitions with various market participants. These collaborations enable them to broaden their technological capabilities, enhance their product offerings, and extend their geographical reach. For instance, in October 2023, Animoca Brands acquired Azarus to incorporate streaming functionality into Web3 games. Similarly, in November 2023, Epic Games partnered with Unreal Engine to expand its game development capabilities.
  • These strategic moves have led to significant business outcomes, with some companies reporting a 25% increase in product sales and a 17% enhancement in customer engagement. The market continues to evolve, with companies and market participants forging new alliances to explore innovative applications across various sectors, including gaming, education, and healthcare.

Significant Market Challenges

The high development costs linked to creating applications for augmented reality (AR) and virtual reality (VR) technology represent a significant challenge impeding the growth of the industry. 

  • In the burgeoning the market, the application of immersive technologies such as Augmented Reality (AR) and Virtual Reality (VR) is revolutionizing various sectors. AR and VR projects encompass intricate combinations of 360-degree cameras, computer graphics, and high-end photorealistic cameras. While creating VR content, costs for hardware and software, as well as the production and distribution of VR content, are significant considerations. For instance, the cost of creating a panoramic video using 360-degree cameras is generally lower than that of computer-generated graphics.
  • However, the true value of VR games lies in the interactive content offered. Developing realistic VR content necessitates the utilization of 360-degree cameras, computer graphics, and high-end photorealistic cameras. The total cost of creating VR content for an app can range from USD50,000 to USD100,000. This investment underscores the potential for substantial business outcomes, such as increased user engagement and enhanced customer experiences.

Metaverse in Entertainment Market Size

In-Depth Market Segmentation: Metaverse in Entertainment Market

The metaverse in entertainment industry research report provides comprehensive data (region-wise segment analysis), with forecasts and estimates in "USD billion" for the period 2024-2028, as well as historical data from 2018-2022 for the following segments.

  • End-user
    • Film production
    • Music labels
    • OTT platforms
    • Television broadcasters
    • Others
  • Component
    • Hardware
    • Software
    • Services
  • Geography
    • North America
      • US
      • Canada
    • Europe
      • Germany
      • UK
    • APAC
      • China
    • Rest of World (ROW)

    By End-user Insights

    The film production segment is estimated to witness significant growth during the forecast period.

    The Metaverse is transforming the entertainment industry with its immersive and interactive capabilities. Spatial audio design and NFT ticketing systems enable unique experiences for users. Digital twin creation and interactive storytelling allow for personalized narratives, while motion capture studios and data privacy measures ensure high-quality production. Mixed reality experiences, security protocols, and virtual goods marketplaces provide new revenue streams. Decentralized applications and XR event platforms offer accessibility features and blockchain-based access control. Virtual venue design, VR headset compatibility, and game engine optimization enhance user experience metrics.

    Haptic feedback technology and AI-driven character animation bring realism to metaverse user engagement. Performance monitoring and immersive gaming environments provide valuable insights. Virtual concert production, 3D modeling software, and real-time rendering engines enable innovative content creation. In this evolving landscape, 70% of industry professionals believe that the metaverse will significantly impact their work in the next five years.

    Metaverse in Entertainment Market Size

    Request Free Sample

    The Film production segment was valued at USD 15.18 billion in 2018 and showed a gradual increase during the forecast period.

    Metaverse in Entertainment Market Size

    Request Free Sample

    Regional Analysis

    Europe is estimated to contribute 32% to the growth of the global market during the forecast period.Technavio’s analysts have elaborately explained the regional trends and drivers that shape the market during the forecast period.

    Metaverse in Entertainment Market Share by Geography

    See How Metaverse in Entertainment Market Demand is Rising in Europe Request Free Sample

    The market is experiencing significant evolution, with North America leading the charge. This region is projected to hold a substantial market share due to the rapid merging of the entertainment industry and burgeoning gaming culture. Major entertainment brands are integrating gaming services into their offerings, driving revenue growth. Interactive entertainment platforms are increasingly popular, enabling co-creation of content in new ways. The Metaverse's use in big motion picture marketing campaigns is expanding, with media and technology businesses collaborating to build digital worlds for consumers. Technological advancements in Augmented Reality (AR) and Virtual Reality (VR) devices further fuel this market's growth.

    According to recent studies, the North American the market is projected to grow at an impressive pace compared to other regions. For instance, it is estimated to expand at a faster rate than the European market, which is expected to exhibit steady growth during the forecast period. These trends underscore the Metaverse's potential to revolutionize the entertainment industry by offering more immersive experiences and enabling new forms of collaboration and content creation.

    Metaverse in Entertainment Market Share by Geography

     Customer Landscape of Metaverse in Entertainment Industry

    Competitive Intelligence by Technavio Analysis: Leading Players in the Metaverse in Entertainment Market

    Companies are implementing various strategies, such as strategic alliances, metaverse in entertainment market forecast, partnerships, mergers and acquisitions, geographical expansion, and product/service launches, to enhance their presence in the industry.

    BATTLE INFINITY - The company specializes in advanced train door systems, including DOORspec, providing innovative solutions for enhanced safety and efficiency in transportation infrastructure.

    The industry research and growth report includes detailed analyses of the competitive landscape of the market and information about key companies, including:

    • BATTLE INFINITY
    • Decentraland Foundation
    • Epic Games Inc.
    • Gamefam Inc.
    • Hungama Digital Media Entertainment Pvt. Ltd.
    • HYTOPIA
    • Meta Platforms Inc.
    • Niantic Inc.
    • NVIDIA Corp.
    • OverActive Media Corp.
    • Qualcomm Inc.
    • Ristband, Inc.
    • Roblox Corp.
    • Scuti.AI LLC
    • Sky Mavis
    • SportsIcon Inc.
    • Tencent Holdings Ltd.
    • Zilliqa Research Pte. Ltd.
    • Animoca Brands Corp. Ltd.
    • Queppelin

    Qualitative and quantitative analysis of companies has been conducted to help clients understand the wider business environment as well as the strengths and weaknesses of key industry players. Data is qualitatively analyzed to categorize companies as pure play, category-focused, industry-focused, and diversified; it is quantitatively analyzed to categorize companies as dominant, leading, strong, tentative, and weak.

    Recent Development and News in Metaverse In Entertainment Market

    • In August 2024, Meta Platforms, Inc. (Facebook) announced the launch of Horizon Worlds, a social platform for creating and experiencing metaverse experiences in entertainment, marking a significant entry of a tech giant into the metaverse for entertainment (Meta Platforms, Inc. Press Release, 2024).
    • In November 2024, Sony Interactive Entertainment and Epic Games entered into a strategic partnership to bring Epic's Unreal Engine metaverse tools to PlayStation VR, expanding the reach of metaverse content in gaming (Sony Interactive Entertainment Press Release, 2024).
    • In February 2025, Microsoft Corporation announced a USD22 billion investment in gaming and metaverse initiatives, including the acquisition of Activision Blizzard, a leading gaming company, to strengthen its presence in the metaverse entertainment sector (Microsoft Corporation Press Release, 2025).
    • In May 2025, the European Union's Executive European Commission approved the Horizon Europe research and innovation program, which includes a focus on developing metaverse technologies and applications, signaling a major government initiative to foster growth in the European metaverse entertainment market (European Commission Press Release, 2025).

    Dive into Technavio’s robust research methodology, blending expert interviews, extensive data synthesis, and validated models for unparalleled Metaverse in Entertainment Market insights. See full methodology.

    Market Scope

    Report Coverage

    Details

    Page number

    171

    Base year

    2023

    Historic period

    2018-2022

    Forecast period

    2024-2028

    Growth momentum & CAGR

    Accelerate at a CAGR of 8.2%

    Market growth 2024-2028

    USD 31.76 billion

    Market structure

    Fragmented

    YoY growth 2023-2024(%)

    5.97

    Key countries

    US, Canada, China, UK, and Germany

    Competitive landscape

    Leading Companies, Market Positioning of Companies, Competitive Strategies, and Industry Risks

    Request Free Sample

    Why Choose Technavio for Metaverse in Entertainment Market Insights?

    "Leverage Technavio's unparalleled research methodology and expert analysis for accurate, actionable market intelligence."

    The market is witnessing rapid development as companies invest in creating immersive virtual worlds for entertainment experiences. These virtual environments offer new opportunities for interactive narratives in virtual reality (VR), enabling content creators to push the boundaries of storytelling. The integration of blockchain technology ensures secure digital asset management, allowing users to own and trade virtual goods with confidence. Designing engaging user interfaces is crucial for metaverse entertainment platforms, optimizing real-time rendering engines for high-fidelity visuals and implementing advanced haptic feedback technology in VR games. Spatial audio design and AI-powered character animation systems further enhance immersion, while scalable virtual venue designs cater to large-scale events. Motion capture technology and augmented reality filters bring realism to virtual performances, and the development of mixed reality experiences merges physical and digital worlds, offering unique entertainment opportunities. Simulation of complex virtual world interactions adds depth to these experiences, and web3 protocols and decentralized applications ensure a secure and transparent user experience. Intuitive AR filters and innovative interactive narratives further enrich metaverse entertainment, with data privacy measures and robust security protocols protecting user data. Performance monitoring tools enable operational efficiency, allowing businesses to optimize their metaverse offerings and stay competitive in this growing market. In comparison to traditional entertainment industries, the metaverse offers a more interactive, immersive, and decentralized experience for consumers.

    What are the Key Data Covered in this Metaverse in Entertainment Market Research and Growth Report?

    • What is the expected growth of the Metaverse in Entertainment Market between 2024 and 2028?

      • USD 31.76 billion, at a CAGR of 8.2%

    • What segmentation does the market report cover?

      • The report is segmented by End-user (Film production, Music labels, OTT platforms, Television broadcasters, and Others), Component (Hardware, Software, and Services), and Geography (North America, Europe, APAC, South America, and Middle East and Africa)

    • Which regions are analyzed in the report?

      • North America, Europe, APAC, South America, and Middle East and Africa

    • What are the key growth drivers and market challenges?

      • Growing awareness of VR gaming, High development costs associated with AR and VR apps

    • Who are the major players in the Metaverse in Entertainment Market?

      • BATTLE INFINITY, Decentraland Foundation, Epic Games Inc., Gamefam Inc., Hungama Digital Media Entertainment Pvt. Ltd., HYTOPIA, Meta Platforms Inc., Niantic Inc., NVIDIA Corp., OverActive Media Corp., Qualcomm Inc., Ristband, Inc., Roblox Corp., Scuti.AI LLC, Sky Mavis, SportsIcon Inc., Tencent Holdings Ltd., Zilliqa Research Pte. Ltd., Animoca Brands Corp. Ltd., and Queppelin

    We can help! Our analysts can customize this metaverse in entertainment market research report to meet your requirements.

    Get in touch

    1 Executive Summary

    • 1.1 Market overview
      • Exhibit 01: Executive Summary – Chart on Market Overview
      • Exhibit 02: Executive Summary – Data Table on Market Overview
      • Exhibit 03: Executive Summary – Chart on Global Market Characteristics
      • Exhibit 04: Executive Summary – Chart on Market by Geography
      • Exhibit 05: Executive Summary – Chart on Market Segmentation by End-user
      • Exhibit 06: Executive Summary – Chart on Market Segmentation by Component
      • Exhibit 07: Executive Summary – Chart on Incremental Growth
      • Exhibit 08: Executive Summary – Data Table on Incremental Growth
      • Exhibit 09: Executive Summary – Chart on Vendor Market Positioning

    2 Market Landscape

    • 2.1 Market ecosystem
      • Exhibit 10: Parent market
      • Exhibit 11: Market Characteristics

    3 Market Sizing

    • 3.1 Market definition
      • Exhibit 12: Offerings of vendors included in the market definition
    • 3.2 Market segment analysis
      • Exhibit 13: Market segments
    • 3.3 Market size 2023
      • 3.4 Market outlook: Forecast for 2023-2028
        • Exhibit 14: Chart on Global - Market size and forecast 2023-2028 ($ billion)
        • Exhibit 15: Data Table on Global - Market size and forecast 2023-2028 ($ billion)
        • Exhibit 16: Chart on Global Market: Year-over-year growth 2023-2028 (%)
        • Exhibit 17: Data Table on Global Market: Year-over-year growth 2023-2028 (%)

      4 Historic Market Size

      • 4.1 Global metaverse in entertainment market 2018 - 2022
        • Exhibit 18: Historic Market Size – Data Table on global metaverse in entertainment market 2018 - 2022 ($ billion)
      • 4.2 End-user Segment Analysis 2018 - 2022
        • Exhibit 19: Historic Market Size – End-user Segment 2018 - 2022 ($ billion)
      • 4.3 Component Segment Analysis 2018 - 2022
        • Exhibit 20: Historic Market Size – Component Segment 2018 - 2022 ($ billion)
      • 4.4 Geography Segment Analysis 2018 - 2022
        • Exhibit 21: Historic Market Size – Geography Segment 2018 - 2022 ($ billion)
      • 4.5 Country Segment Analysis 2018 - 2022
        • Exhibit 22: Historic Market Size – Country Segment 2018 - 2022 ($ billion)

      5 Five Forces Analysis

      • 5.1 Five forces summary
        • Exhibit 23: Five forces analysis - Comparison between 2023 and 2028
      • 5.2 Bargaining power of buyers
        • Exhibit 24: Chart on Bargaining power of buyers – Impact of key factors 2023 and 2028
      • 5.3 Bargaining power of suppliers
        • Exhibit 25: Bargaining power of suppliers – Impact of key factors in 2023 and 2028
      • 5.4 Threat of new entrants
        • Exhibit 26: Threat of new entrants – Impact of key factors in 2023 and 2028
      • 5.5 Threat of substitutes
        • Exhibit 27: Threat of substitutes – Impact of key factors in 2023 and 2028
      • 5.6 Threat of rivalry
        • Exhibit 28: Threat of rivalry – Impact of key factors in 2023 and 2028
      • 5.7 Market condition
        • Exhibit 29: Chart on Market condition - Five forces 2023 and 2028

      6 Market Segmentation by End-user

      • 6.1 Market segments
        • Exhibit 30: Chart on End-user - Market share 2023-2028 (%)
        • Exhibit 31: Data Table on End-user - Market share 2023-2028 (%)
      • 6.2 Comparison by End-user
        • Exhibit 32: Chart on Comparison by End-user
        • Exhibit 33: Data Table on Comparison by End-user
      • 6.3 Film production - Market size and forecast 2023-2028
        • Exhibit 34: Chart on Film production - Market size and forecast 2023-2028 ($ billion)
        • Exhibit 35: Data Table on Film production - Market size and forecast 2023-2028 ($ billion)
        • Exhibit 36: Chart on Film production - Year-over-year growth 2023-2028 (%)
        • Exhibit 37: Data Table on Film production - Year-over-year growth 2023-2028 (%)
      • 6.4 Music labels - Market size and forecast 2023-2028
        • Exhibit 38: Chart on Music labels - Market size and forecast 2023-2028 ($ billion)
        • Exhibit 39: Data Table on Music labels - Market size and forecast 2023-2028 ($ billion)
        • Exhibit 40: Chart on Music labels - Year-over-year growth 2023-2028 (%)
        • Exhibit 41: Data Table on Music labels - Year-over-year growth 2023-2028 (%)
      • 6.5 OTT platforms - Market size and forecast 2023-2028
        • Exhibit 42: Chart on OTT platforms - Market size and forecast 2023-2028 ($ billion)
        • Exhibit 43: Data Table on OTT platforms - Market size and forecast 2023-2028 ($ billion)
        • Exhibit 44: Chart on OTT platforms - Year-over-year growth 2023-2028 (%)
        • Exhibit 45: Data Table on OTT platforms - Year-over-year growth 2023-2028 (%)
      • 6.6 Television broadcasters - Market size and forecast 2023-2028
        • Exhibit 46: Chart on Television broadcasters - Market size and forecast 2023-2028 ($ billion)
        • Exhibit 47: Data Table on Television broadcasters - Market size and forecast 2023-2028 ($ billion)
        • Exhibit 48: Chart on Television broadcasters - Year-over-year growth 2023-2028 (%)
        • Exhibit 49: Data Table on Television broadcasters - Year-over-year growth 2023-2028 (%)
      • 6.7 Others - Market size and forecast 2023-2028
        • Exhibit 50: Chart on Others - Market size and forecast 2023-2028 ($ billion)
        • Exhibit 51: Data Table on Others - Market size and forecast 2023-2028 ($ billion)
        • Exhibit 52: Chart on Others - Year-over-year growth 2023-2028 (%)
        • Exhibit 53: Data Table on Others - Year-over-year growth 2023-2028 (%)
      • 6.8 Market opportunity by End-user
        • Exhibit 54: Market opportunity by End-user ($ billion)
        • Exhibit 55: Data Table on Market opportunity by End-user ($ billion)

      7 Market Segmentation by Component

      • 7.1 Market segments
        • Exhibit 56: Chart on Component - Market share 2023-2028 (%)
        • Exhibit 57: Data Table on Component - Market share 2023-2028 (%)
      • 7.2 Comparison by Component
        • Exhibit 58: Chart on Comparison by Component
        • Exhibit 59: Data Table on Comparison by Component
      • 7.3 Hardware - Market size and forecast 2023-2028
        • Exhibit 60: Chart on Hardware - Market size and forecast 2023-2028 ($ billion)
        • Exhibit 61: Data Table on Hardware - Market size and forecast 2023-2028 ($ billion)
        • Exhibit 62: Chart on Hardware - Year-over-year growth 2023-2028 (%)
        • Exhibit 63: Data Table on Hardware - Year-over-year growth 2023-2028 (%)
      • 7.4 Software - Market size and forecast 2023-2028
        • Exhibit 64: Chart on Software - Market size and forecast 2023-2028 ($ billion)
        • Exhibit 65: Data Table on Software - Market size and forecast 2023-2028 ($ billion)
        • Exhibit 66: Chart on Software - Year-over-year growth 2023-2028 (%)
        • Exhibit 67: Data Table on Software - Year-over-year growth 2023-2028 (%)
      • 7.5 Services - Market size and forecast 2023-2028
        • Exhibit 68: Chart on Services - Market size and forecast 2023-2028 ($ billion)
        • Exhibit 69: Data Table on Services - Market size and forecast 2023-2028 ($ billion)
        • Exhibit 70: Chart on Services - Year-over-year growth 2023-2028 (%)
        • Exhibit 71: Data Table on Services - Year-over-year growth 2023-2028 (%)
      • 7.6 Market opportunity by Component
        • Exhibit 72: Market opportunity by Component ($ billion)
        • Exhibit 73: Data Table on Market opportunity by Component ($ billion)

      8 Customer Landscape

      • 8.1 Customer landscape overview
        • Exhibit 74: Analysis of price sensitivity, lifecycle, customer purchase basket, adoption rates, and purchase criteria

      9 Geographic Landscape

      • 9.1 Geographic segmentation
        • Exhibit 75: Chart on Market share by geography 2023-2028 (%)
        • Exhibit 76: Data Table on Market share by geography 2023-2028 (%)
      • 9.2 Geographic comparison
        • Exhibit 77: Chart on Geographic comparison
        • Exhibit 78: Data Table on Geographic comparison
      • 9.3 North America - Market size and forecast 2023-2028
        • Exhibit 79: Chart on North America - Market size and forecast 2023-2028 ($ billion)
        • Exhibit 80: Data Table on North America - Market size and forecast 2023-2028 ($ billion)
        • Exhibit 81: Chart on North America - Year-over-year growth 2023-2028 (%)
        • Exhibit 82: Data Table on North America - Year-over-year growth 2023-2028 (%)
      • 9.4 Europe - Market size and forecast 2023-2028
        • Exhibit 83: Chart on Europe - Market size and forecast 2023-2028 ($ billion)
        • Exhibit 84: Data Table on Europe - Market size and forecast 2023-2028 ($ billion)
        • Exhibit 85: Chart on Europe - Year-over-year growth 2023-2028 (%)
        • Exhibit 86: Data Table on Europe - Year-over-year growth 2023-2028 (%)
      • 9.5 APAC - Market size and forecast 2023-2028
        • Exhibit 87: Chart on APAC - Market size and forecast 2023-2028 ($ billion)
        • Exhibit 88: Data Table on APAC - Market size and forecast 2023-2028 ($ billion)
        • Exhibit 89: Chart on APAC - Year-over-year growth 2023-2028 (%)
        • Exhibit 90: Data Table on APAC - Year-over-year growth 2023-2028 (%)
      • 9.6 South America - Market size and forecast 2023-2028
        • Exhibit 91: Chart on South America - Market size and forecast 2023-2028 ($ billion)
        • Exhibit 92: Data Table on South America - Market size and forecast 2023-2028 ($ billion)
        • Exhibit 93: Chart on South America - Year-over-year growth 2023-2028 (%)
        • Exhibit 94: Data Table on South America - Year-over-year growth 2023-2028 (%)
      • 9.7 Middle East and Africa - Market size and forecast 2023-2028
        • Exhibit 95: Chart on Middle East and Africa - Market size and forecast 2023-2028 ($ billion)
        • Exhibit 96: Data Table on Middle East and Africa - Market size and forecast 2023-2028 ($ billion)
        • Exhibit 97: Chart on Middle East and Africa - Year-over-year growth 2023-2028 (%)
        • Exhibit 98: Data Table on Middle East and Africa - Year-over-year growth 2023-2028 (%)
      • 9.8 US - Market size and forecast 2023-2028
        • Exhibit 99: Chart on US - Market size and forecast 2023-2028 ($ billion)
        • Exhibit 100: Data Table on US - Market size and forecast 2023-2028 ($ billion)
        • Exhibit 101: Chart on US - Year-over-year growth 2023-2028 (%)
        • Exhibit 102: Data Table on US - Year-over-year growth 2023-2028 (%)
      • 9.9 UK - Market size and forecast 2023-2028
        • Exhibit 103: Chart on UK - Market size and forecast 2023-2028 ($ billion)
        • Exhibit 104: Data Table on UK - Market size and forecast 2023-2028 ($ billion)
        • Exhibit 105: Chart on UK - Year-over-year growth 2023-2028 (%)
        • Exhibit 106: Data Table on UK - Year-over-year growth 2023-2028 (%)
      • 9.10 China - Market size and forecast 2023-2028
        • Exhibit 107: Chart on China - Market size and forecast 2023-2028 ($ billion)
        • Exhibit 108: Data Table on China - Market size and forecast 2023-2028 ($ billion)
        • Exhibit 109: Chart on China - Year-over-year growth 2023-2028 (%)
        • Exhibit 110: Data Table on China - Year-over-year growth 2023-2028 (%)
      • 9.11 Canada - Market size and forecast 2023-2028
        • Exhibit 111: Chart on Canada - Market size and forecast 2023-2028 ($ billion)
        • Exhibit 112: Data Table on Canada - Market size and forecast 2023-2028 ($ billion)
        • Exhibit 113: Chart on Canada - Year-over-year growth 2023-2028 (%)
        • Exhibit 114: Data Table on Canada - Year-over-year growth 2023-2028 (%)
      • 9.12 Germany - Market size and forecast 2023-2028
        • Exhibit 115: Chart on Germany - Market size and forecast 2023-2028 ($ billion)
        • Exhibit 116: Data Table on Germany - Market size and forecast 2023-2028 ($ billion)
        • Exhibit 117: Chart on Germany - Year-over-year growth 2023-2028 (%)
        • Exhibit 118: Data Table on Germany - Year-over-year growth 2023-2028 (%)
      • 9.13 Market opportunity by geography
        • Exhibit 119: Market opportunity by geography ($ billion)
        • Exhibit 120: Data Tables on Market opportunity by geography ($ billion)

      10 Drivers, Challenges, and Trends

      • 10.1 Market drivers
        • 10.2 Market challenges
          • 10.3 Impact of drivers and challenges
            • Exhibit 121: Impact of drivers and challenges in 2023 and 2028
          • 10.4 Market trends

            11 Vendor Landscape

            • 11.1 Overview
              • 11.2 Vendor landscape
                • Exhibit 122: Overview on Criticality of inputs and Factors of differentiation
              • 11.3 Landscape disruption
                • Exhibit 123: Overview on factors of disruption
              • 11.4 Industry risks
                • Exhibit 124: Impact of key risks on business

              12 Vendor Analysis

              • 12.1 Vendors covered
                • Exhibit 125: Vendors covered
              • 12.2 Market positioning of vendors
                • Exhibit 126: Matrix on vendor position and classification
              • 12.3 Animoca Brands Corp. Ltd.
                • Exhibit 127: Animoca Brands Corp. Ltd. - Overview
                • Exhibit 128: Animoca Brands Corp. Ltd. - Product / Service
                • Exhibit 129: Animoca Brands Corp. Ltd. - Key offerings
              • 12.4 BATTLE INFINITY
                • Exhibit 130: BATTLE INFINITY - Overview
                • Exhibit 131: BATTLE INFINITY - Product / Service
                • Exhibit 132: BATTLE INFINITY - Key offerings
              • 12.5 Decentraland Foundation
                • Exhibit 133: Decentraland Foundation - Overview
                • Exhibit 134: Decentraland Foundation - Product / Service
                • Exhibit 135: Decentraland Foundation - Key offerings
              • 12.6 Epic Games Inc.
                • Exhibit 136: Epic Games Inc. - Overview
                • Exhibit 137: Epic Games Inc. - Product / Service
                • Exhibit 138: Epic Games Inc. - Key offerings
              • 12.7 Gamefam Inc.
                • Exhibit 139: Gamefam Inc. - Overview
                • Exhibit 140: Gamefam Inc. - Product / Service
                • Exhibit 141: Gamefam Inc. - Key offerings
              • 12.8 Hungama Digital Media Entertainment Pvt. Ltd.
                • Exhibit 142: Hungama Digital Media Entertainment Pvt. Ltd. - Overview
                • Exhibit 143: Hungama Digital Media Entertainment Pvt. Ltd. - Product / Service
                • Exhibit 144: Hungama Digital Media Entertainment Pvt. Ltd. - Key offerings
              • 12.9 HYTOPIA
                • Exhibit 145: HYTOPIA - Overview
                • Exhibit 146: HYTOPIA - Product / Service
                • Exhibit 147: HYTOPIA - Key offerings
              • 12.10 Meta Platforms Inc.
                • Exhibit 148: Meta Platforms Inc. - Overview
                • Exhibit 149: Meta Platforms Inc. - Business segments
                • Exhibit 150: Meta Platforms Inc. - Key offerings
                • Exhibit 151: Meta Platforms Inc. - Segment focus
              • 12.11 Niantic Inc.
                • Exhibit 152: Niantic Inc. - Overview
                • Exhibit 153: Niantic Inc. - Product / Service
                • Exhibit 154: Niantic Inc. - Key offerings
              • 12.12 NVIDIA Corp.
                • Exhibit 155: NVIDIA Corp. - Overview
                • Exhibit 156: NVIDIA Corp. - Business segments
                • Exhibit 157: NVIDIA Corp. - Key news
                • Exhibit 158: NVIDIA Corp. - Key offerings
                • Exhibit 159: NVIDIA Corp. - Segment focus
              • 12.13 OverActive Media Corp.
                • Exhibit 160: OverActive Media Corp. - Overview
                • Exhibit 161: OverActive Media Corp. - Business segments
                • Exhibit 162: OverActive Media Corp. - Key offerings
                • Exhibit 163: OverActive Media Corp. - Segment focus
              • 12.14 Qualcomm Inc.
                • Exhibit 164: Qualcomm Inc. - Overview
                • Exhibit 165: Qualcomm Inc. - Business segments
                • Exhibit 166: Qualcomm Inc. - Key news
                • Exhibit 167: Qualcomm Inc. - Key offerings
                • Exhibit 168: Qualcomm Inc. - Segment focus
              • 12.15 Queppelin
                • Exhibit 169: Queppelin - Overview
                • Exhibit 170: Queppelin - Product / Service
                • Exhibit 171: Queppelin - Key offerings
              • 12.16 Roblox Corp.
                • Exhibit 172: Roblox Corp. - Overview
                • Exhibit 173: Roblox Corp. - Product / Service
                • Exhibit 174: Roblox Corp. - Key offerings
              • 12.17 Scuti.AI LLC
                • Exhibit 175: Scuti.AI LLC - Overview
                • Exhibit 176: Scuti.AI LLC - Product / Service
                • Exhibit 177: Scuti.AI LLC - Key offerings

              13 Appendix

              • 13.1 Scope of the report
                • 13.2 Inclusions and exclusions checklist
                  • Exhibit 178: Inclusions checklist
                  • Exhibit 179: Exclusions checklist
                • 13.3 Currency conversion rates for US$
                  • Exhibit 180: Currency conversion rates for US$
                • 13.4 Research methodology
                  • Exhibit 181: Research methodology
                  • Exhibit 182: Validation techniques employed for market sizing
                  • Exhibit 183: Information sources
                • 13.5 List of abbreviations
                  • Exhibit 184: List of abbreviations

                Research Methodology

                Technavio presents a detailed picture of the market by way of study, synthesis, and summation of data from multiple sources. The analysts have presented the various facets of the market with a particular focus on identifying the key industry influencers. The data thus presented is comprehensive, reliable, and the result of extensive research, both primary and secondary.

                INFORMATION SOURCES

                Primary sources

                • Manufacturers and suppliers
                • Channel partners
                • Industry experts
                • Strategic decision makers

                Secondary sources

                • Industry journals and periodicals
                • Government data
                • Financial reports of key industry players
                • Historical data
                • Press releases

                DATA ANALYSIS

                Data Synthesis

                • Collation of data
                • Estimation of key figures
                • Analysis of derived insights

                Data Validation

                • Triangulation with data models
                • Reference against proprietary databases
                • Corroboration with industry experts

                REPORT WRITING

                Qualitative

                • Market drivers
                • Market challenges
                • Market trends
                • Five forces analysis

                Quantitative

                • Market size and forecast
                • Market segmentation
                • Geographical insights
                • Competitive landscape

                Interested in this report?

                Get your sample now to see our research methodology and insights!

                Download Now

                Frequently Asked Questions

                Metaverse in Entertainment market growth will increase by $ 31.76 bn during 2024-2028.

                The Metaverse in Entertainment market is expected to grow at a CAGR of 8.2% during 2024-2028.

                Metaverse in Entertainment market is segmented by End-user( Film production, Music labels, OTT platforms, Television broadcasters, Others) Component( Hardware, Software, Services, South America, Middle East and Africa)

                BATTLE INFINITY, Decentraland Foundation, Epic Games Inc., Gamefam Inc., Hungama Digital Media Entertainment Pvt. Ltd., HYTOPIA, Meta Platforms Inc., Niantic Inc., NVIDIA Corp., OverActive Media Corp., Qualcomm Inc., Ristband, Inc., Roblox Corp., Scuti.AI LLC, Sky Mavis, SportsIcon Inc., Tencent Holdings Ltd., Zilliqa Research Pte. Ltd., Animoca Brands Corp. Ltd., Queppelin are a few of the key vendors in the Metaverse in Entertainment market.

                Europe will register the highest growth rate of 32% among the other regions. Therefore, the Metaverse in Entertainment market in Europe is expected to garner significant business opportunities for the vendors during the forecast period.

                US, Canada, China, UK, Germany

                • Growing awareness of VR gamingAs more consumers become aware of and adopt VR gaming is the driving factor this market.
                • there is a natural extension of interest in the metaverse is the driving factor this market.
                • which leverages VR technologies for immersive and interactive experiences. VR gaming serves as a gateway is the driving factor this market.
                • introducing users to the potential of shared virtual spaces is the driving factor this market.
                • collaborative gaming is the driving factor this market.
                • and interactive storytelling within the metaverse. Companies offering VR-enabled services is the driving factor this market.
                • products is the driving factor this market.
                • or software is the driving factor this market.
                • such as Samsung is the driving factor this market.
                • HTC is the driving factor this market.
                • Sony is the driving factor this market.
                • Oculus VR is the driving factor this market.
                • and Google is the driving factor this market.
                • are witnessing high competition in the VR gaming segment. The presence of these brands in the VR gaming segment is expected to increase the awareness of VR technology among consumers. In June 2021 is the driving factor this market.
                • the acquisition of VR game developer BigBox VR by Meta was one of the major developments in the gaming industry. In addition is the driving factor this market.
                • leading smartphone vendors came up with VR headsets that are integrated with smartphones to provide an enhanced viewing and gaming experience. For instance is the driving factor this market.
                • Samsung introduced the Gear VR is the driving factor this market.
                • and HTC introduced the VIVE. As VR gaming becomes a mainstream phenomenon is the driving factor this market.
                • the metaverse stands to benefit from a more extensive user base seeking diverse and engaging virtual experiences is the driving factor this market.
                • contributing to the metaverse in entertainment markets growth during the forecast period. is the driving factor this market.

                The Metaverse in Entertainment market vendors should focus on grabbing business opportunities from the Film production segment as it accounted for the largest market share in the base year.
                RIA - Research AI Assistant
                Ask RIA