Mexico Aerospace Market Size 2025-2029
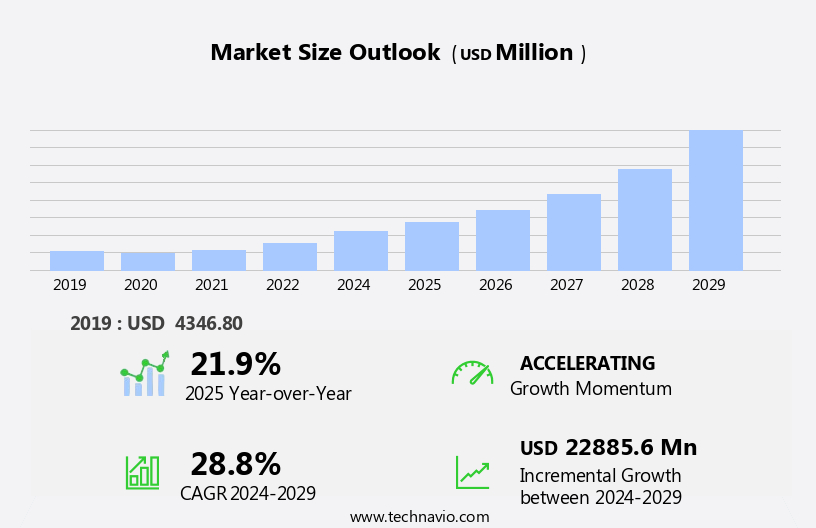
The Mexico aerospace market size is forecast to increase by USD 22.88 billion at a CAGR of 28.8% between 2024 and 2029.
- The Aerospace Market is experiencing growth, driven by a favorable regulatory environment and the expansion of low-cost airlines. Governments worldwide continue to invest in modernizing their aviation fleets and improving infrastructure, creating new opportunities for market participants. Additionally, the increasing affordability of air travel, driven by the growth of low-cost carriers, is expanding the customer base and increasing demand for aerospace products and services. However, the market is not without challenges. One significant challenge is the downgrading of regulatory standards in certain regions, which could impact safety and potentially disrupt supply chains.
- Companies seeking to capitalize on market opportunities must navigate these challenges effectively, focusing on innovation, cost competitiveness, and regulatory compliance. By staying abreast of market trends and regulatory developments, aerospace companies can position themselves for long-term growth and success. Consequently, Mexican carriers can only sell tickets for service on US carriers within the US. These issues may hinder the growth of the Mexican aerospace market, particularly in sectors like space tourism, electric propulsion, eVTOL aircraft, autonomous air taxis, commercial aircraft, and narrow-body aircraft during the forecast period.
What will be the size of the Mexico Aerospace Market during the forecast period?
- The aerospace market encompasses the design, manufacturing, and operation of aircraft, spacecraft, and related technologies. This dynamic sector is driven by continuous innovation and investment in aerospace technology, fueling growth and creating opportunities for aerospace solutions that address diverse applications. Trends in the aerospace industry include research and development in areas such as sustainability, safety, security, and digitalization. Challenges include regulatory compliance, workforce development, and infrastructure requirements. Collaboration among stakeholders, including governments, academia, and industry, is essential to addressing these challenges and driving advancements in aerospace.
- Aerospace policy and regulations play a critical role in shaping the industry's direction, while aerospace cybersecurity becomes increasingly important in an increasingly digitalized world. The aerospace sector's impact reaches beyond transportation and defense, influencing various industries and economies worldwide. Technology plays a crucial role in the development of advanced military capabilities, including fire control systems and satellite communication.
How is this market segmented?
The market research report provides comprehensive data (region-wise segment analysis), with forecasts and estimates in "USD million" for the period 2025-2029, as well as historical data from 2019-2023 for the following segments.
- End-user
- Government
- Private sector
- Revenue Stream
- Manufacturing
- Engineering and design
- Maintenace
- Repair and overhaul
- Geography
- Mexico
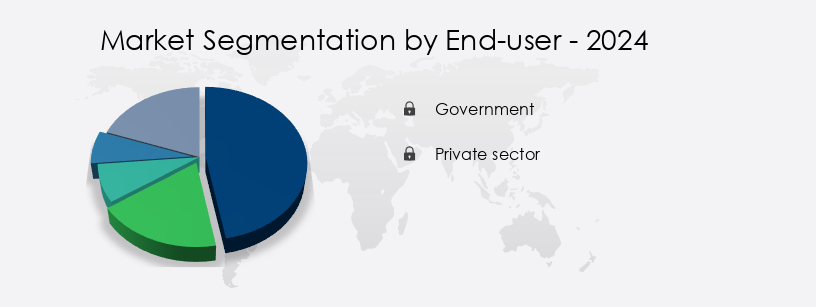
By End-user Insights
The government segment is estimated to witness significant growth during the forecast period. The Mexican aerospace market is driven by the significant role of the government segment, which accounted for a dominant market share in 2024. This dominance is primarily due to the extensive control the government holds over airport infrastructure. For instance, Aeropuertos y Servicios Auxiliares (ASA), a Mexican aerospace agency, manages 19 airports and collaborates on an additional five, including Toluca, Queretaro, Cuernavaca, Palenque, and Tuxtla Gutierrez. Furthermore, Benito Juarez International Airport, one of the world's busiest airports, is managed by Grupo Aeroportuario de la Ciudad de Mexico, S.A. De C.V., and served over 45 million passengers in 2024. The government's control over these critical infrastructure components is expected to fuel the growth of the aerospace market during the forecast period, with key areas including aircraft manufacturing, aerospace components, engine systems, aerospace materials such as aluminum alloys, aerospace engineering, propulsion systems, flight control, aircraft maintenance, air traffic management, satellite technology, space exploration, launch vehicles, remote sensing, aerospace defense, military aircraft, commercial aviation, passenger aircraft, cargo aircraft, business aviation, and general aviation.
Additionally, market trends include a focus on fuel efficiency, emissions reduction, electric aircraft, autonomous flight, artificial intelligence (AI), big data analytics, digital transformation, aerospace supply chain, manufacturing automation, advanced manufacturing, and 3D printing. Aerospace regulations and safety standards also play a crucial role in market growth.
Get a glance at the market share of various segments Request Free Sample
The Government segment was valued at USD 4.09 billion in 2019 and showed a gradual increase during the forecast period.
Market Dynamics
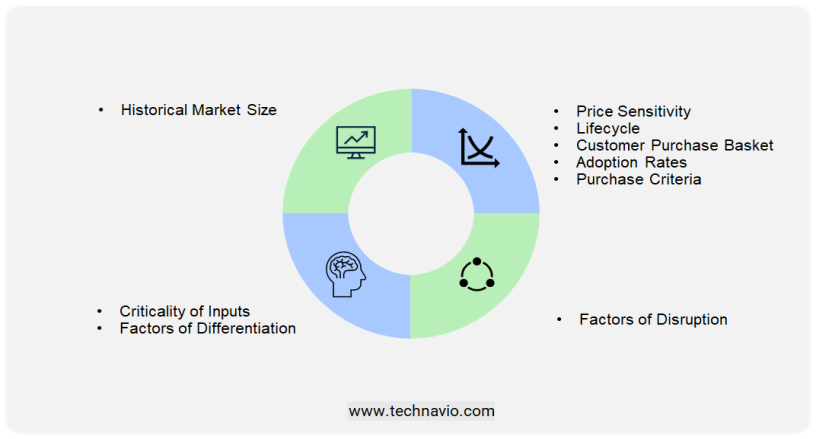
Our researchers analyzed the data with 2024 as the base year, along with the key drivers, trends, and challenges. A holistic analysis of drivers will help companies refine their marketing strategies to gain a competitive advantage.
What are the key market drivers leading to the rise in adoption of Mexico Aerospace Market?
- Favorable regulatory environment is the key driver of the market. The market has experienced significant growth due to a favorable regulatory environment that encourages foreign investment and supports industry expansion. Key drivers include the IMMEX program, which allows companies to import materials duty-free for manufacturing and subsequent export, reducing costs. Furthermore, the Value-Added Tax (VAT) Certification program offers tax incentives, making Mexico financially attractive for aerospace firms. The Mexican government has established trade compliance frameworks, enabling companies to navigate international trade regulations efficiently. These policies, coupled with strategic economic initiatives, have positioned Mexico as a competitive player in the global aerospace industry, attracting major international manufacturers and fostering technological advancements.
- The regulatory environment and incentives have contributed to the industry's growth, making Mexico an essential market for aerospace businesses. The UAM market is also gaining traction, with the development of EVtol aircraft and autonomous air taxis. The aerospace sector in Mexico is experiencing remarkable aerospace growth, driven by strategic aerospace investment and cutting-edge aerospace innovation. Emerging aerospace trends highlight both aerospace challenges and aerospace opportunities, fostering advancements in aerospace research and aerospace development. With a focus on aerospace education and aerospace training, the country is building a skilled workforce to support its expanding aerospace infrastructure.
What are the market trends shaping the Mexico Aerospace Market?
- Expansion of low-cost airlines is the upcoming trend in the market. The Mexican aerospace market has experienced significant transformation due to the emergence of low-cost airlines, with Volaris and Viva Aerobus leading the charge. The increasing demand for affordable air travel and strategic market positioning have driven this growth. Volaris, in particular, has captured a substantial domestic market share, surpassing traditional carriers. This success can be attributed to competitive pricing, extensive route networks, and efficient operations, making air travel accessible to a broader population. The market is experiencing significant growth, driven by the increasing demand for airplanes, spacecraft, missiles, and military systems. Mexico's strategic geographic location, serving as a hub for North and South American routes, and its tourism sector further support this growth.
- The low-cost airline model's success is a testament to the market's dynamic nature, with consumers increasingly seeking affordable travel options. These factors collectively contribute to the expanding the market. Prioritizing aerospace safety, aerospace security, and aerospace sustainability, Mexico's industry ensures a positive aerospace impact on global markets. Diverse aerospace applications and significant aerospace advancements are achieved through international aerospace collaboration. The integration of aerospace digital twin technology enhances efficiency, while initiatives in aerospace workforce development strengthen the sector's foundation. Mexico's aerospace market is a hub of innovation and opportunity.
What challenges does Mexico Aerospace Market face during the growth?
- Downgrading of Mexican aviation regulatory is a key challenge affecting the market growth. The downgrade of Mexico's aviation safety rating by the Federal Aviation Administration (FAA) from category 1 to category 2 has presented substantial obstacles for the market. This downgrade, resulting from non-compliance with international safety standards, impedes Mexican airlines from expanding services to the U.S. And hinders code-sharing agreements with American carriers. The consequences of this setback have affected the growth prospects of Mexico's aerospace industry, which has played a pivotal role in economic growth and foreign investment.
- Despite these challenges, the sector continues to demonstrate resilience, bolstered by a diverse supplier network and a skilled labor force. The industry has experienced a remarkable recovery, fueled by global demand for new aircraft and maintenance services. However, the downgrading of aviation regulatory standards poses a challenge for market expansion. Satellite technology, space exploration, launch vehicles, remote sensing, and aerospace defense are other domains within the aerospace industry. These sectors are characterized by their high-tech nature, complex engineering challenges, and significant research and development investments. The aerospace supply chain is a global network of manufacturers, suppliers, and logistics providers that support the production and delivery of aerospace products. Manufacturing automation, advanced manufacturing techniques like 3D printing, and big data analytics are transforming the supply chain, enabling greater efficiency, flexibility, and responsiveness. Regulations and safety standards are crucial components of the aerospace industry, ensuring the safety and reliability of aircraft and spacecraft.
How can Technavio assist you in making critical decisions?
Key Companies & Market Insights
Companies are implementing various strategies, such as strategic alliances, market forecast partnerships, mergers and acquisitions, geographical expansion, and product/service launches, to enhance their presence in the market.
The market research and growth report includes detailed analyses of the competitive landscape of the market and information about key companies, including:
- Airbus SE
- BASF SE
- Bombardier Inc.
- Collins Aerospace
- DAHER
- Dassault Aviation SA
- Ducommun Inc.
- General Electric Co.
- GKN Aerospace Services Ltd.
- Gulfstream Aerospace Corp.
- Honeywell Aerospace Technologies
- Mitsubishi Heavy Industries Ltd.
- Parker Hannifin Corp.
- Safran SA
- Textron Aviation Inc.
- Thales Group
- The Boeing Co.
Qualitative and quantitative analysis of companies has been conducted to help clients understand the wider business environment as well as the strengths and weaknesses of key market players. Data is qualitatively analyzed to categorize companies as pure play, category-focused, industry-focused, and diversified; it is quantitatively analyzed to categorize companies as dominant, leading, strong, tentative, and weak.
Research Analyst Overview
The aerospace industry encompasses a broad range of sectors, including aircraft manufacturing, aerospace components, engine systems, aerospace materials, and aerospace engineering. These domains are interconnected and dynamic, with ongoing advancements shaping the industry's landscape. Aircraft manufacturing involves the production of various types of aircraft, from commercial passenger planes to military jets and cargo carriers. The demand for these aircraft is influenced by factors such as global travel trends, defense budgets, and logistics requirements. Aerospace components refer to the individual parts and assemblies used in aircraft and spacecraft. Engine systems, for instance, play a crucial role in propulsion, while flight control components ensure aircraft stability and maneuverability.
Materials like aluminum alloys are essential in aerospace engineering due to their strength, lightweight properties, and resistance to corrosion. Propulsion systems are another vital aspect of the aerospace industry, with advancements in engine technology driving improvements in fuel efficiency and emissions reduction. The industry is also exploring electric aircraft and autonomous flight as potential solutions to environmental concerns and operational cost savings. Aircraft maintenance is a critical function that ensures the continued safe operation of aircraft. Airport infrastructure and air traffic management are also essential components of the aviation sector, with ongoing investments in digital transformation and advanced manufacturing technologies aimed at improving efficiency and safety. Continuous innovation and adaptation to new technologies and market demands are essential for companies to remain competitive in this dynamic and evolving industry.
|
Market Scope |
|
|
Report Coverage |
Details |
|
Page number |
144 |
|
Base year |
2024 |
|
Historic period |
2019-2023 |
|
Forecast period |
2025-2029 |
|
Growth momentum & CAGR |
Accelerate at a CAGR of 28.8% |
|
Market growth 2025-2029 |
USD 22.88 billion |
|
Market structure |
Fragmented |
|
YoY growth 2024-2025(%) |
21.9 |
|
Competitive landscape |
Leading Companies, Market Positioning of Companies, Competitive Strategies, and Industry Risks |
What are the Key Data Covered in this Market Research Report?
- CAGR of the market during the forecast period
- Detailed information on factors that will drive the market growth and forecasting between 2025 and 2029
- Precise estimation of the size of the market and its contribution of the market in focus to the parent market
- Accurate predictions about upcoming market growth and trends and changes in consumer behaviour
- Growth of the market across Mexico
- Thorough analysis of the market's competitive landscape and detailed information about companies
- Comprehensive analysis of factors that will challenge the growth of market companies
We can help! Our analysts can customize this market research report to meet your requirements Get in touch
 RIA -
RIA - 
