Micro LED Display Market Analysis, Size, and Forecast 2026-2030: APAC (China, South Korea, and Japan), North America (US, Canada, and Mexico), Europe (Germany, UK, and France), Middle East and Africa (UAE, Saudi Arabia, and Israel), South America (Brazil and Argentina), and Rest of World (ROW)

Micro LED Display Market Analysis, Size, and Forecast 2026-2030:
APAC (China, South Korea, and Japan), North America (US, Canada, and Mexico), Europe (Germany, UK, and France), Middle East and Africa (UAE, Saudi Arabia, and Israel), South America (Brazil and Argentina), and Rest of World (ROW)

Published: Jan 2026 288 Pages SKU: IRTNTR73811

Market Overview at a Glance

$9.94 B
Market Opportunity
52.5%
CAGR 2025 - 2030
41.3%
APAC Growth
$362.4 Mn
Aerospace and defense segment 2024

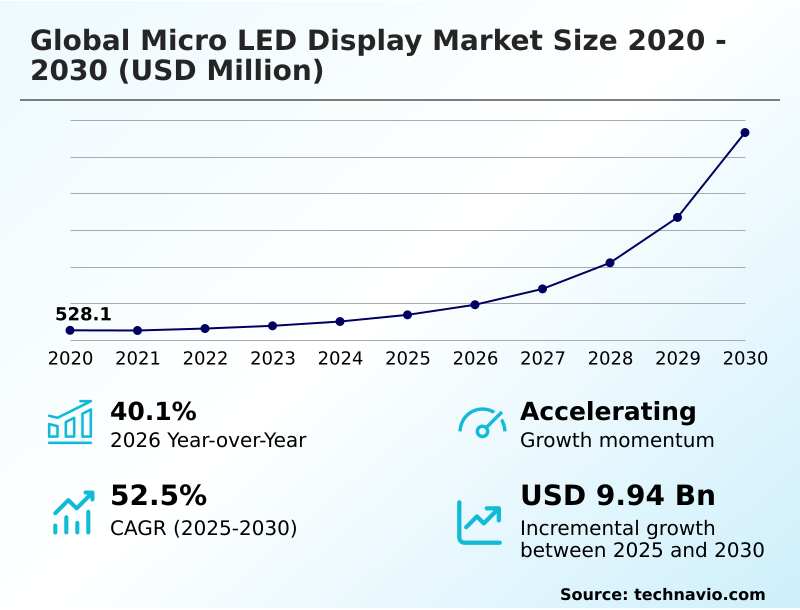
Micro LED Display Market Size 2026-2030

The micro led display market size is valued to increase by USD 9.94 billion, at a CAGR of 52.5% from 2025 to 2030. High-luminance and energy-efficient interfaces in AR and wearable sectors will drive the micro led display market.

Major Market Trends & Insights

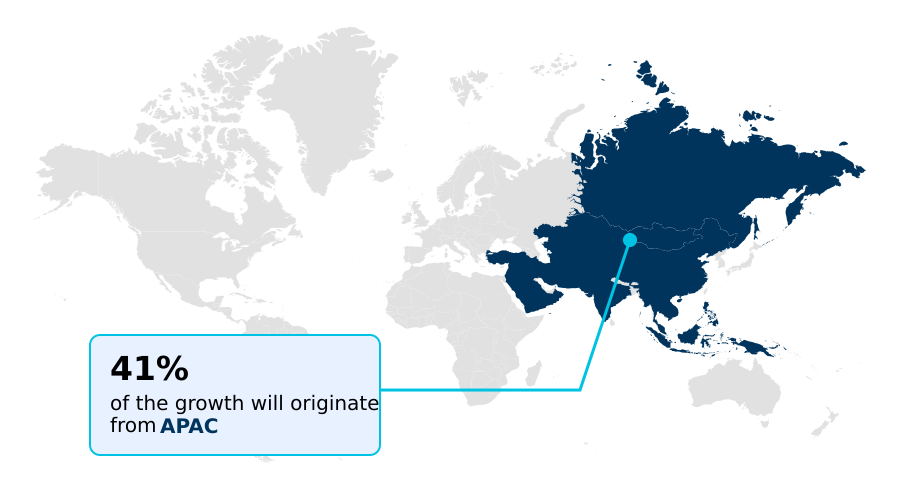
  • APAC dominated the market and accounted for a 41.3% growth during the forecast period.
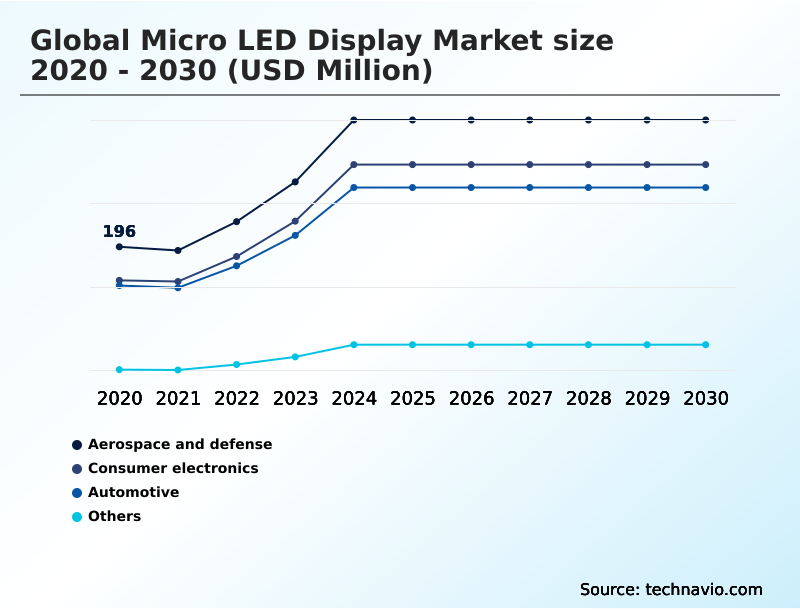
  • By End-user - Aerospace and defense segment was valued at USD 362.4 million in 2024
  • By Technology - Transfer micro LED segment accounted for the largest market revenue share in 2024

Market Size & Forecast

  • Market Opportunities: USD 10.79 billion
  • Market Future Opportunities: USD 9.94 billion
  • CAGR from 2025 to 2030 : 52.5%

Market Summary

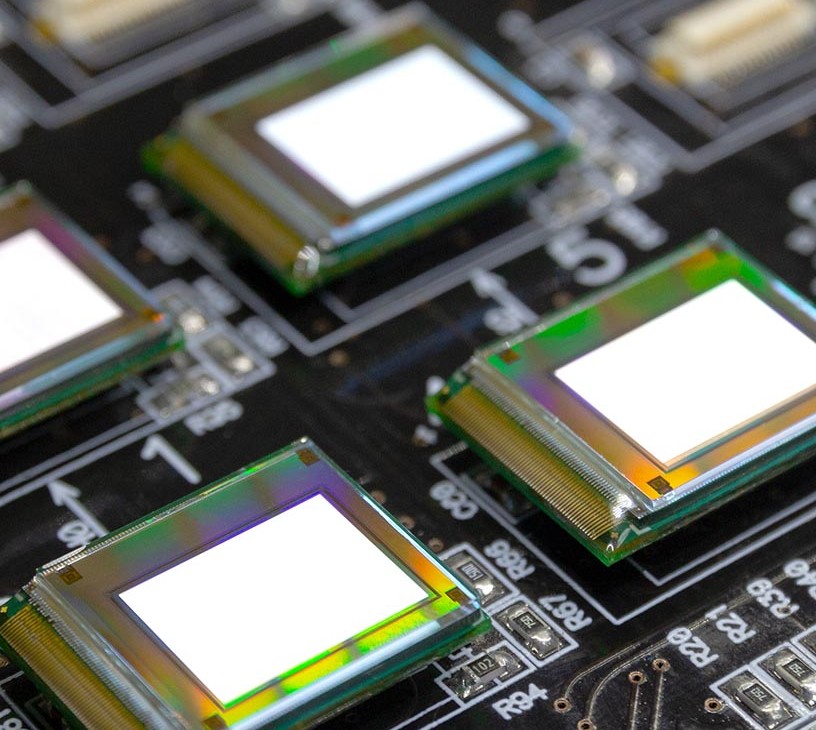
  • The micro LED display market is defined by its potential to supersede existing technologies through superior brightness, efficiency, and longevity. Based on self-emissive pixels made from inorganic gallium nitride, these displays eliminate the need for backlights, enabling thinner form factors and deeper black levels.
  • Growth is primarily driven by demand from premium applications where performance is non-negotiable, such as next-generation wearables, automotive head-up displays, and large-format video walls. A key industry trend revolves around perfecting mass transfer technology to move millions of microscopic light emitting diodes accurately and cost-effectively.
  • For instance, an automotive manufacturer developing a premium electric vehicle line must weigh the benefits of exceptional visual performance and durability for its dashboard displays against the current high costs and manufacturing complexities. The central challenge remains scaling production to reduce costs and achieve yields that make the technology viable for mainstream consumer electronics.
  • Success hinges on innovations that can transition micro LED from a niche, high-end solution to a widely adopted standard, impacting everything from consumer devices to industrial control panels.

What will be the Size of the Micro LED Display Market during the forecast period?

Get Key Insights on Market Forecast (PDF) Request Free Sample

How is the Micro LED Display Market Segmented?

The micro led display industry research report provides comprehensive data (region-wise segment analysis), with forecasts and estimates in "USD million" for the period 2026-2030, as well as historical data from 2020-2024 for the following segments.

  • End-user
    • Aerospace and defense
    • Consumer electronics
    • Automotive
    • Others
  • Technology
    • Transfer micro LED
    • Monolithic micro LED
    • Hybrid micro LED
  • Application
    • Digital signage
    • Wearable devices
    • Virtual reality
  • Geography
    • APAC
      • China
      • South Korea
      • Japan
    • North America
      • US
      • Canada
      • Mexico
    • Europe
      • Germany
      • UK
      • France
    • Middle East and Africa
      • UAE
      • Saudi Arabia
      • Israel
    • South America
      • Brazil
      • Argentina
    • Rest of World (ROW)

By End-user Insights

The aerospace and defense segment is estimated to witness significant growth during the forecast period.

The aerospace and defense segment mandates display solutions that offer uncompromising reliability and performance. Micro LED technology is uniquely suited for these applications, providing ruggedized display solutions essential for modern avionics display systems and near-eye applications.

The use of inorganic semiconductor materials ensures operational longevity and resilience in extreme environments.

Advanced manufacturing, including microsolid printing process and precise flip-chip bonding, enables the high pixel pitch density required for high-resolution projection in cockpits and control room video walls.

These direct-emissive display systems maintain performance integrity, with some advanced led modules achieving a 99.9% operational uptime in simulated mission-critical scenarios, thanks to features like cobalt-oxide encapsulation that protect microscopic light emitting diodes.

Request Free Sample

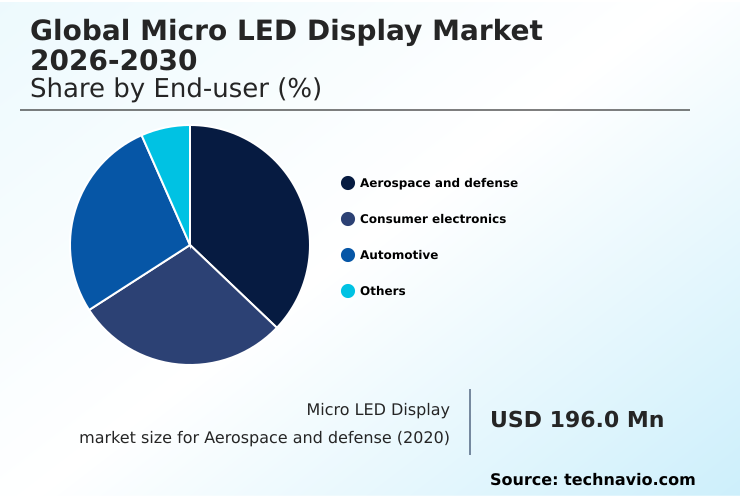
The Aerospace and defense segment was valued at USD 362.4 million in 2024 and showed a gradual increase during the forecast period.

Request Free Sample

Regional Analysis

APAC is estimated to contribute 41.3% to the growth of the global market during the forecast period.Technavio’s analysts have elaborately explained the regional trends and drivers that shape the market during the forecast period.

See How Micro LED Display Market Demand is Rising in APAC Request Free Sample

The geographic landscape of the market is characterized by a strategic division of labor.

APAC, particularly in countries like China, South Korea, and Taiwan, serves as the global manufacturing epicenter, driven by substantial government support and a highly integrated supply chain.

This regional concentration accounts for over 41% of the market's incremental growth, with a focus on scaling production of gan-on-silicon panels and refining backplane technology integration.

North America and Europe function as primary demand centers, leading the adoption of next-generation wearables and advanced automotive systems requiring high-dynamic-range content and transparent display technology.

The consolidation of the supply chain in APAC has been shown to reduce lead times for key components like epitaxial wafers by up to 20%, enhancing production efficiency for global brands leveraging microdisplay light engines for ar waveguide display products.

Market Dynamics

Our researchers analyzed the data with 2025 as the base year, along with the key drivers, trends, and challenges. A holistic analysis of drivers will help companies refine their marketing strategies to gain a competitive advantage.

  • Strategic evaluations in the display industry consistently analyze micro led vs oled power consumption, where micro led technology demonstrates significant advantages in efficiency, a critical factor for battery-dependent devices. A primary focus for manufacturers is the mass transfer yield rate improvement, which is directly linked to cost reduction in micro led manufacturing.
  • Overcoming challenges in the micro led repair process is essential for achieving the necessary production volumes. Applications are rapidly expanding, with significant development in micro led for automotive hud systems, where brightness and reliability are paramount. The use of gan-on-silicon for ar glasses is enabling higher pixel density requirements for vr headsets and other near-eye devices.
  • Technologically, quantum dot color conversion for micro led is being used to achieve full color realization in micro led, enhancing the visual experience. Key R&D efforts are targeting thermal management for micro led displays and improving external quantum efficiency in micro leds to boost performance and lifespan.
  • While direct-view displays are the most common application, developments in micro led backlighting for lcd panels offer an intermediate upgrade path. The industry is also innovating with driver ic design for micro led displays and monolithic integration for microdisplays, which simplifies manufacturing. As a result, micro led applications in aerospace defense are growing, where performance outweighs cost.
  • Success depends on perfecting technologies like hybrid bonding for fine pitch micro led and laser lift-off for micro led transfer, alongside robust yield management strategies for micro led and thorough reliability testing of micro led panels. The potential for flexible and stretchable micro led displays represents a significant future growth vector.

What are the key market drivers leading to the rise in the adoption of Micro LED Display Industry?

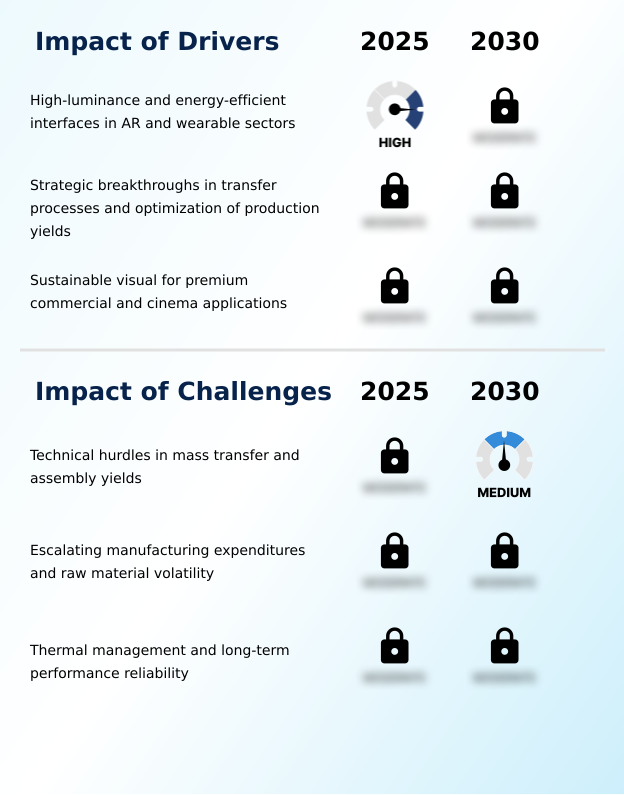
  • Demand for high-luminance, energy-efficient interfaces within the augmented reality and wearable device sectors is a key driver of market expansion.

  • Demand for superior visual performance in next-generation devices is a primary market driver. The inherent advantages of inorganic gallium nitride, such as high brightness and resistance to electroluminescence degradation, make it ideal for high-luminance displays.
  • Self-emissive pixels offer exceptional efficiency, with some common cathode architecture designs reducing power consumption by up to 50% in augmented reality microdisplays and wearable device screens.
  • This efficiency is critical for extending battery life in products like a smartwatch display module.
  • Furthermore, the automotive sector's requirement for next-generation automotive head-up displays to maintain a minimum luminance of 5,000 nits can only be met by inorganic technologies, which sustain high photoluminescence efficiency over a vehicle's lifespan without burn-in, driving adoption over organic alternatives.

What are the market trends shaping the Micro LED Display Industry?

  • Manufacturing scalability and the evolution of mass transfer technology represent critical trends. These advancements are essential for industrializing production and achieving commercial viability.

  • The market is undergoing a critical transition toward industrial-scale production, driven by advancements in mass transfer technology. The evolution from mechanical stamping to high-throughput laser systems is enabling a throughput increase of up to 400%, drastically reducing the assembly time for large-format video walls and premium consumer tvs. This shift is pivotal for lowering unit costs.
  • Concurrently, the integration of automated optical inspection is becoming standard, with new systems improving first-pass yields by up to 15% by identifying and correcting defective pixels in real time. Achieving a six-sigma yield goal is now a more tangible objective, essential for the viability of fine-pitch led products.
  • These trends in micro-transfer printing and uv-led curing are fostering a robust supply chain capable of supporting seamless modular displays for applications ranging from industrial control panels to cinema screen technology.

What challenges does the Micro LED Display Industry face during its growth?

  • Technical hurdles in mass transfer processes and the difficulty in achieving high assembly yields pose a key challenge to the industry's growth.

  • Significant technical challenges, primarily in manufacturing, constrain market growth. The mass transfer process demands sub-micrometer accuracy to assemble ultra-high-definition panels, a task complicated by van der waals forces at the microscopic level. Current defect rates in epitaxial wafer production and assembly can be over 50% higher than mass-market tolerance, making the cost of the pixel repair process prohibitive.
  • As pixel sizes shrink for applications like a vr headset panel, the complexity of handling components increases exponentially, with some processes being 10 times more intricate than traditional methods. Furthermore, ensuring the integrity of the anisotropic conductive film during bonding for flexible display substrates adds another layer of difficulty.
  • These hurdles in achieving high yields and managing costs currently limit widespread adoption in price-sensitive sectors.

Exclusive Technavio Analysis on Customer Landscape

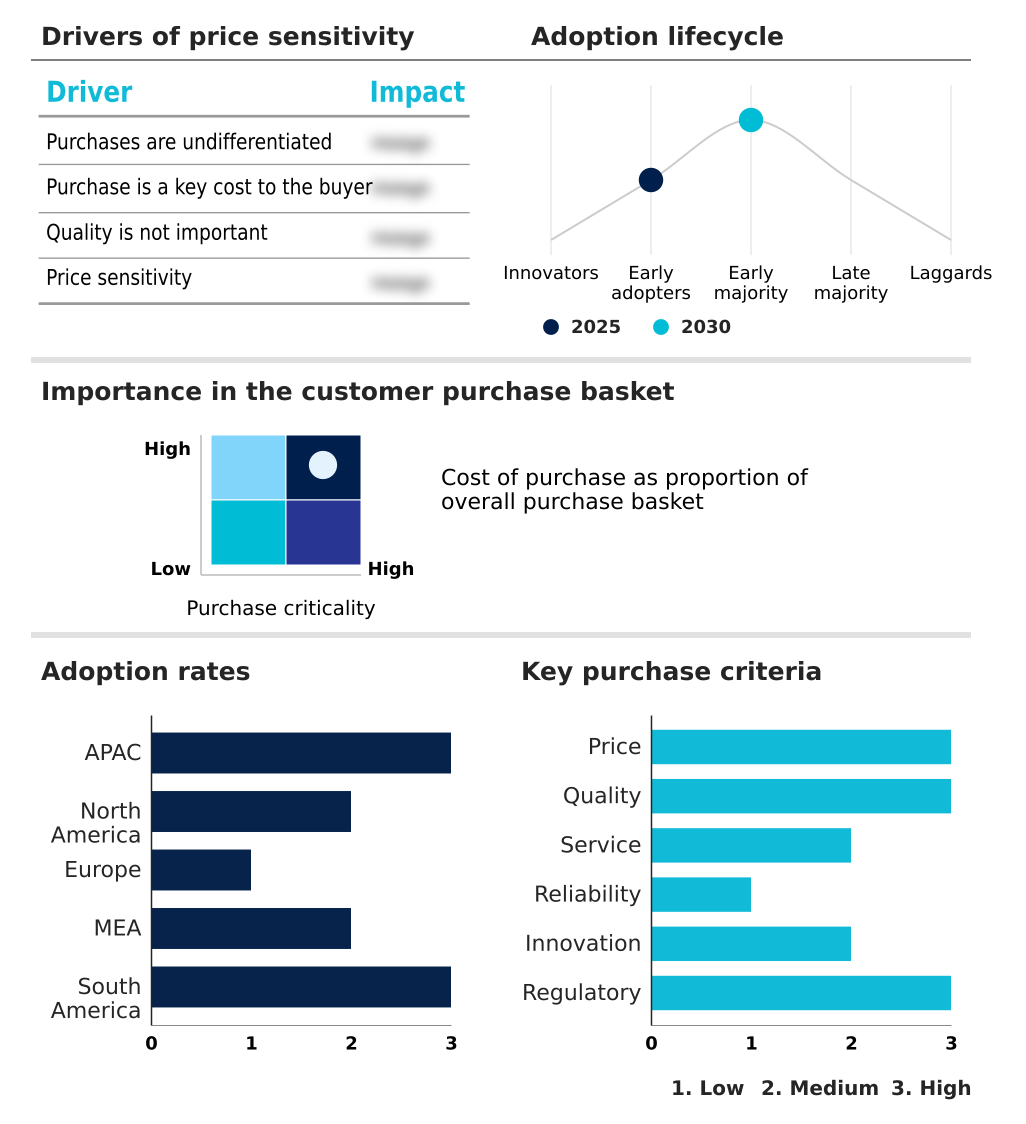
The micro led display market forecasting report includes the adoption lifecycle of the market, covering from the innovator’s stage to the laggard’s stage. It focuses on adoption rates in different regions based on penetration. Furthermore, the micro led display market report also includes key purchase criteria and drivers of price sensitivity to help companies evaluate and develop their market growth analysis strategies.

Customer Landscape of Micro LED Display Industry

Competitive Landscape

Companies are implementing various strategies, such as strategic alliances, micro led display market forecast, partnerships, mergers and acquisitions, geographical expansion, and product/service launches, to enhance their presence in the industry.

Aledia SA - Specializes in developing advanced micro-LED display technology, leveraging a unique 3D nanowire-on-silicon architecture for next-generation visual applications.

The industry research and growth report includes detailed analyses of the competitive landscape of the market and information about key companies, including:

  • Aledia SA
  • Apple Inc.
  • AUO Corp.
  • Innolux Corp.
  • Japan Display Inc.
  • JBD Inc.
  • LG Electronics Inc.
  • Lumens Co. Ltd.
  • Nanosys Inc.
  • Optovate Ltd.
  • Panasonic Holdings Corp.
  • PlayNitride Inc.
  • Plessey Semiconductors Ltd.
  • Samsung Electronics Co. Ltd.
  • Seiko Epson Corp.
  • VueReal Inc.

Qualitative and quantitative analysis of companies has been conducted to help clients understand the wider business environment as well as the strengths and weaknesses of key industry players. Data is qualitatively analyzed to categorize companies as pure play, category-focused, industry-focused, and diversified; it is quantitatively analyzed to categorize companies as dominant, leading, strong, tentative, and weak.

Recent Development and News in Micro led display market

  • In August 2025, Coherent Corporation released a high-throughput laser system designed for the mass transfer of micro LEDs, enhancing production speeds for large-area television manufacturing.
  • In May 2025, AUO Corporation demonstrated a high-resolution micro LED panel for automotive applications, utilizing a novel laser-based transfer method to improve yield consistency.
  • In March 2025, AUO Corp. and PlayNitride Inc. formalized a strategic agreement to improve mass transfer process yields for high-resolution automotive displays.
  • In February 2025, a major industrial zone in Chengdu announced the completion of a dedicated facility for the mass transfer of micro LED chips, aiming to increase domestic output of high-resolution panels.

Dive into Technavio’s robust research methodology, blending expert interviews, extensive data synthesis, and validated models for unparalleled Micro LED Display Market insights. See full methodology.

Market Scope
Page number 288
Base year 2025
Historic period 2020-2024
Forecast period 2026-2030
Growth momentum & CAGR Accelerate at a CAGR of 52.5%
Market growth 2026-2030 USD 9943.4 million
Market structure Fragmented
YoY growth 2025-2026(%) 40.1%
Key countries China, South Korea, Japan, Taiwan, India, Indonesia, US, Canada, Mexico, Germany, UK, France, Italy, Spain, The Netherlands, UAE, Saudi Arabia, Israel, Turkey, South Africa, Brazil, Argentina and Chile
Competitive landscape Leading Companies, Market Positioning of Companies, Competitive Strategies, and Industry Risks

Request Free Sample

Research Analyst Overview

  • The micro led display market is advancing through intense R&D focused on overcoming fundamental manufacturing hurdles. Boardroom decisions increasingly center on the strategic allocation of capital toward proprietary mass transfer technology and epitaxial wafer production to gain a competitive edge. The transition from laboratory to high-volume production hinges on perfecting the placement of microscopic light emitting diodes with sub-micrometer accuracy.
  • Innovations in inorganic semiconductor materials like inorganic gallium nitride are enabling superior self-emissive pixels that resist electroluminescence degradation. Developing a scalable pixel repair process is as critical as the initial assembly, with a direct impact on achieving a six-sigma yield goal. Key technologies such as laser-induced forward transfer, advanced led modules, and quantum dot enhancement are central to this evolution.
  • A pivotal business metric is the reduction of defects; automated optical inspection systems are already improving first-pass yields by over 15%, directly lowering production costs and accelerating market viability for everything from gan-on-silicon panels to large-format displays.

What are the Key Data Covered in this Micro LED Display Market Research and Growth Report?

  • What is the expected growth of the Micro LED Display Market between 2026 and 2030?

    • USD 9.94 billion, at a CAGR of 52.5%

  • What segmentation does the market report cover?

    • The report is segmented by End-user (Aerospace and defense, Consumer electronics, Automotive, and Others), Technology (Transfer micro LED, Monolithic micro LED, and Hybrid micro LED), Application (Digital signage, Wearable devices, and Virtual reality) and Geography (APAC, North America, Europe, Middle East and Africa, South America)

  • Which regions are analyzed in the report?

    • APAC, North America, Europe, Middle East and Africa and South America

  • What are the key growth drivers and market challenges?

    • High-luminance and energy-efficient interfaces in AR and wearable sectors, Technical hurdles in mass transfer and assembly yields

  • Who are the major players in the Micro LED Display Market?

    • Aledia SA, Apple Inc., AUO Corp., Innolux Corp., Japan Display Inc., JBD Inc., LG Electronics Inc., Lumens Co. Ltd., Nanosys Inc., Optovate Ltd., Panasonic Holdings Corp., PlayNitride Inc., Plessey Semiconductors Ltd., Samsung Electronics Co. Ltd., Seiko Epson Corp. and VueReal Inc.

Market Research Insights

  • The market is shaped by a dynamic interplay between demand for superior visual performance and the complexities of advanced manufacturing. The adoption of high-luminance displays in next-generation wearables is accelerating, with new designs showing a 30% improvement in outdoor readability.
  • Simultaneously, the push for energy-efficient interfaces in devices like smartwatches has led to display modules that extend battery life by up to 20% compared to previous generations. However, producing ultra-high-definition panels at scale remains a hurdle.
  • While applications in digital signage solutions and premium consumer TVs showcase the technology's potential, achieving cost-parity with established alternatives requires significant breakthroughs in yield management and production throughput. This balance between high-value applications and manufacturing viability defines the current competitive landscape.

We can help! Our analysts can customize this micro led display market research report to meet your requirements.

Get in touch

1. Executive Summary

1.1 Market overview

Executive Summary - Chart on Market Overview
Executive Summary - Data Table on Market Overview
Executive Summary - Chart on Global Market Characteristics
Executive Summary - Chart on Market by Geography
Executive Summary - Chart on Market Segmentation by End-user
Executive Summary - Chart on Market Segmentation by Technology
Executive Summary - Chart on Market Segmentation by Application
Executive Summary - Chart on Incremental Growth
Executive Summary - Data Table on Incremental Growth
Executive Summary - Chart on Company Market Positioning

2. Technavio Analysis

2.1 Analysis of price sensitivity, lifecycle, customer purchase basket, adoption rates, and purchase criteria

2.2 Criticality of inputs and Factors of differentiation

Chart on Overview on criticality of inputs and factors of differentiation

2.3 Factors of disruption

Chart on Overview on factors of disruption

2.4 Impact of drivers and challenges

Chart on Impact of drivers and challenges in 2025 and 2030

3. Market Landscape

3.1 Market ecosystem

Chart on Parent Market
Data Table on - Parent Market

3.2 Market characteristics

Chart on Market characteristics analysis

3.3 Value chain analysis

Chart on Value chain analysis

4. Market Sizing

4.1 Market definition

Data Table on Offerings of companies included in the market definition

4.2 Market segment analysis

Market segments

4.3 Market size 2025

4.4 Market outlook: Forecast for 2025-2030

Chart on Global - Market size and forecast 2025-2030 ($ million)
Data Table on Global - Market size and forecast 2025-2030 ($ million)
Chart on Global Market: Year-over-year growth 2025-2030 (%)
Data Table on Global Market: Year-over-year growth 2025-2030 (%)

5. Historic Market Size

5.1 Global Micro LED Display Market 2020 - 2024

Historic Market Size - Data Table on Global Micro LED Display Market 2020 - 2024 ($ million)

5.2 End-user segment analysis 2020 - 2024

Historic Market Size - End-user Segment 2020 - 2024 ($ million)

5.3 Technology segment analysis 2020 - 2024

Historic Market Size - Technology Segment 2020 - 2024 ($ million)

5.4 Application segment analysis 2020 - 2024

Historic Market Size - Application Segment 2020 - 2024 ($ million)

5.5 Geography segment analysis 2020 - 2024

Historic Market Size - Geography Segment 2020 - 2024 ($ million)

5.6 Country segment analysis 2020 - 2024

Historic Market Size - Country Segment 2020 - 2024 ($ million)

6. Qualitative Analysis

6.1 Impact of AI in global micro LED display market

7. Five Forces Analysis

7.1 Five forces summary

Five forces analysis - Comparison between 2025 and 2030

7.2 Bargaining power of buyers

Bargaining power of buyers - Impact of key factors 2025 and 2030

7.3 Bargaining power of suppliers

Bargaining power of suppliers - Impact of key factors in 2025 and 2030

7.4 Threat of new entrants

Threat of new entrants - Impact of key factors in 2025 and 2030

7.5 Threat of substitutes

Threat of substitutes - Impact of key factors in 2025 and 2030

7.6 Threat of rivalry

Threat of rivalry - Impact of key factors in 2025 and 2030

7.7 Market condition

Chart on Market condition - Five forces 2025 and 2030

8. Market Segmentation by End-user

8.1 Market segments

Chart on End-user - Market share 2025-2030 (%)
Data Table on End-user - Market share 2025-2030 (%)

8.2 Comparison by End-user

Chart on Comparison by End-user
Data Table on Comparison by End-user

8.3 Aerospace and defense - Market size and forecast 2025-2030

Chart on Aerospace and defense - Market size and forecast 2025-2030 ($ million)
Data Table on Aerospace and defense - Market size and forecast 2025-2030 ($ million)
Chart on Aerospace and defense - Year-over-year growth 2025-2030 (%)
Data Table on Aerospace and defense - Year-over-year growth 2025-2030 (%)

8.4 Consumer electronics - Market size and forecast 2025-2030

Chart on Consumer electronics - Market size and forecast 2025-2030 ($ million)
Data Table on Consumer electronics - Market size and forecast 2025-2030 ($ million)
Chart on Consumer electronics - Year-over-year growth 2025-2030 (%)
Data Table on Consumer electronics - Year-over-year growth 2025-2030 (%)

8.5 Automotive - Market size and forecast 2025-2030

Chart on Automotive - Market size and forecast 2025-2030 ($ million)
Data Table on Automotive - Market size and forecast 2025-2030 ($ million)
Chart on Automotive - Year-over-year growth 2025-2030 (%)
Data Table on Automotive - Year-over-year growth 2025-2030 (%)

8.6 Others - Market size and forecast 2025-2030

Chart on Others - Market size and forecast 2025-2030 ($ million)
Data Table on Others - Market size and forecast 2025-2030 ($ million)
Chart on Others - Year-over-year growth 2025-2030 (%)
Data Table on Others - Year-over-year growth 2025-2030 (%)

8.7 Market opportunity by End-user

Market opportunity by End-user ($ million)
Data Table on Market opportunity by End-user ($ million)

9. Market Segmentation by Technology

9.1 Market segments

Chart on Technology - Market share 2025-2030 (%)
Data Table on Technology - Market share 2025-2030 (%)

9.2 Comparison by Technology

Chart on Comparison by Technology
Data Table on Comparison by Technology

9.3 Transfer micro LED - Market size and forecast 2025-2030

Chart on Transfer micro LED - Market size and forecast 2025-2030 ($ million)
Data Table on Transfer micro LED - Market size and forecast 2025-2030 ($ million)
Chart on Transfer micro LED - Year-over-year growth 2025-2030 (%)
Data Table on Transfer micro LED - Year-over-year growth 2025-2030 (%)

9.4 Monolithic micro LED - Market size and forecast 2025-2030

Chart on Monolithic micro LED - Market size and forecast 2025-2030 ($ million)
Data Table on Monolithic micro LED - Market size and forecast 2025-2030 ($ million)
Chart on Monolithic micro LED - Year-over-year growth 2025-2030 (%)
Data Table on Monolithic micro LED - Year-over-year growth 2025-2030 (%)

9.5 Hybrid micro LED - Market size and forecast 2025-2030

Chart on Hybrid micro LED - Market size and forecast 2025-2030 ($ million)
Data Table on Hybrid micro LED - Market size and forecast 2025-2030 ($ million)
Chart on Hybrid micro LED - Year-over-year growth 2025-2030 (%)
Data Table on Hybrid micro LED - Year-over-year growth 2025-2030 (%)

9.6 Market opportunity by Technology

Market opportunity by Technology ($ million)
Data Table on Market opportunity by Technology ($ million)

10. Market Segmentation by Application

10.1 Market segments

Chart on Application - Market share 2025-2030 (%)
Data Table on Application - Market share 2025-2030 (%)

10.2 Comparison by Application

Chart on Comparison by Application
Data Table on Comparison by Application

10.3 Digital signage - Market size and forecast 2025-2030

Chart on Digital signage - Market size and forecast 2025-2030 ($ million)
Data Table on Digital signage - Market size and forecast 2025-2030 ($ million)
Chart on Digital signage - Year-over-year growth 2025-2030 (%)
Data Table on Digital signage - Year-over-year growth 2025-2030 (%)

10.4 Wearable devices - Market size and forecast 2025-2030

Chart on Wearable devices - Market size and forecast 2025-2030 ($ million)
Data Table on Wearable devices - Market size and forecast 2025-2030 ($ million)
Chart on Wearable devices - Year-over-year growth 2025-2030 (%)
Data Table on Wearable devices - Year-over-year growth 2025-2030 (%)

10.5 Virtual reality - Market size and forecast 2025-2030

Chart on Virtual reality - Market size and forecast 2025-2030 ($ million)
Data Table on Virtual reality - Market size and forecast 2025-2030 ($ million)
Chart on Virtual reality - Year-over-year growth 2025-2030 (%)
Data Table on Virtual reality - Year-over-year growth 2025-2030 (%)

10.6 Market opportunity by Application

Market opportunity by Application ($ million)
Data Table on Market opportunity by Application ($ million)

11. Customer Landscape

11.1 Customer landscape overview

Analysis of price sensitivity, lifecycle, customer purchase basket, adoption rates, and purchase criteria

12. Geographic Landscape

12.1 Geographic segmentation

Chart on Market share by geography 2025-2030 (%)
Data Table on Market share by geography 2025-2030 (%)

12.2 Geographic comparison

Chart on Geographic comparison
Data Table on Geographic comparison

12.3 APAC - Market size and forecast 2025-2030

Chart on APAC - Market size and forecast 2025-2030 ($ million)
Data Table on APAC - Market size and forecast 2025-2030 ($ million)
Chart on APAC - Year-over-year growth 2025-2030 (%)
Data Table on APAC - Year-over-year growth 2025-2030 (%)
Chart on Regional Comparison - APAC
Data Table on Regional Comparison - APAC

12.3.1 China - Market size and forecast 2025-2030

Chart on China - Market size and forecast 2025-2030 ($ million)
Data Table on China - Market size and forecast 2025-2030 ($ million)
Chart on China - Year-over-year growth 2025-2030 (%)
Data Table on China - Year-over-year growth 2025-2030 (%)

12.3.2 South Korea - Market size and forecast 2025-2030

Chart on South Korea - Market size and forecast 2025-2030 ($ million)
Data Table on South Korea - Market size and forecast 2025-2030 ($ million)
Chart on South Korea - Year-over-year growth 2025-2030 (%)
Data Table on South Korea - Year-over-year growth 2025-2030 (%)

12.3.3 Japan - Market size and forecast 2025-2030

Chart on Japan - Market size and forecast 2025-2030 ($ million)
Data Table on Japan - Market size and forecast 2025-2030 ($ million)
Chart on Japan - Year-over-year growth 2025-2030 (%)
Data Table on Japan - Year-over-year growth 2025-2030 (%)

12.3.4 Taiwan - Market size and forecast 2025-2030

Chart on Taiwan - Market size and forecast 2025-2030 ($ million)
Data Table on Taiwan - Market size and forecast 2025-2030 ($ million)
Chart on Taiwan - Year-over-year growth 2025-2030 (%)
Data Table on Taiwan - Year-over-year growth 2025-2030 (%)

12.3.5 India - Market size and forecast 2025-2030

Chart on India - Market size and forecast 2025-2030 ($ million)
Data Table on India - Market size and forecast 2025-2030 ($ million)
Chart on India - Year-over-year growth 2025-2030 (%)
Data Table on India - Year-over-year growth 2025-2030 (%)

12.3.6 Indonesia - Market size and forecast 2025-2030

Chart on Indonesia - Market size and forecast 2025-2030 ($ million)
Data Table on Indonesia - Market size and forecast 2025-2030 ($ million)
Chart on Indonesia - Year-over-year growth 2025-2030 (%)
Data Table on Indonesia - Year-over-year growth 2025-2030 (%)

12.4 North America - Market size and forecast 2025-2030

Chart on North America - Market size and forecast 2025-2030 ($ million)
Data Table on North America - Market size and forecast 2025-2030 ($ million)
Chart on North America - Year-over-year growth 2025-2030 (%)
Data Table on North America - Year-over-year growth 2025-2030 (%)
Chart on Regional Comparison - North America
Data Table on Regional Comparison - North America

12.4.1 US - Market size and forecast 2025-2030

Chart on US - Market size and forecast 2025-2030 ($ million)
Data Table on US - Market size and forecast 2025-2030 ($ million)
Chart on US - Year-over-year growth 2025-2030 (%)
Data Table on US - Year-over-year growth 2025-2030 (%)

12.4.2 Canada - Market size and forecast 2025-2030

Chart on Canada - Market size and forecast 2025-2030 ($ million)
Data Table on Canada - Market size and forecast 2025-2030 ($ million)
Chart on Canada - Year-over-year growth 2025-2030 (%)
Data Table on Canada - Year-over-year growth 2025-2030 (%)

12.4.3 Mexico - Market size and forecast 2025-2030

Chart on Mexico - Market size and forecast 2025-2030 ($ million)
Data Table on Mexico - Market size and forecast 2025-2030 ($ million)
Chart on Mexico - Year-over-year growth 2025-2030 (%)
Data Table on Mexico - Year-over-year growth 2025-2030 (%)

12.5 Europe - Market size and forecast 2025-2030

Chart on Europe - Market size and forecast 2025-2030 ($ million)
Data Table on Europe - Market size and forecast 2025-2030 ($ million)
Chart on Europe - Year-over-year growth 2025-2030 (%)
Data Table on Europe - Year-over-year growth 2025-2030 (%)
Chart on Regional Comparison - Europe
Data Table on Regional Comparison - Europe

12.5.1 Germany - Market size and forecast 2025-2030

Chart on Germany - Market size and forecast 2025-2030 ($ million)
Data Table on Germany - Market size and forecast 2025-2030 ($ million)
Chart on Germany - Year-over-year growth 2025-2030 (%)
Data Table on Germany - Year-over-year growth 2025-2030 (%)

12.5.2 UK - Market size and forecast 2025-2030

Chart on UK - Market size and forecast 2025-2030 ($ million)
Data Table on UK - Market size and forecast 2025-2030 ($ million)
Chart on UK - Year-over-year growth 2025-2030 (%)
Data Table on UK - Year-over-year growth 2025-2030 (%)

12.5.3 France - Market size and forecast 2025-2030

Chart on France - Market size and forecast 2025-2030 ($ million)
Data Table on France - Market size and forecast 2025-2030 ($ million)
Chart on France - Year-over-year growth 2025-2030 (%)
Data Table on France - Year-over-year growth 2025-2030 (%)

12.5.4 Italy - Market size and forecast 2025-2030

Chart on Italy - Market size and forecast 2025-2030 ($ million)
Data Table on Italy - Market size and forecast 2025-2030 ($ million)
Chart on Italy - Year-over-year growth 2025-2030 (%)
Data Table on Italy - Year-over-year growth 2025-2030 (%)

12.5.5 Spain - Market size and forecast 2025-2030

Chart on Spain - Market size and forecast 2025-2030 ($ million)
Data Table on Spain - Market size and forecast 2025-2030 ($ million)
Chart on Spain - Year-over-year growth 2025-2030 (%)
Data Table on Spain - Year-over-year growth 2025-2030 (%)

12.5.6 The Netherlands - Market size and forecast 2025-2030

Chart on The Netherlands - Market size and forecast 2025-2030 ($ million)
Data Table on The Netherlands - Market size and forecast 2025-2030 ($ million)
Chart on The Netherlands - Year-over-year growth 2025-2030 (%)
Data Table on The Netherlands - Year-over-year growth 2025-2030 (%)

12.6 Middle East and Africa - Market size and forecast 2025-2030

Chart on Middle East and Africa - Market size and forecast 2025-2030 ($ million)
Data Table on Middle East and Africa - Market size and forecast 2025-2030 ($ million)
Chart on Middle East and Africa - Year-over-year growth 2025-2030 (%)
Data Table on Middle East and Africa - Year-over-year growth 2025-2030 (%)
Chart on Regional Comparison - Middle East and Africa
Data Table on Regional Comparison - Middle East and Africa

12.6.1 UAE - Market size and forecast 2025-2030

Chart on UAE - Market size and forecast 2025-2030 ($ million)
Data Table on UAE - Market size and forecast 2025-2030 ($ million)
Chart on UAE - Year-over-year growth 2025-2030 (%)
Data Table on UAE - Year-over-year growth 2025-2030 (%)

12.6.2 Saudi Arabia - Market size and forecast 2025-2030

Chart on Saudi Arabia - Market size and forecast 2025-2030 ($ million)
Data Table on Saudi Arabia - Market size and forecast 2025-2030 ($ million)
Chart on Saudi Arabia - Year-over-year growth 2025-2030 (%)
Data Table on Saudi Arabia - Year-over-year growth 2025-2030 (%)

12.6.3 Israel - Market size and forecast 2025-2030

Chart on Israel - Market size and forecast 2025-2030 ($ million)
Data Table on Israel - Market size and forecast 2025-2030 ($ million)
Chart on Israel - Year-over-year growth 2025-2030 (%)
Data Table on Israel - Year-over-year growth 2025-2030 (%)

12.6.4 Turkey - Market size and forecast 2025-2030

Chart on Turkey - Market size and forecast 2025-2030 ($ million)
Data Table on Turkey - Market size and forecast 2025-2030 ($ million)
Chart on Turkey - Year-over-year growth 2025-2030 (%)
Data Table on Turkey - Year-over-year growth 2025-2030 (%)

12.6.5 South Africa - Market size and forecast 2025-2030

Chart on South Africa - Market size and forecast 2025-2030 ($ million)
Data Table on South Africa - Market size and forecast 2025-2030 ($ million)
Chart on South Africa - Year-over-year growth 2025-2030 (%)
Data Table on South Africa - Year-over-year growth 2025-2030 (%)

12.7 South America - Market size and forecast 2025-2030

Chart on South America - Market size and forecast 2025-2030 ($ million)
Data Table on South America - Market size and forecast 2025-2030 ($ million)
Chart on South America - Year-over-year growth 2025-2030 (%)
Data Table on South America - Year-over-year growth 2025-2030 (%)
Chart on Regional Comparison - South America
Data Table on Regional Comparison - South America

12.7.1 Brazil - Market size and forecast 2025-2030

Chart on Brazil - Market size and forecast 2025-2030 ($ million)
Data Table on Brazil - Market size and forecast 2025-2030 ($ million)
Chart on Brazil - Year-over-year growth 2025-2030 (%)
Data Table on Brazil - Year-over-year growth 2025-2030 (%)

12.7.2 Argentina - Market size and forecast 2025-2030

Chart on Argentina - Market size and forecast 2025-2030 ($ million)
Data Table on Argentina - Market size and forecast 2025-2030 ($ million)
Chart on Argentina - Year-over-year growth 2025-2030 (%)
Data Table on Argentina - Year-over-year growth 2025-2030 (%)

12.7.3 Chile - Market size and forecast 2025-2030

Chart on Chile - Market size and forecast 2025-2030 ($ million)
Data Table on Chile - Market size and forecast 2025-2030 ($ million)
Chart on Chile - Year-over-year growth 2025-2030 (%)
Data Table on Chile - Year-over-year growth 2025-2030 (%)

12.8 Market opportunity by geography

Market opportunity by geography ($ million)
Data Tables on Market opportunity by geography ($ million)

13. Drivers, Challenges, and Opportunity

13.1 Market drivers

High-luminance and energy-efficient interfaces in AR and wearable sectors
Strategic breakthroughs in transfer processes and optimization of production yields
Sustainable visual for premium commercial and cinema applications

13.2 Market challenges

Technical hurdles in mass transfer and assembly yields
Escalating manufacturing expenditures and raw material volatility
Thermal management and long-term performance reliability

13.3 Impact of drivers and challenges

Impact of drivers and challenges in 2025 and 2030

13.4 Market opportunities

Manufacturing scalability and evolution of mass transfer technology
Proliferation in augmented reality and high-performance wearable devices
Strategic adoption in automotive and public infrastructure sector

14. Competitive Landscape

14.1 Overview

14.2

Overview on criticality of inputs and factors of differentiation

14.3 Landscape disruption

Overview on factors of disruption

14.4 Industry risks

Impact of key risks on business

15. Competitive Analysis

15.1 Companies profiled

Companies covered

15.2 Company ranking index

15.3 Market positioning of companies

Matrix on companies position and classification

15.4 Aledia SA

Aledia SA - Overview
Aledia SA - Product / Service
Aledia SA - Key offerings
SWOT

15.5 Apple Inc.

Apple Inc. - Overview
Apple Inc. - Business segments
Apple Inc. - Key news
Apple Inc. - Key offerings
Apple Inc. - Segment focus
SWOT

15.6 AUO Corp.

AUO Corp. - Overview
AUO Corp. - Business segments
AUO Corp. - Key news
AUO Corp. - Key offerings
AUO Corp. - Segment focus
SWOT

15.7 Innolux Corp.

Innolux Corp. - Overview
Innolux Corp. - Product / Service
Innolux Corp. - Key offerings
SWOT

15.8 Japan Display Inc.

Japan Display Inc. - Overview
Japan Display Inc. - Product / Service
Japan Display Inc. - Key news
Japan Display Inc. - Key offerings
SWOT

15.9 JBD Inc.

JBD Inc. - Overview
JBD Inc. - Product / Service
JBD Inc. - Key offerings
SWOT

15.10 LG Electronics Inc.

LG Electronics Inc. - Overview
LG Electronics Inc. - Product / Service
LG Electronics Inc. - Key offerings
SWOT

15.11 Lumens Co. Ltd.

Lumens Co. Ltd. - Overview
Lumens Co. Ltd. - Business segments
Lumens Co. Ltd. - Key offerings
Lumens Co. Ltd. - Segment focus
SWOT

15.12 Nanosys Inc.

Nanosys Inc. - Overview
Nanosys Inc. - Product / Service
Nanosys Inc. - Key offerings
SWOT

15.13 Optovate Ltd.

Optovate Ltd. - Overview
Optovate Ltd. - Product / Service
Optovate Ltd. - Key offerings
SWOT

15.14 Panasonic Holdings Corp.

Panasonic Holdings Corp. - Overview
Panasonic Holdings Corp. - Business segments
Panasonic Holdings Corp. - Key news
Panasonic Holdings Corp. - Key offerings
Panasonic Holdings Corp. - Segment focus
SWOT

15.15 PlayNitride Inc.

PlayNitride Inc. - Overview
PlayNitride Inc. - Product / Service
PlayNitride Inc. - Key offerings
SWOT

15.16 Plessey Semiconductors Ltd.

Plessey Semiconductors Ltd. - Overview
Plessey Semiconductors Ltd. - Product / Service
Plessey Semiconductors Ltd. - Key offerings
SWOT

15.17 Samsung Electronics Co. Ltd.

Samsung Electronics Co. Ltd. - Overview
Samsung Electronics Co. Ltd. - Business segments
Samsung Electronics Co. Ltd. - Key news
Samsung Electronics Co. Ltd. - Key offerings
Samsung Electronics Co. Ltd. - Segment focus
SWOT

15.18 Seiko Epson Corp.

Seiko Epson Corp. - Overview
Seiko Epson Corp. - Business segments
Seiko Epson Corp. - Key news
Seiko Epson Corp. - Key offerings
Seiko Epson Corp. - Segment focus
SWOT

16. Appendix

16.1 Scope of the report

Market definition
Objectives
Notes and caveats

16.2 Inclusions and exclusions checklist

Inclusions checklist
Exclusions checklist

16.3 Currency conversion rates for US$

16.4 Research methodology

16.5 Data procurement

Information sources

16.6 Data validation

16.7 Validation techniques employed for market sizing

16.8 Data synthesis

16.9 360 degree market analysis

16.10 List of abbreviations

Research Methodology

Technavio presents a detailed picture of the market by way of study, synthesis, and summation of data from multiple sources. The analysts have presented the various facets of the market with a particular focus on identifying the key industry influencers. The data thus presented is comprehensive, reliable, and the result of extensive research, both primary and secondary.

INFORMATION SOURCES

Primary sources

  • Manufacturers and suppliers
  • Channel partners
  • Industry experts
  • Strategic decision makers

Secondary sources

  • Industry journals and periodicals
  • Government data
  • Financial reports of key industry players
  • Historical data
  • Press releases

DATA ANALYSIS

Data Synthesis

  • Collation of data
  • Estimation of key figures
  • Analysis of derived insights

Data Validation

  • Triangulation with data models
  • Reference against proprietary databases
  • Corroboration with industry experts

REPORT WRITING

Qualitative

  • Market drivers
  • Market challenges
  • Market trends
  • Five forces analysis

Quantitative

  • Market size and forecast
  • Market segmentation
  • Geographical insights
  • Competitive landscape

Interested in this report?

Get your sample now to see our research methodology and insights!

Download Now

Frequently Asked Questions

Micro LED Display market growth will increase by USD 9943.4 million during 2026-2030.

The Micro LED Display market is expected to grow at a CAGR of 52.5% during 2026-2030.

Micro LED Display market is segmented by End-user (Aerospace and defense, Consumer electronics, Automotive, Others) Technology (Transfer micro LED, Monolithic micro LED, Hybrid micro LED) Application (Digital signage, Wearable devices, Virtual reality)

Aledia SA, Apple Inc., AUO Corp., Innolux Corp., Japan Display Inc., JBD Inc., LG Electronics Inc., Lumens Co. Ltd., Nanosys Inc., Optovate Ltd., Panasonic Holdings Corp., PlayNitride Inc., Plessey Semiconductors Ltd., Samsung Electronics Co. Ltd., Seiko Epson Corp., VueReal Inc. are a few of the key vendors in the Micro LED Display market.

APAC will register the highest growth rate of 41.3% among the other regions. Therefore, the Micro LED Display market in APAC is expected to garner significant business opportunities for the vendors during the forecast period.

China, South Korea, Japan, Taiwan, India, Indonesia, US, Canada, Mexico, Germany, UK, France, Italy, Spain, The Netherlands, UAE, Saudi Arabia, Israel, Turkey, South Africa, Brazil, Argentina, Chile

  • High-luminance and energy-efficient interfaces in AR and wearable sectors is the driving factor this market.

The Micro LED Display market vendors should focus on grabbing business opportunities from the End-user segment as it accounted for the largest market share in the base year.