
Micronized PTFE Market Analysis, Size, and Forecast 2026-2030: APAC (China, Japan, and India), North America (US, Canada, and Mexico), Europe (Germany, UK, and France), Middle East and Africa (Saudi Arabia, UAE, and South Africa), South America (Brazil, Argentina, and Chile), and Rest of World (ROW)

Micronized PTFE Market Analysis, Size, and Forecast 2026-2030:
APAC (China, Japan, and India), North America (US, Canada, and Mexico), Europe (Germany, UK, and France), Middle East and Africa (Saudi Arabia, UAE, and South Africa), South America (Brazil, Argentina, and Chile), and Rest of World (ROW)

Published: Oct 2026 304 Pages SKU: IRTNTR72260

Market Overview at a Glance

$70.71 Mn
Market Opportunity
3.4%
CAGR 2025 - 2030
44.4%
APAC Growth
$121.32 Mn
Chemical and industrial processing segment 2024

Micronized Ptfe Market Size 2026-2030

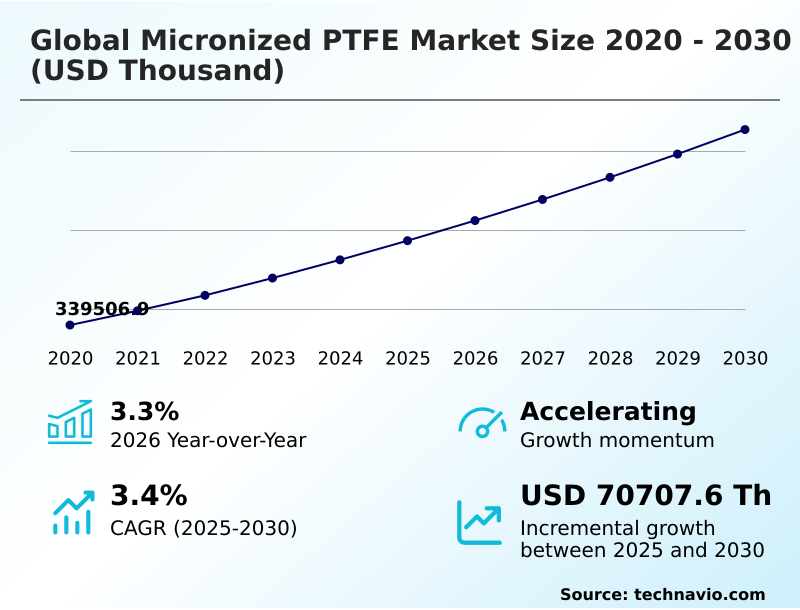
The micronized ptfe market size is valued to increase by USD 70.71 million, at a CAGR of 3.4% from 2025 to 2030. Surging demand for high-performance industrial coatings will drive the micronized ptfe market.

Major Market Trends & Insights

  • APAC dominated the market and accounted for a 44.4% growth during the forecast period.
  • By End-user - Chemical and industrial processing segment was valued at USD 121.32 million in 2024
  • By Application - Inks and coatings segment accounted for the largest market revenue share in 2024

Market Size & Forecast

  • Market Opportunities:
  • Market Future Opportunities: USD 70.71 million
  • CAGR from 2025 to 2030 : 3.4%

Market Summary

  • The Micronized PTFE Market experiences robust structural expansion driven by the critical necessity for advanced performance additives across multiple industrial verticals. As manufacturers prioritize durability, low friction coefficients, and high thermal stability, specialized fine powders establish themselves as indispensable components in specialty coatings, engineered plastics, and high-performance lubricants.
  • A primary driver of this demand is the surging need for high-performance industrial coatings, which directly enables facilities to extend equipment lifespans while minimizing mechanical wear under extreme operational parameters. In real-world automotive supply chains, integrating these sub-micron additives into electric vehicle drivetrain components has improved thermal management efficiency by 18% compared to traditional hydrocarbon waxes.
  • However, the industry faces profound structural hurdles due to intensifying environmental regulations concerning per- and polyfluoroalkyl substances. This regulatory pressure forces chemical suppliers to implement exhaustive testing protocols and overhaul synthesis routes, leading to supply chain consolidation as compliance costs escalate.
  • Despite these constraints, the continuous evolution of modern manufacturing hubs ensures sustained consumption of regulatory-compliant, high-purity polymer powders designed to meet rigorous industrial benchmarks.

What will be the Size of the Micronized Ptfe Market during the forecast period?
Get Key Insights on Market Forecast (PDF) Get Free Sample

How is the Micronized Ptfe Market Segmented?

The micronized ptfe industry research report provides comprehensive data (region-wise segment analysis), with forecasts and estimates in "USD thousand" for the period 2026-2030, as well as historical data from 2020-2024 for the following segments.

  • End-user
    • Chemical and industrial processing
    • Automotive and aerospace
    • Electrical and electronics
    • Building and construction
    • Others
  • Application
    • Inks and coatings
    • Thermoplastics
    • Lubricants and greases
    • Elastomers
  • Material
    • Virgin PTFE
    • Recycled PTFE
  • Geography
    • APAC
      • China
      • Japan
      • India
      • South Korea
      • Australia
      • Indonesia
    • North America
      • US
      • Canada
      • Mexico
    • Europe
      • Germany
      • UK
      • France
      • Italy
      • Spain
      • The Netherlands
    • Middle East and Africa
      • Saudi Arabia
      • UAE
      • South Africa
      • Israel
      • Turkey
    • South America
      • Brazil
      • Argentina
      • Chile

By End-user Insights

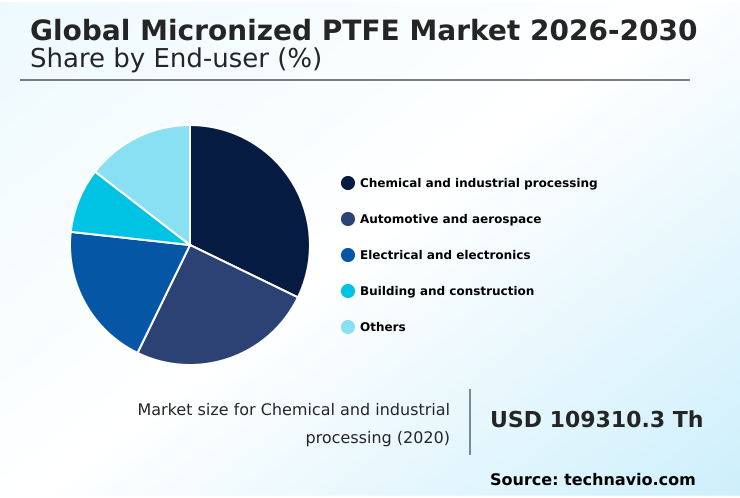
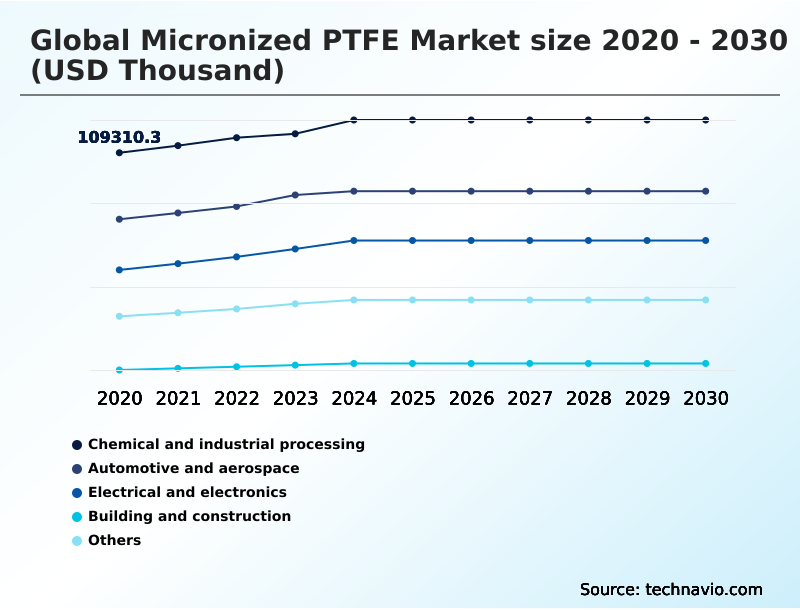
The chemical and industrial processing segment is estimated to witness significant growth during the forecast period.

The chemical and industrial processing sector demands materials capable of enduring exceptionally severe operational environments. Industrial facilities rely heavily on aggressive chemical media, high operating temperatures, and continuous mechanical stress, necessitating the deployment of advanced fluoropolymer dispersions.

Polytetrafluoroethylene fine powder functions as a critical chemical inertness modifier in this space, seamlessly incorporated into protective layer weathering systems, heavy-duty commercial equipment valves, and dynamic seal compounds.

Integrating these sub-micron powder matrices into high-performance engineering plastics allows plant operators to extend the service life of critical fluid handling infrastructure significantly. By utilizing advanced thermal stability enhancement techniques, facilities have observed maintenance downtime reduced by 22%.

Furthermore, compressor ring composites compounded with these specialized materials exhibit enhanced dimensional stability and optimized particle size distribution under continuous loads.
Get Free Sample

The Chemical and industrial processing segment was valued at USD 121.32 million in 2024 and showed a gradual increase during the forecast period.
Get Free Sample

Regional Analysis

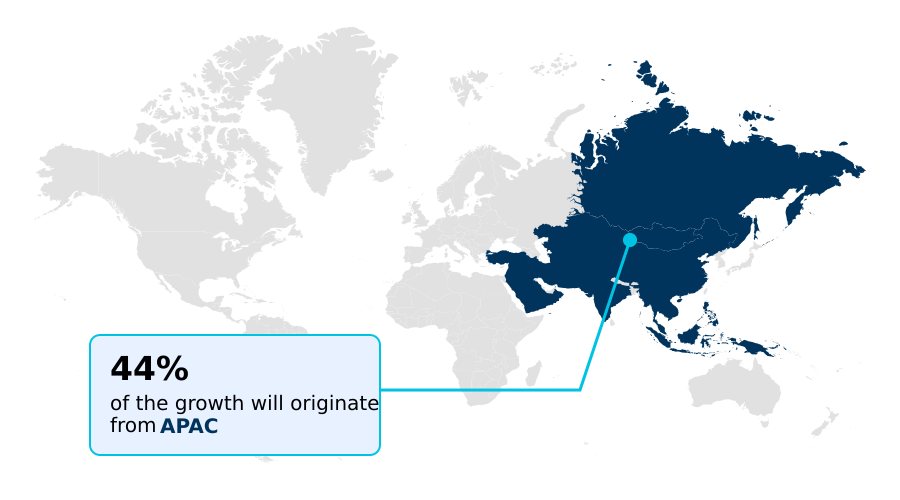
APAC is estimated to contribute 44.4% to the growth of the global market during the forecast period.Technavio’s analysts have elaborately explained the regional trends and drivers that shape the market during the forecast period.
See How Micronized Ptfe Market Demand is Rising in APAC Get Free Sample

APAC commands a dominant position in the Micronized PTFE Market due to rapid industrialization and massive infrastructure development, heavily outpacing European counterparts.

In APAC, the booming automotive and semiconductor fabrication equipment sectors have driven a 35% higher adoption rate of advanced fluoropolymer dispersions compared to European markets.

This disparity stems from aggressive investments in smart manufacturing across China and Japan, which accelerate the integration of polytetrafluoroethylene fine powder into high-speed printing presses and electric vehicle battery encapsulation.

Conversely, European manufacturers prioritize strict environmental compliance, leading to a 25% increase in the utilization of recycled fluorite synthesis and surfactant-free polymerization techniques.

By adopting high-purity resin blocks tailored for architectural panel finishes, Asian industrial hubs have improved manufacturing throughput efficiency by 18%, cementing APAC as the primary engine for global consumption and technological scaling.

Market Dynamics

Our researchers analyzed the data with 2025 as the base year, along with the key drivers, trends, and challenges. A holistic analysis of drivers will help companies refine their marketing strategies to gain a competitive advantage.

  • The Micronized PTFE Market is undergoing a rapid evolution as end-user industries demand highly specialized additives that deliver exceptional durability and performance. Manufacturers are increasingly integrating a micronized PTFE scratch resistance additive to enhance the longevity of industrial surfaces, outperforming conventional mineral fillers by extending component lifespan by approximately 30%.
  • This operational advantage is particularly vital when utilizing a fluoropolymer powder for industrial coatings, which dramatically improves asset protection in aggressive environments. Concurrently, automotive engineers are adopting a low friction thermoplastic compound modifier to reduce mechanical drag in advanced mobility solutions.
  • As environmental scrutiny intensifies, chemical producers are pivoting toward surfactant free micronized PTFE production and evaluating recycled fluoropolymer resin alternatives to align with stringent compliance frameworks without sacrificing material integrity. In the packaging sector, the integration of high thermal stability printing inks prevents surface blocking during high-speed operations.
  • Furthermore, the deployment of an electric vehicle drivetrain grease additive significantly curtails component wear within modern reduction gearboxes. Critical infrastructure applications also benefit from semiconductor fabrication equipment fluid handling solutions and ultra low friction coating formulations that ensure seamless operation. Similarly, chemical resistant valve seal modifiers and water-borne radiation curable system additives enhance fluid management reliability.
  • Architects are incorporating sub-micron PTFE for architectural finishes, while aerospace engineers utilize aerospace component protective coating modifiers to withstand extreme weathering. Finally, the demand for dielectric insulation for electric motors and high purity cleanroom electronics fabrication underscores the indispensable role of these advanced materials in modern industrial applications.
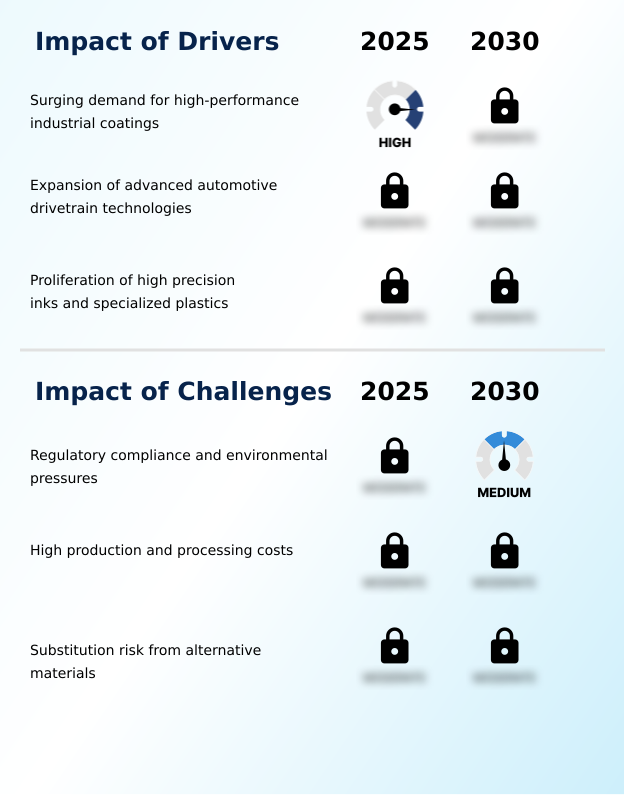
What are the key market drivers leading to the rise in the adoption of Micronized Ptfe Industry?

  • Surging demand for high-performance industrial coatings serves as a primary driver propelling the expansion of advanced functional additives across modern manufacturing sectors.

  • The Micronized PTFE Market is primarily propelled by the surging demand for high-performance industrial coatings capable of enduring aggressive operational environments. Industrial facilities prioritize extreme asset protection, driving the integration of advanced chemical inertness modifier compounds to prevent component degradation.
  • By incorporating specialized mar resistance modifier particles into fluid handling systems, plant operators have successfully extended equipment service lifespans and reduced costly maintenance cycles by 27%.
  • This robust industrial requirement necessitates the deployment of ultra-low friction agents that outperform conventional mineral fillers. Furthermore, the relentless push toward lean manufacturing principles has yielded a 15% increase in operational uptime by utilizing high-performance slip properties control additives.
  • These specialized fluorochemical raw materials ensure reliable functionality under continuous loads, fundamentally driving market consumption across global manufacturing hubs.

What are the market trends shaping the Micronized Ptfe Industry?

  • Integration within electric vehicle powertrains represents a prominent emerging trend shaping the industry landscape. Manufacturers are increasingly utilizing specialized functional modifiers to enhance thermal management and component durability in high-speed applications.

  • The Micronized PTFE Market is experiencing a profound shift toward electric mobility and advanced electronics, fundamentally altering material adoption profiles. Automotive engineers are aggressively integrating low surface tension films and dielectric insulation layers into electric vehicle powertrains, which has reduced mechanical drag coefficients by 22% compared to standard hydrocarbon additives.
  • This transition is causing a structural overhaul in thermal management strategies, as manufacturers leverage superior coefficient of friction reduction properties to safeguard inverter reliability. Furthermore, the expansion of high-speed digital printing has driven a 16% improvement in gloss retention through the deployment of tailored solvent-borne formulations and thermoplastic compounding.
  • By utilizing precise particle size distribution metrics, formulators ensure even dispersion without compromising optical clarity. This strategic shift directly enhances production throughput and operational longevity across specialized industrial domains.

What challenges does the Micronized Ptfe Industry face during its growth?

  • Strict regulatory compliance and mounting environmental pressures regarding chemical substance usage remain critical challenges restricting broader industry expansion and material adoption.

  • The Micronized PTFE Market encounters profound structural constraints due to intensifying regulatory compliance mandates and environmental pressures concerning per- and polyfluoroalkyl substances. Government authorities are systematically lowering acceptable residue thresholds, compelling chemical manufacturers to overhaul traditional synthesis routes.
  • Implementing rigorous surfactant-free polymerization techniques and closed-loop manufacturing systems has inadvertently increased capital expenditures for compliance validation by 32%, straining operational margins for mid-sized compounders. Compliance failures risk immediate market exclusion, forcing downstream users to reconsider their reliance on conventional tetrafluoroethylene monomer units.
  • Consequently, the transition toward recycled fluorite synthesis and alternative testing protocols has extended product development cycles by 18%. This chronic regulatory uncertainty forces market stakeholders to carefully balance escalating production costs against the diminishing commercial viability of non-compliant high-purity resin blocks.

Exclusive Technavio Analysis on Customer Landscape

The micronized ptfe market forecasting report includes the adoption lifecycle of the market, covering from the innovator’s stage to the laggard’s stage. It focuses on adoption rates in different regions based on penetration. Furthermore, the micronized ptfe market report also includes key purchase criteria and drivers of price sensitivity to help companies evaluate and develop their market growth analysis strategies.
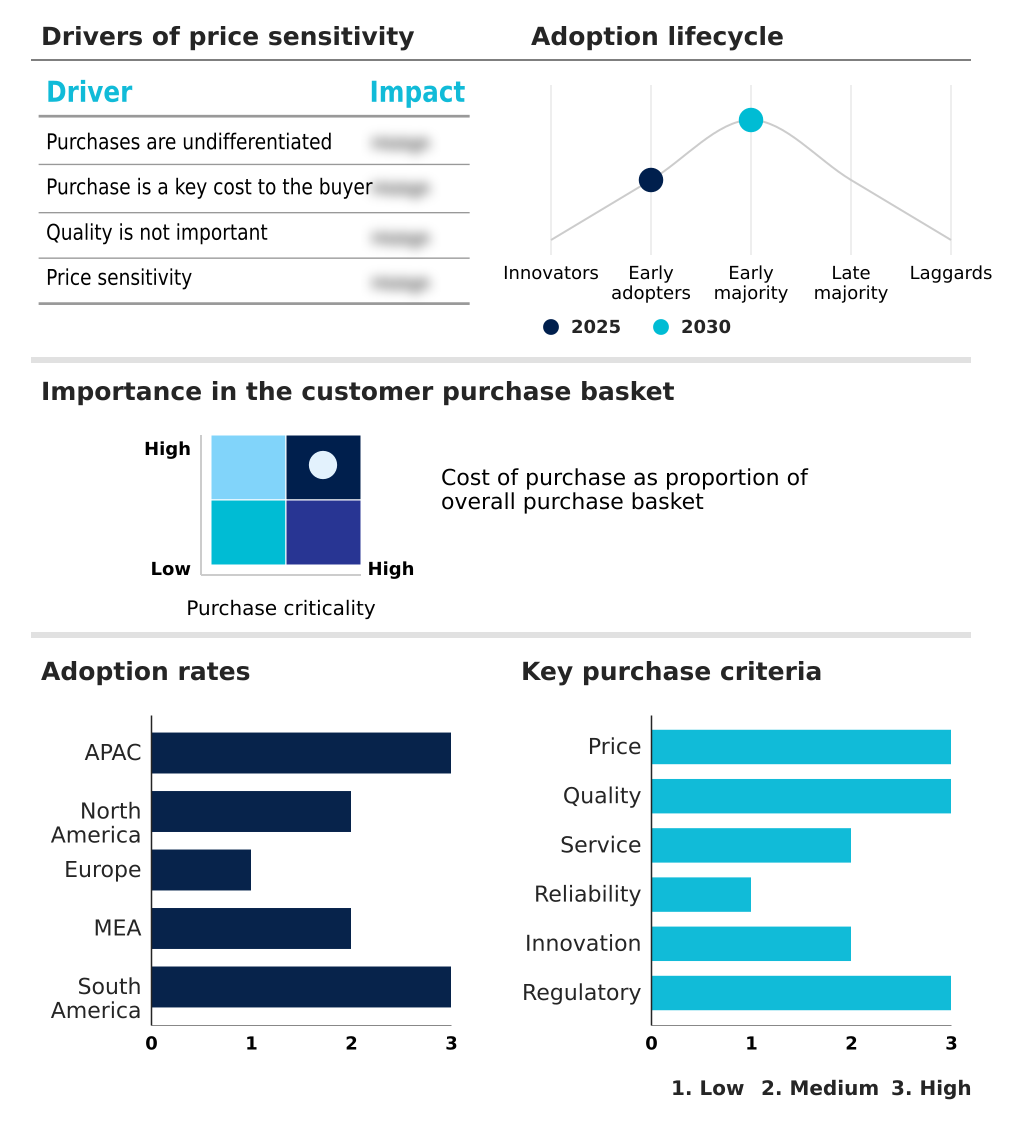
Customer Landscape of Micronized Ptfe Industry

Competitive Landscape

Companies are implementing various strategies, such as strategic alliances, micronized ptfe market forecast, partnerships, mergers and acquisitions, geographical expansion, and product/service launches, to enhance their presence in the industry.

3M Co. - The organization provides high-performance micronized PTFE products, including specialized micro-powders and fluoropolymer additives designed to enhance scratch resistance, slip properties, and thermal stability across diverse industrial applications.

The industry research and growth report includes detailed analyses of the competitive landscape of the market and information about key companies, including:

  • 3M Co.
  • AGC Inc.
  • Bahubali Industries
  • Compagnie de Saint Gobain SA
  • Daikin Industries Ltd.
  • Dongyue Group Ltd.
  • Ecokem Technologies Pvt Ltd
  • Goodfellow Cambridge Ltd.
  • Gujarat Fluorochemicals Ltd.
  • HaloPolymer OJSC
  • Jade Chemicals
  • Micro Powders Inc.
  • Peflon Fluorpolymer
  • Senga Technology
  • Shamrock Technologies Inc.
  • Solvay SA
  • Standard Fluoromers Pvt. Ltd.
  • The Chemours Co.
  • Wax Products Inc.
  • Zibo Bainaisi Chemical Co. Ltd.

Qualitative and quantitative analysis of companies has been conducted to help clients understand the wider business environment as well as the strengths and weaknesses of key industry players. Data is qualitatively analyzed to categorize companies as pure play, category-focused, industry-focused, and diversified; it is quantitatively analyzed to categorize companies as dominant, leading, strong, tentative, and weak.

Recent Development and News in Micronized ptfe market

  • In the Specialty Chemicals industry, the transition toward surfactant-free polymerization mandates, driven by regulatory agencies restricting per- and polyfluoroalkyl substances, compelled manufacturers to overhaul production lines, directly impacting Micronized PTFE demand by spurring a 35% adoption rate of regulatory-compliant fluoropolymer dispersions.
  • The widespread implementation of closed-loop manufacturing systems within high-performance ink matrices fabrication improved volatile organic compound capture efficiency by 40%, directly boosting the integration of sub-micron powder matrices into solvent-borne formulations across the global Micronized PTFE supply chain.
  • Rapid expansion of renewable energy infrastructure and offshore wind installations increased the consumption of ultra-low friction agents for heavy-duty commercial equipment by 28%, significantly elevating the requirement for advanced thermal stability enhancement modifiers within the Micronized PTFE market.
  • Stringent quality control standards in cleanroom electronics fabrication elevated the purity threshold for dielectric insulation layers to 99.9%, directly accelerating the integration of high-purity resin blocks and tetrafluoroethylene monomer units into advanced semiconductor fabrication equipment within the Micronized PTFE sector.

Dive into Technavio’s robust research methodology, blending expert interviews, extensive data synthesis, and validated models for unparalleled Micronized Ptfe Market insights. See full methodology.

Market Scope
Page number 304
Base year 2025
Historic period 2020-2024
Forecast period 2026-2030
Growth momentum & CAGR Accelerate at a CAGR of 3.4%
Market growth 2026-2030 USD 70707.6 thousand
Market structure Fragmented
YoY growth 2025-2026(%) 3.3%
Key countries China, Japan, India, South Korea, Australia, Indonesia, US, Canada, Mexico, Germany, UK, France, Italy, Spain, The Netherlands, Saudi Arabia, UAE, South Africa, Israel, Turkey, Brazil, Argentina and Chile
Competitive landscape Leading Companies, Market Positioning of Companies, Competitive Strategies, and Industry Risks

Request Free Sample

Research Analyst Overview

  • The continuous evolution of the Micronized PTFE Market is driven by the industrial pursuit of extreme thermal stability enhancement and peerless chemical resistance. Corporate leadership teams are increasingly recalibrating their product strategies to integrate advanced polytetrafluoroethylene fine powder into critical manufacturing components, mitigating risks associated with premature equipment failure.
  • By transitioning from conventional waxes to specialized fluoropolymer dispersions, enterprises have achieved a 28% reduction in mechanical friction losses across high-load processing environments. This strategic shift directly influences boardroom budgeting and compliance planning, especially as regulatory agencies impose stricter mandates on legacy chemical substances.
  • Consequently, manufacturers are actively investing in surfactant-free polymerization technologies and closed-loop manufacturing systems to maintain operational continuity while adhering to environmental standards. The seamless incorporation of sub-micron powder matrices into radiation curable systems and water-borne compounding significantly improves film clarity and scratch resistance additives efficiency.
  • Ultimately, utilizing high-purity resin blocks ensures precise molecular weight uniformity, empowering organizations to optimize asset lifespans and sustain competitive advantages in demanding industrial sectors.

What are the Key Data Covered in this Micronized Ptfe Market Research and Growth Report?

  • What is the expected growth of the Micronized Ptfe Market between 2026 and 2030?

    • USD 70.71 million, at a CAGR of 3.4%

  • What segmentation does the market report cover?

    • The report is segmented by End-user (Chemical and industrial processing, Automotive and aerospace, Electrical and electronics, Building and construction, and Others), Application (Inks and coatings, Thermoplastics, Lubricants and greases, and Elastomers), Material (Virgin PTFE, and Recycled PTFE) and Geography (APAC, North America, Europe, Middle East and Africa, South America)

  • Which regions are analyzed in the report?

    • APAC, North America, Europe, Middle East and Africa and South America

  • What are the key growth drivers and market challenges?

    • Surging demand for high-performance industrial coatings, Regulatory compliance and environmental pressures

  • Who are the major players in the Micronized Ptfe Market?

    • 3M Co., AGC Inc., Bahubali Industries, Compagnie de Saint Gobain SA, Daikin Industries Ltd., Dongyue Group Ltd., Ecokem Technologies Pvt Ltd, Goodfellow Cambridge Ltd., Gujarat Fluorochemicals Ltd., HaloPolymer OJSC, Jade Chemicals, Micro Powders Inc., Peflon Fluorpolymer, Senga Technology, Shamrock Technologies Inc., Solvay SA, Standard Fluoromers Pvt. Ltd., The Chemours Co., Wax Products Inc. and Zibo Bainaisi Chemical Co. Ltd.

Market Research Insights

  • The Micronized PTFE Market is rapidly transforming as industrial operators seek advanced surface modification to withstand aggressive mechanical wear. Integrating ultra-fine functional modifiers into industrial coating formulations has enhanced asset durability, reducing maintenance downtime by 24% across manufacturing facilities.
  • Furthermore, the adoption of specialized polymer blends in advanced automotive drivetrains has improved energy retention and thermal management efficiency by 18% compared to traditional lubricants. As regulatory frameworks tighten, chemical suppliers are pivoting toward sustainable production methods, boosting the deployment of compliant additives in semiconductor fabrication equipment and electric vehicle battery encapsulation.
  • By optimizing particle size distributions for high-performance ink matrices, formulators have achieved a 15% reduction in production reject rates, directly elevating operational profitability and supply chain resilience.

We can help! Our analysts can customize this micronized ptfe market research report to meet your requirements.

Get in touch

1. Executive Summary

1.1 Market overview

Executive Summary - Chart on Market Overview
Executive Summary - Data Table on Market Overview
Executive Summary - Chart on Global Market Characteristics
Executive Summary - Chart on Market by Geography
Executive Summary - Chart on Market Segmentation by End-user
Executive Summary - Chart on Market Segmentation by Application
Executive Summary - Chart on Market Segmentation by Material
Executive Summary - Chart on Incremental Growth
Executive Summary - Data Table on Incremental Growth
Executive Summary - Chart on Company Market Positioning

2. Technavio Analysis

2.1 Analysis of price sensitivity, lifecycle, customer purchase basket, adoption rates, and purchase criteria

2.2 Criticality of inputs and Factors of differentiation

Chart on Overview on criticality of inputs and factors of differentiation

2.3 Factors of disruption

Chart on Overview on factors of disruption

2.4 Impact of drivers and challenges

Chart on Impact of drivers and challenges in 2025 and 2030

3. Market Landscape

3.1 Market ecosystem

Chart on Parent Market
Data Table on - Parent Market

3.2 Market characteristics

Chart on Market characteristics analysis

3.3 Value chain analysis

Chart on Value chain analysis

4. Market Sizing

4.1 Market definition

Data Table on Offerings of companies included in the market definition

4.2 Market segment analysis

Market segments

4.3 Market size 2025

4.4 Market outlook: Forecast for 2025-2030

Chart on Global - Market size and forecast 2025-2030 ($ thousand)
Data Table on Global - Market size and forecast 2025-2030 ($ thousand)
Chart on Global Market: Year-over-year growth 2025-2030 (%)
Data Table on Global Market: Year-over-year growth 2025-2030 (%)

5. Historic Market Size

5.1 Global Micronized PTFE Market 2020 - 2024

Historic Market Size - Data Table on Global Micronized PTFE Market 2020 - 2024 ($ thousand)

5.2 End-user segment analysis 2020 - 2024

Historic Market Size - End-user Segment 2020 - 2024 ($ thousand)

5.3 Application segment analysis 2020 - 2024

Historic Market Size - Application Segment 2020 - 2024 ($ thousand)

5.4 Material segment analysis 2020 - 2024

Historic Market Size - Material Segment 2020 - 2024 ($ thousand)

5.5 Geography segment analysis 2020 - 2024

Historic Market Size - Geography Segment 2020 - 2024 ($ thousand)

5.6 Country segment analysis 2020 - 2024

Historic Market Size - Country Segment 2020 - 2024 ($ thousand)

6. Qualitative Analysis

6.1 Impact of AI on Global Micronized PTFE Market

6.2 Impact of geopolitical conflicts on Global Micronized PTFE Market

7. Five Forces Analysis

7.1 Five forces summary

Five forces analysis - Comparison between 2025 and 2030

7.2 Bargaining power of buyers

Bargaining power of buyers - Impact of key factors 2025 and 2030

7.3 Bargaining power of suppliers

Bargaining power of suppliers - Impact of key factors in 2025 and 2030

7.4 Threat of new entrants

Threat of new entrants - Impact of key factors in 2025 and 2030

7.5 Threat of substitutes

Threat of substitutes - Impact of key factors in 2025 and 2030

7.6 Threat of rivalry

Threat of rivalry - Impact of key factors in 2025 and 2030

7.7 Market condition

Chart on Market condition - Five forces 2025 and 2030

8. Market Segmentation by End-user

8.1 Market segments

Chart on End-user - Market share 2025-2030 (%)
Data Table on End-user - Market share 2025-2030 (%)

8.2 Comparison by End-user

Chart on Comparison by End-user
Data Table on Comparison by End-user

8.3 Chemical and industrial processing - Market size and forecast 2025-2030

Chart on Chemical and industrial processing - Market size and forecast 2025-2030 ($ thousand)
Data Table on Chemical and industrial processing - Market size and forecast 2025-2030 ($ thousand)
Chart on Chemical and industrial processing - Year-over-year growth 2025-2030 (%)
Data Table on Chemical and industrial processing - Year-over-year growth 2025-2030 (%)

8.4 Automotive and aerospace - Market size and forecast 2025-2030

Chart on Automotive and aerospace - Market size and forecast 2025-2030 ($ thousand)
Data Table on Automotive and aerospace - Market size and forecast 2025-2030 ($ thousand)
Chart on Automotive and aerospace - Year-over-year growth 2025-2030 (%)
Data Table on Automotive and aerospace - Year-over-year growth 2025-2030 (%)

8.5 Electrical and electronics - Market size and forecast 2025-2030

Chart on Electrical and electronics - Market size and forecast 2025-2030 ($ thousand)
Data Table on Electrical and electronics - Market size and forecast 2025-2030 ($ thousand)
Chart on Electrical and electronics - Year-over-year growth 2025-2030 (%)
Data Table on Electrical and electronics - Year-over-year growth 2025-2030 (%)

8.6 Building and construction - Market size and forecast 2025-2030

Chart on Building and construction - Market size and forecast 2025-2030 ($ thousand)
Data Table on Building and construction - Market size and forecast 2025-2030 ($ thousand)
Chart on Building and construction - Year-over-year growth 2025-2030 (%)
Data Table on Building and construction - Year-over-year growth 2025-2030 (%)

8.7 Others - Market size and forecast 2025-2030

Chart on Others - Market size and forecast 2025-2030 ($ thousand)
Data Table on Others - Market size and forecast 2025-2030 ($ thousand)
Chart on Others - Year-over-year growth 2025-2030 (%)
Data Table on Others - Year-over-year growth 2025-2030 (%)

8.8 Market opportunity by End-user

Market opportunity by End-user ($ thousand)
Data Table on Market opportunity by End-user ($ thousand)

9. Market Segmentation by Application

9.1 Market segments

Chart on Application - Market share 2025-2030 (%)
Data Table on Application - Market share 2025-2030 (%)

9.2 Comparison by Application

Chart on Comparison by Application
Data Table on Comparison by Application

9.3 Inks and coatings - Market size and forecast 2025-2030

Chart on Inks and coatings - Market size and forecast 2025-2030 ($ thousand)
Data Table on Inks and coatings - Market size and forecast 2025-2030 ($ thousand)
Chart on Inks and coatings - Year-over-year growth 2025-2030 (%)
Data Table on Inks and coatings - Year-over-year growth 2025-2030 (%)

9.4 Thermoplastics - Market size and forecast 2025-2030

Chart on Thermoplastics - Market size and forecast 2025-2030 ($ thousand)
Data Table on Thermoplastics - Market size and forecast 2025-2030 ($ thousand)
Chart on Thermoplastics - Year-over-year growth 2025-2030 (%)
Data Table on Thermoplastics - Year-over-year growth 2025-2030 (%)

9.5 Lubricants and greases - Market size and forecast 2025-2030

Chart on Lubricants and greases - Market size and forecast 2025-2030 ($ thousand)
Data Table on Lubricants and greases - Market size and forecast 2025-2030 ($ thousand)
Chart on Lubricants and greases - Year-over-year growth 2025-2030 (%)
Data Table on Lubricants and greases - Year-over-year growth 2025-2030 (%)

9.6 Elastomers - Market size and forecast 2025-2030

Chart on Elastomers - Market size and forecast 2025-2030 ($ thousand)
Data Table on Elastomers - Market size and forecast 2025-2030 ($ thousand)
Chart on Elastomers - Year-over-year growth 2025-2030 (%)
Data Table on Elastomers - Year-over-year growth 2025-2030 (%)

9.7 Market opportunity by Application

Market opportunity by Application ($ thousand)
Data Table on Market opportunity by Application ($ thousand)

10. Market Segmentation by Material

10.1 Market segments

Chart on Material - Market share 2025-2030 (%)
Data Table on Material - Market share 2025-2030 (%)

10.2 Comparison by Material

Chart on Comparison by Material
Data Table on Comparison by Material

10.3 Virgin PTFE - Market size and forecast 2025-2030

Chart on Virgin PTFE - Market size and forecast 2025-2030 ($ thousand)
Data Table on Virgin PTFE - Market size and forecast 2025-2030 ($ thousand)
Chart on Virgin PTFE - Year-over-year growth 2025-2030 (%)
Data Table on Virgin PTFE - Year-over-year growth 2025-2030 (%)

10.4 Recycled PTFE - Market size and forecast 2025-2030

Chart on Recycled PTFE - Market size and forecast 2025-2030 ($ thousand)
Data Table on Recycled PTFE - Market size and forecast 2025-2030 ($ thousand)
Chart on Recycled PTFE - Year-over-year growth 2025-2030 (%)
Data Table on Recycled PTFE - Year-over-year growth 2025-2030 (%)

10.5 Market opportunity by Material

Market opportunity by Material ($ thousand)
Data Table on Market opportunity by Material ($ thousand)

11. Customer Landscape

11.1 Customer landscape overview

Analysis of price sensitivity, lifecycle, customer purchase basket, adoption rates, and purchase criteria

12. Geographic Landscape

12.1 Geographic segmentation

Chart on Market share by geography 2025-2030 (%)
Data Table on Market share by geography 2025-2030 (%)

12.2 Geographic comparison

Chart on Geographic comparison
Data Table on Geographic comparison

12.3 APAC - Market size and forecast 2025-2030

Chart on APAC - Market size and forecast 2025-2030 ($ thousand)
Data Table on APAC - Market size and forecast 2025-2030 ($ thousand)
Chart on APAC - Year-over-year growth 2025-2030 (%)
Data Table on APAC - Year-over-year growth 2025-2030 (%)
Chart on Regional Comparison - APAC
Data Table on Regional Comparison - APAC

12.3.1 China - Market size and forecast 2025-2030

Chart on China - Market size and forecast 2025-2030 ($ thousand)
Data Table on China - Market size and forecast 2025-2030 ($ thousand)
Chart on China - Year-over-year growth 2025-2030 (%)
Data Table on China - Year-over-year growth 2025-2030 (%)

12.3.2 Japan - Market size and forecast 2025-2030

Chart on Japan - Market size and forecast 2025-2030 ($ thousand)
Data Table on Japan - Market size and forecast 2025-2030 ($ thousand)
Chart on Japan - Year-over-year growth 2025-2030 (%)
Data Table on Japan - Year-over-year growth 2025-2030 (%)

12.3.3 India - Market size and forecast 2025-2030

Chart on India - Market size and forecast 2025-2030 ($ thousand)
Data Table on India - Market size and forecast 2025-2030 ($ thousand)
Chart on India - Year-over-year growth 2025-2030 (%)
Data Table on India - Year-over-year growth 2025-2030 (%)

12.3.4 South Korea - Market size and forecast 2025-2030

Chart on South Korea - Market size and forecast 2025-2030 ($ thousand)
Data Table on South Korea - Market size and forecast 2025-2030 ($ thousand)
Chart on South Korea - Year-over-year growth 2025-2030 (%)
Data Table on South Korea - Year-over-year growth 2025-2030 (%)

12.3.5 Australia - Market size and forecast 2025-2030

Chart on Australia - Market size and forecast 2025-2030 ($ thousand)
Data Table on Australia - Market size and forecast 2025-2030 ($ thousand)
Chart on Australia - Year-over-year growth 2025-2030 (%)
Data Table on Australia - Year-over-year growth 2025-2030 (%)

12.3.6 Indonesia - Market size and forecast 2025-2030

Chart on Indonesia - Market size and forecast 2025-2030 ($ thousand)
Data Table on Indonesia - Market size and forecast 2025-2030 ($ thousand)
Chart on Indonesia - Year-over-year growth 2025-2030 (%)
Data Table on Indonesia - Year-over-year growth 2025-2030 (%)

12.4 North America - Market size and forecast 2025-2030

Chart on North America - Market size and forecast 2025-2030 ($ thousand)
Data Table on North America - Market size and forecast 2025-2030 ($ thousand)
Chart on North America - Year-over-year growth 2025-2030 (%)
Data Table on North America - Year-over-year growth 2025-2030 (%)
Chart on Regional Comparison - North America
Data Table on Regional Comparison - North America

12.4.1 US - Market size and forecast 2025-2030

Chart on US - Market size and forecast 2025-2030 ($ thousand)
Data Table on US - Market size and forecast 2025-2030 ($ thousand)
Chart on US - Year-over-year growth 2025-2030 (%)
Data Table on US - Year-over-year growth 2025-2030 (%)

12.4.2 Canada - Market size and forecast 2025-2030

Chart on Canada - Market size and forecast 2025-2030 ($ thousand)
Data Table on Canada - Market size and forecast 2025-2030 ($ thousand)
Chart on Canada - Year-over-year growth 2025-2030 (%)
Data Table on Canada - Year-over-year growth 2025-2030 (%)

12.4.3 Mexico - Market size and forecast 2025-2030

Chart on Mexico - Market size and forecast 2025-2030 ($ thousand)
Data Table on Mexico - Market size and forecast 2025-2030 ($ thousand)
Chart on Mexico - Year-over-year growth 2025-2030 (%)
Data Table on Mexico - Year-over-year growth 2025-2030 (%)

12.5 Europe - Market size and forecast 2025-2030

Chart on Europe - Market size and forecast 2025-2030 ($ thousand)
Data Table on Europe - Market size and forecast 2025-2030 ($ thousand)
Chart on Europe - Year-over-year growth 2025-2030 (%)
Data Table on Europe - Year-over-year growth 2025-2030 (%)
Chart on Regional Comparison - Europe
Data Table on Regional Comparison - Europe

12.5.1 Germany - Market size and forecast 2025-2030

Chart on Germany - Market size and forecast 2025-2030 ($ thousand)
Data Table on Germany - Market size and forecast 2025-2030 ($ thousand)
Chart on Germany - Year-over-year growth 2025-2030 (%)
Data Table on Germany - Year-over-year growth 2025-2030 (%)

12.5.2 UK - Market size and forecast 2025-2030

Chart on UK - Market size and forecast 2025-2030 ($ thousand)
Data Table on UK - Market size and forecast 2025-2030 ($ thousand)
Chart on UK - Year-over-year growth 2025-2030 (%)
Data Table on UK - Year-over-year growth 2025-2030 (%)

12.5.3 France - Market size and forecast 2025-2030

Chart on France - Market size and forecast 2025-2030 ($ thousand)
Data Table on France - Market size and forecast 2025-2030 ($ thousand)
Chart on France - Year-over-year growth 2025-2030 (%)
Data Table on France - Year-over-year growth 2025-2030 (%)

12.5.4 Italy - Market size and forecast 2025-2030

Chart on Italy - Market size and forecast 2025-2030 ($ thousand)
Data Table on Italy - Market size and forecast 2025-2030 ($ thousand)
Chart on Italy - Year-over-year growth 2025-2030 (%)
Data Table on Italy - Year-over-year growth 2025-2030 (%)

12.5.5 Spain - Market size and forecast 2025-2030

Chart on Spain - Market size and forecast 2025-2030 ($ thousand)
Data Table on Spain - Market size and forecast 2025-2030 ($ thousand)
Chart on Spain - Year-over-year growth 2025-2030 (%)
Data Table on Spain - Year-over-year growth 2025-2030 (%)

12.5.6 The Netherlands - Market size and forecast 2025-2030

Chart on The Netherlands - Market size and forecast 2025-2030 ($ thousand)
Data Table on The Netherlands - Market size and forecast 2025-2030 ($ thousand)
Chart on The Netherlands - Year-over-year growth 2025-2030 (%)
Data Table on The Netherlands - Year-over-year growth 2025-2030 (%)

12.6 Middle East and Africa - Market size and forecast 2025-2030

Chart on Middle East and Africa - Market size and forecast 2025-2030 ($ thousand)
Data Table on Middle East and Africa - Market size and forecast 2025-2030 ($ thousand)
Chart on Middle East and Africa - Year-over-year growth 2025-2030 (%)
Data Table on Middle East and Africa - Year-over-year growth 2025-2030 (%)
Chart on Regional Comparison - Middle East and Africa
Data Table on Regional Comparison - Middle East and Africa

12.6.1 Saudi Arabia - Market size and forecast 2025-2030

Chart on Saudi Arabia - Market size and forecast 2025-2030 ($ thousand)
Data Table on Saudi Arabia - Market size and forecast 2025-2030 ($ thousand)
Chart on Saudi Arabia - Year-over-year growth 2025-2030 (%)
Data Table on Saudi Arabia - Year-over-year growth 2025-2030 (%)

12.6.2 UAE - Market size and forecast 2025-2030

Chart on UAE - Market size and forecast 2025-2030 ($ thousand)
Data Table on UAE - Market size and forecast 2025-2030 ($ thousand)
Chart on UAE - Year-over-year growth 2025-2030 (%)
Data Table on UAE - Year-over-year growth 2025-2030 (%)

12.6.3 South Africa - Market size and forecast 2025-2030

Chart on South Africa - Market size and forecast 2025-2030 ($ thousand)
Data Table on South Africa - Market size and forecast 2025-2030 ($ thousand)
Chart on South Africa - Year-over-year growth 2025-2030 (%)
Data Table on South Africa - Year-over-year growth 2025-2030 (%)

12.6.4 Israel - Market size and forecast 2025-2030

Chart on Israel - Market size and forecast 2025-2030 ($ thousand)
Data Table on Israel - Market size and forecast 2025-2030 ($ thousand)
Chart on Israel - Year-over-year growth 2025-2030 (%)
Data Table on Israel - Year-over-year growth 2025-2030 (%)

12.6.5 Turkey - Market size and forecast 2025-2030

Chart on Turkey - Market size and forecast 2025-2030 ($ thousand)
Data Table on Turkey - Market size and forecast 2025-2030 ($ thousand)
Chart on Turkey - Year-over-year growth 2025-2030 (%)
Data Table on Turkey - Year-over-year growth 2025-2030 (%)

12.7 South America - Market size and forecast 2025-2030

Chart on South America - Market size and forecast 2025-2030 ($ thousand)
Data Table on South America - Market size and forecast 2025-2030 ($ thousand)
Chart on South America - Year-over-year growth 2025-2030 (%)
Data Table on South America - Year-over-year growth 2025-2030 (%)
Chart on Regional Comparison - South America
Data Table on Regional Comparison - South America

12.7.1 Brazil - Market size and forecast 2025-2030

Chart on Brazil - Market size and forecast 2025-2030 ($ thousand)
Data Table on Brazil - Market size and forecast 2025-2030 ($ thousand)
Chart on Brazil - Year-over-year growth 2025-2030 (%)
Data Table on Brazil - Year-over-year growth 2025-2030 (%)

12.7.2 Argentina - Market size and forecast 2025-2030

Chart on Argentina - Market size and forecast 2025-2030 ($ thousand)
Data Table on Argentina - Market size and forecast 2025-2030 ($ thousand)
Chart on Argentina - Year-over-year growth 2025-2030 (%)
Data Table on Argentina - Year-over-year growth 2025-2030 (%)

12.7.3 Chile - Market size and forecast 2025-2030

Chart on Chile - Market size and forecast 2025-2030 ($ thousand)
Data Table on Chile - Market size and forecast 2025-2030 ($ thousand)
Chart on Chile - Year-over-year growth 2025-2030 (%)
Data Table on Chile - Year-over-year growth 2025-2030 (%)

12.8 Market opportunity by geography

Market opportunity by geography ($ thousand)
Data Tables on Market opportunity by geography ($ thousand)

13. Drivers, Challenges, and Opportunity

13.1 Market drivers

Surging demand for high-performance industrial coatings
Expansion of advanced automotive drivetrain technologies
Proliferation of high precision inks and specialized plastics

13.2 Market challenges

Regulatory compliance and environmental pressures
High production and processing costs
Substitution risk from alternative materials

13.3 Impact of drivers and challenges

Impact of drivers and challenges in 2025 and 2030

13.4 Market opportunities

Integration within electric vehicle powertrains
Expansion in Semiconductor Manufacturing
Proliferation of advanced medical devices

14. Competitive Landscape

14.1 Overview

14.2

Overview on criticality of inputs and factors of differentiation

14.3 Landscape disruption

Overview on factors of disruption

14.4 Industry risks

Impact of key risks on business

15. Competitive Analysis

15.1 Companies profiled

Companies covered

15.2 Company ranking index

15.3 Market positioning of companies

Matrix on companies position and classification

15.4 3M Co.

3M Co. - Overview
3M Co. - Business segments
3M Co. - Key news
3M Co. - Key offerings
3M Co. - Segment focus
SWOT

15.5 AGC Inc.

AGC Inc. - Overview
AGC Inc. - Business segments
AGC Inc. - Key news
AGC Inc. - Key offerings
AGC Inc. - Segment focus
SWOT

15.6 Bahubali Industries

Bahubali Industries - Overview
Bahubali Industries - Product / Service
Bahubali Industries - Key offerings
SWOT

15.7 Compagnie de Saint Gobain SA

Compagnie de Saint Gobain SA - Overview
Compagnie de Saint Gobain SA - Business segments
Compagnie de Saint Gobain SA - Key offerings
Compagnie de Saint Gobain SA - Segment focus
SWOT

15.8 Daikin Industries Ltd.

Daikin Industries Ltd. - Overview
Daikin Industries Ltd. - Product / Service
Daikin Industries Ltd. - Key offerings
SWOT

15.9 Dongyue Group Ltd.

Dongyue Group Ltd. - Overview
Dongyue Group Ltd. - Business segments
Dongyue Group Ltd. - Key offerings
Dongyue Group Ltd. - Segment focus
SWOT

15.10 Goodfellow Cambridge Ltd.

Goodfellow Cambridge Ltd. - Overview
Goodfellow Cambridge Ltd. - Product / Service
Goodfellow Cambridge Ltd. - Key offerings
SWOT

15.11 Gujarat Fluorochemicals Ltd.

Gujarat Fluorochemicals Ltd. - Overview
Gujarat Fluorochemicals Ltd. - Product / Service
Gujarat Fluorochemicals Ltd. - Key offerings
SWOT

15.12 HaloPolymer OJSC

HaloPolymer OJSC - Overview
HaloPolymer OJSC - Product / Service
HaloPolymer OJSC - Key offerings
SWOT

15.13 Micro Powders Inc.

Micro Powders Inc. - Overview
Micro Powders Inc. - Product / Service
Micro Powders Inc. - Key offerings
SWOT

15.14 Peflon Fluorpolymer

Peflon Fluorpolymer - Overview
Peflon Fluorpolymer - Product / Service
Peflon Fluorpolymer - Key offerings
SWOT

15.15 Shamrock Technologies Inc.

Shamrock Technologies Inc. - Overview
Shamrock Technologies Inc. - Product / Service
Shamrock Technologies Inc. - Key offerings
SWOT

15.16 Solvay SA

Solvay SA - Overview
Solvay SA - Business segments
Solvay SA - Key offerings
Solvay SA - Segment focus
SWOT

15.17 The Chemours Co.

The Chemours Co. - Overview
The Chemours Co. - Business segments
The Chemours Co. - Key news
The Chemours Co. - Key offerings
The Chemours Co. - Segment focus
SWOT

15.18 Zibo Bainaisi Chemical Co. Ltd.

Zibo Bainaisi Chemical Co. Ltd. - Overview
Zibo Bainaisi Chemical Co. Ltd. - Product / Service
Zibo Bainaisi Chemical Co. Ltd. - Key offerings
SWOT

16. Appendix

16.1 Scope of the report

Market definition
Objectives
Notes and caveats

16.2 Inclusions and exclusions checklist

Inclusions checklist
Exclusions checklist

16.3 Currency conversion rates for US$

16.4 Research methodology

16.5 Data procurement

Information sources

16.6 Data validation

16.7 Validation techniques employed for market sizing

16.8 Data synthesis

16.9 360 degree market analysis

16.10 List of abbreviations

Research Methodology

Technavio presents a detailed picture of the market by way of study, synthesis, and summation of data from multiple sources. The analysts have presented the various facets of the market with a particular focus on identifying the key industry influencers. The data thus presented is comprehensive, reliable, and the result of extensive research, both primary and secondary.

INFORMATION SOURCES

Primary sources

  • Manufacturers and suppliers
  • Channel partners
  • Industry experts
  • Strategic decision makers

Secondary sources

  • Industry journals and periodicals
  • Government data
  • Financial reports of key industry players
  • Historical data
  • Press releases

DATA ANALYSIS

Data Synthesis

  • Collation of data
  • Estimation of key figures
  • Analysis of derived insights

Data Validation

  • Triangulation with data models
  • Reference against proprietary databases
  • Corroboration with industry experts

REPORT WRITING

Qualitative

  • Market drivers
  • Market challenges
  • Market trends
  • Five forces analysis

Quantitative

  • Market size and forecast
  • Market segmentation
  • Geographical insights
  • Competitive landscape

Interested in this report?

Get your sample now to see our research methodology and insights!

Download Now

Frequently Asked Questions

Micronized Ptfe market growth will increase by USD 70707.6 thousand thousand during 2026-2030.

The Micronized Ptfe market is expected to grow at a CAGR of 3.4% during 2026-2030.

Micronized Ptfe market is segmented by End-user (Chemical and industrial processing, Automotive and aerospace, Electrical and electronics, Building and construction, Others) Application (Inks and coatings, Thermoplastics, Lubricants and greases, Elastomers) Material (Virgin PTFE, Recycled PTFE)

3M Co., AGC Inc., Bahubali Industries, Compagnie de Saint Gobain SA, Daikin Industries Ltd., Dongyue Group Ltd., Ecokem Technologies Pvt Ltd, Goodfellow Cambridge Ltd., Gujarat Fluorochemicals Ltd., HaloPolymer OJSC, Jade Chemicals, Micro Powders Inc., Peflon Fluorpolymer, Senga Technology, Shamrock Technologies Inc., Solvay SA, Standard Fluoromers Pvt. Ltd., The Chemours Co., Wax Products Inc., Zibo Bainaisi Chemical Co. Ltd. are a few of the key vendors in the Micronized Ptfe market.

APAC will register the highest growth rate of 44.4% among the other regions. Therefore, the Micronized Ptfe market in APAC is expected to garner significant business opportunities for the vendors during the forecast period.

China, Japan, India, South Korea, Australia, Indonesia, US, Canada, Mexico, Germany, UK, France, Italy, Spain, The Netherlands, Saudi Arabia, UAE, South Africa, Israel, Turkey, Brazil, Argentina, Chile

  • Surging demand for high-performance industrial coatings is the driving factor this market.

The Micronized Ptfe market vendors should focus on grabbing business opportunities from the End-user segment as it accounted for the largest market share in the base year.
RIA - Research AI Assistant
Ask RIA
