Military Armored Vehicles And Counter-IED Vehicles Market Size 2025-2029
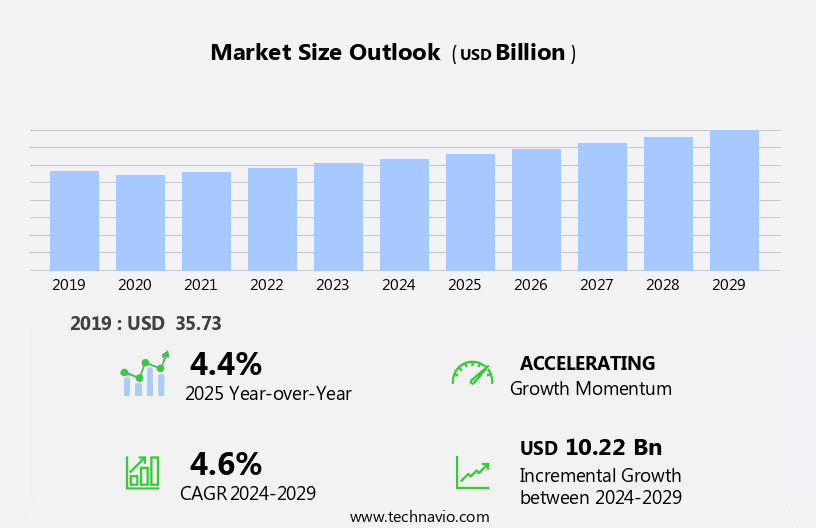
The military armored vehicles and counter-ied vehicles market size is forecast to increase by USD 10.22 billion, at a CAGR of 4.6% between 2024 and 2029.
- The market is driven by the escalating demand for armored vehicles in the context of asymmetric warfare. The need to procure advanced arsenals to counteract unconventional threats has fueled market growth. A notable trend in the market is the adoption of hybrid drivetrains in Mine-Resistant Ambush-Protected (MRAP) vehicles, enhancing their operational efficiency and survivability. However, the high research and development costs associated with the production of these vehicles pose a significant challenge to market participants. Companies must navigate this obstacle by investing in innovative technologies and collaborating with defense forces to tailor their offerings to specific requirements.
- The market's strategic landscape is shaped by the continuous pursuit of advanced protection systems and the integration of emerging technologies to address evolving threats. Companies seeking to capitalize on opportunities and navigate challenges effectively should focus on developing cost-effective, technologically advanced solutions while maintaining a strong collaboration with defense forces and governments.
What will be the Size of the Military Armored Vehicles And Counter-IED Vehicles Market during the forecast period?
Explore in-depth regional segment analysis with market size data - historical 2019-2023 and forecasts 2025-2029 - in the full report.
Request Free Sample
The military armored vehicles and counter-IED (Improvised Explosive Devices) market continues to evolve, driven by the ever-changing threat landscape and the need for advanced technology integration. Vehicle designs are constantly being upgraded to provide superior ballistic protection and blast mitigation, with cooling systems and advanced materials ensuring optimal performance in various climates and terrains. Life cycle costs remain a critical factor, with logistics support and power management playing essential roles in maintaining vehicle reliability and reducing maintenance requirements. Situational awareness is enhanced through the integration of thermal imaging, GPS tracking, and sensor fusion, providing operators with real-time data and threat assessments.
Protection levels are further bolstered by the use of composite armor, reactive armor, and underbody protection, while crew protection is ensured through advanced safety systems and operator training programs. Autonomous systems and electronic countermeasures (ECM) offer enhanced combat effectiveness and survivability, with machine learning and deep learning algorithms enabling vehicle mobility and threat assessment. Counter-IED technology, including mine detection and electronic warfare (EW), is a key focus area, with data analytics and communication systems playing crucial roles in threat assessment and response. Transmission systems and drive trains are optimized for fuel efficiency and payload capacity, while weapon systems integration ensures maximum combat readiness.
The market's continuous dynamism is further reflected in technology upgrades, supply chain management, and vehicle upgrades, with engine performance, run-flat tires, and lightweight armor ensuring optimal vehicle survivability. The integration of artificial intelligence (AI) and data encryption further enhances vehicle capabilities, providing a competitive edge in the ever-evolving military landscape.
How is this Military Armored Vehicles And Counter-IED Vehicles Industry segmented?
The military armored vehicles and counter-ied vehicles industry research report provides comprehensive data (region-wise segment analysis), with forecasts and estimates in "USD billion" for the period 2025-2029, as well as historical data from 2019-2023 for the following segments.
- Product
- Infantry fighting vehicle (IFV)
- Armored personnel carrier (APC)
- Main battle tank (MBT)
- Self-propelled howitzer (SPH)
- Others
- Mobility Type
- Wheeled
- Tracked
- Application
- National defense
- Homeland security
- Geography
- North America
- US
- Canada
- Europe
- France
- Germany
- Italy
- Russia
- APAC
- China
- India
- Japan
- Rest of World (ROW)
- North America
By Product Insights
The infantry fighting vehicle (ifv) segment is estimated to witness significant growth during the forecast period.
The armored and unarmored variants of infantry fighting vehicles (IFV) have long been essential assets for transporting troops to critical battlefield locations and delivering offensive capabilities against enemy attacks. Traditionally, IFVs prioritized mobility and firepower over protection. However, recent market trends have seen a significant shift towards integrating advanced artillery and damage-resistant armor into modern IFV designs. Superior ballistic protection, cooling systems, and situational awareness are now key features of contemporary IFVs, addressing the need for risk mitigation and crew protection. Blast mitigation and electronic warfare systems provide additional layers of defense against various threats. Mine detection and anti-mine technology ensure safe navigation through hazardous terrain, while advanced materials and armor upgrades enhance vehicle survivability.
Combat effectiveness is further boosted by electronic countermeasures, weapon systems integration, and data analytics. Logistics support, power management, and vehicle reliability are crucial considerations for minimizing life cycle costs and optimizing operational readiness. Training programs and technology upgrades ensure that operators are proficient in handling the advanced capabilities of these vehicles. Supply chain management, composite armor, and vehicle upgrades are essential elements of the market, ensuring a steady flow of high-performance components and maintaining vehicle readiness. Engine performance, run-flat tires, and lightweight armor contribute to improved vehicle mobility and survivability. Machine learning, deep learning, and artificial intelligence technologies are increasingly being integrated to enhance situational awareness and improve overall vehicle effectiveness.
Counter-IED systems, threat assessment, sensor fusion, and protection levels are critical aspects of modern IFVs, ensuring that they can adapt to evolving battlefield conditions and counteract various threats. Data encryption, drive trains, and communication systems are essential for maintaining secure and efficient vehicle operations. The market for armored and counter-IED vehicles is constantly evolving, with a focus on advanced technologies and improving vehicle capabilities to meet the demands of modern military operations.
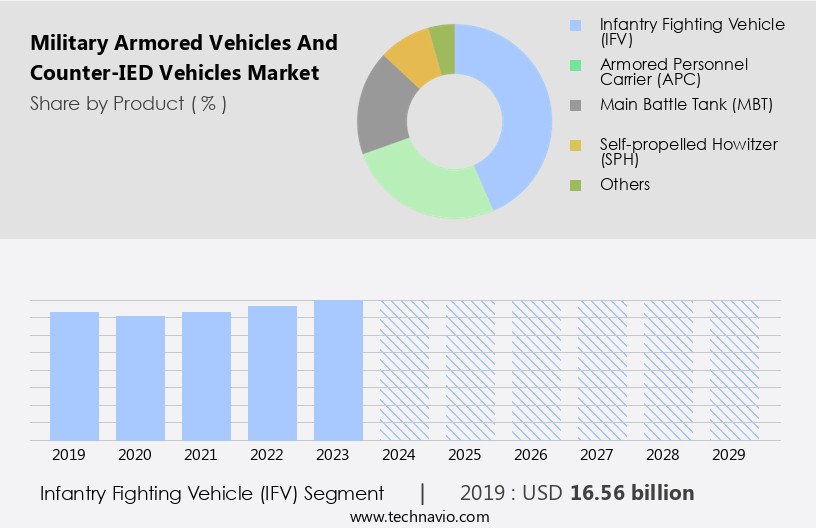
The Infantry fighting vehicle (IFV) segment was valued at USD 16.56 billion in 2019 and showed a gradual increase during the forecast period.
Regional Analysis
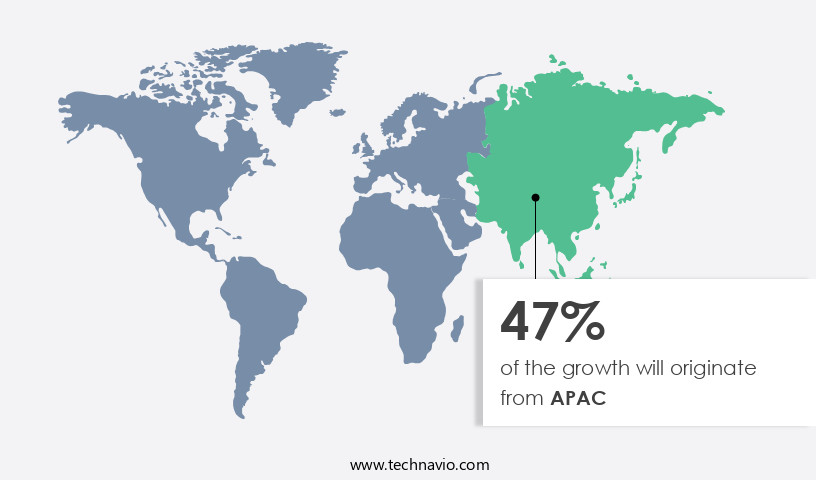
APAC is estimated to contribute 47% to the growth of the global market during the forecast period.Technavio’s analysts have elaborately explained the regional trends and drivers that shape the market during the forecast period.
The market is witnessing significant growth due to escalating geopolitical tensions and the increasing demand for advanced defense solutions. Risk mitigation and crew protection are key priorities for military forces, leading to a surge in demand for vehicles equipped with ballistic protection, cooling systems, and situational awareness technologies. Blast mitigation and electronic warfare systems, including mine detection and electronic countermeasures, are essential components of these vehicles, ensuring combat effectiveness and vehicle survivability. Advanced materials, such as composite armor and ceramic armor, are being integrated to enhance protection levels and reduce life cycle costs. Payload capacity, thermal imaging, fuel efficiency, and power management are also critical factors driving market growth.
Logistics support, armor upgrades, and suspension systems are essential for maintaining vehicle reliability and reducing maintenance requirements. Training programs and operator training are crucial for ensuring optimal use of these advanced systems. Weapon systems integration and technology upgrades are also key trends, with autonomous systems, jamming systems, and data analytics playing increasingly important roles. Supply chain management and aftermarket parts are essential for ensuring the availability and sustainability of these vehicles. In the Asia Pacific region, countries such as China, South Korea, India, and Japan are significantly contributing to market growth due to increasing defense budgets and procurement initiatives.
The need for advanced counter-IED systems and vehicle mobility solutions is particularly high in this region, with deep learning and machine learning technologies playing a vital role in enhancing threat assessment and sensor fusion capabilities. Engine performance, run-flat tires, and lightweight armor are other critical factors influencing market trends. Communication systems, data encryption, and drive trains are also essential components of these vehicles, ensuring vehicle survivability and operational efficiency. The integration of artificial intelligence and counter-IED systems is expected to further accelerate market growth in the coming years.
Market Dynamics
Our researchers analyzed the data with 2024 as the base year, along with the key drivers, trends, and challenges. A holistic analysis of drivers will help companies refine their marketing strategies to gain a competitive advantage.
What are the key market drivers leading to the rise in the adoption of Military Armored Vehicles And Counter-IED Vehicles Industry?
- Asymmetric warfare, characterized by the use of unconventional tactics and irregular combatants, drives the procurement of advanced arsenals in the market.
- Military armored vehicles and counter-IED (Improvised Explosive Device) vehicles play a crucial role in modern warfare, particularly in the context of asymmetric threats. The increasing use of unconventional tactics and weapons necessitates the development and procurement of advanced defense technologies. Asymmetric warfare, which involves exploiting an opponent's weaknesses through innovative methods, has led to the creation of hybrid defense technologies. Advanced armor upgrades, such as reactive armor and steel armor, are essential to protect against various types of threats. Data analytics, electronic countermeasures (ECM), and autonomous systems enhance combat effectiveness by providing real-time intelligence and enabling quick responses.
- Suspension systems and jamming systems ensure vehicle reliability and crew protection, while underbody protection and maintenance requirements are essential for prolonged operations. In the rapidly evolving defense landscape, training programs play a vital role in maintaining operational readiness. Military armored vehicles and counter-IED vehicles must be able to adapt to various terrains and environments, making advanced technologies such as autonomous systems increasingly important. As the threat landscape continues to evolve, it is essential for military forces to invest in the latest defense technologies to maintain a competitive edge.
What are the market trends shaping the Military Armored Vehicles And Counter-IED Vehicles Industry?
- The emergence of hybrid drivetrains is becoming a notable trend in the Military Ruggedized All-Terrain Vehicles (MRAPs) market. This technological advancement is expected to significantly impact the industry in the coming years.
- The Military Armored Vehicles and Counter-IED (Improvised Explosive Device) market is witnessing significant advancements, driven by the integration of weapon systems and anti-mine technology. Operator training and technology upgrades are crucial factors in this industry's growth. Hybrid drivetrains are gaining popularity due to their improved engine performance and vehicle mobility. These powertrains offer the benefits of both conventional engines and electric motors, enabling better maneuverability and reducing operational costs. Moreover, the development of lightweight composite armor and run-flat tires enhances vehicle survivability. Advanced technologies like machine learning and deep learning are being integrated into these vehicles to improve situational awareness and decision-making capabilities.
- The supply chain management of these complex systems requires meticulous planning and execution. Vehicle upgrades, such as blast mitigation systems and underbody protection, are essential for enhancing the survivability of military personnel. These upgrades necessitate intricate design changes and the elimination of various automotive components. The next generation of armored vehicles is expected to be more agile, survivable, and cost-effective, making them invaluable assets for military operations.
What challenges does the Military Armored Vehicles And Counter-IED Vehicles Industry face during its growth?
- The significant expenses incurred during research and development represent a major challenge impeding the industry's growth trajectory.
- Military armored vehicles and counter-IED systems continue to evolve, integrating advanced technologies to enhance protection and surveillance capabilities. High development costs have long been a challenge, with a single tactical Infantry Fighting Vehicle (IFV) design potentially costing billions. This has led to the adoption of existing defense technologies, sometimes at the expense of performance and reliability. To address budget constraints, governments employ creative financing strategies. Advanced technologies, such as ceramic armor, night vision, GPS tracking, and sensor fusion, are essential components of modern armored vehicles. These technologies improve threat assessment, protection levels, and situational awareness. Transmission systems, artificial intelligence (AI), and GPS tracking are critical for optimizing vehicle performance and maintenance.
- Data encryption ensures secure communication and information protection. Drive trains and suspension systems are essential for ground clearance and maneuverability. Continuous advancements in these technologies create new research opportunities, paving the way for further innovation. The integration of AI and sensor fusion in counter-IED systems significantly enhances threat detection and response capabilities. These developments are crucial for maintaining a technological edge in defense applications.
Exclusive Customer Landscape
The military armored vehicles and counter-ied vehicles market forecasting report includes the adoption lifecycle of the market, covering from the innovator’s stage to the laggard’s stage. It focuses on adoption rates in different regions based on penetration. Furthermore, the military armored vehicles and counter-ied vehicles market report also includes key purchase criteria and drivers of price sensitivity to help companies evaluate and develop their market growth analysis strategies.

Customer Landscape
Key Companies & Market Insights
Companies are implementing various strategies, such as strategic alliances, military armored vehicles and counter-ied vehicles market forecast, partnerships, mergers and acquisitions, geographical expansion, and product/service launches, to enhance their presence in the industry.
AB Volvo - The company specializes in manufacturing and supplying military-grade armored vehicles, including the VAB MK 3 and Fortress MK2 models, as well as counter IED vehicles like the Sherpa Light. These vehicles cater to the global defense industry, providing advanced protection and mobility solutions.
The industry research and growth report includes detailed analyses of the competitive landscape of the market and information about key companies, including:
- AB Volvo
- Alpine Armoring Inc.
- BAE Systems Plc
- Denel SOC Ltd.
- General Dynamics Corp.
- Hyundai Motor Co.
- International Armored Group
- KNDS N.V.
- Lockheed Martin Corp.
- Milkor Pty Ltd.
- NORINCOGROUP.com Inc.
- Northrop Grumman Corp.
- Oshkosh Corp.
- Renault SAS
- Rheinmetall AG
- Rostec
- SAUDI GROUPS
- SVI ENGINEERING
- STREIT Group
- Traton SE
Qualitative and quantitative analysis of companies has been conducted to help clients understand the wider business environment as well as the strengths and weaknesses of key industry players. Data is qualitatively analyzed to categorize companies as pure play, category-focused, industry-focused, and diversified; it is quantitatively analyzed to categorize companies as dominant, leading, strong, tentative, and weak.
Recent Development and News in Military Armored Vehicles And Counter-IED Vehicles Market
- In January 2024, BAE Systems announced the successful delivery of the first M88A2 Hercules Armored Recovery Vehicle to the U.S. Army, marking a significant milestone in their ongoing contract to modernize the U.S. Army's fleet of heavy equipment recovery vehicles (Source: BAE Systems Press Release).
- In March 2024, General Dynamics Land Systems and Raytheon Technologies signed a strategic partnership to integrate Raytheon's Counter-Remote Controlled Improvised Explosive Device (C-RCIED) system into General Dynamics' Stryker Infantry Carrier Vehicles, enhancing the vehicles' counter-IED capabilities (Source: General Dynamics Land Systems Press Release).
- In May 2024, Thales announced the successful completion of the first phase of trials for its Tactical Armored Patrol Vehicle (TAPV) in Australia, with the vehicle demonstrating superior ballistic protection and mobility (Source: Thales Press Release).
- In April 2025, Rheinmetall Defense announced the acquisition of a majority stake in Israeli defense technology company, Rada Electronic Industries, to expand its counter-IED capabilities and strengthen its position in the global military vehicle market (Source: Rheinmetall Defense Press Release).
Research Analyst Overview
- The armored vehicles and counter-IED market is characterized by the continuous evolution of technologies aimed at enhancing off-road mobility and survivability. Vehicle manufacturers focus on developing blast resistant seats, overpressure protection, and crew restraint systems to ensure operational readiness rate during combat situations. Maintenance intervals are being extended through the integration of remote diagnostics and vehicle health monitoring systems, reducing acquisition costs and downtime. Human-machine interface (HMI) and weapon platforms are also being upgraded to improve situational awareness and accuracy. Advancements in armor technology include the use of spall liners, reactive armor tiles, and underbody armor to protect against various types of threats.
- Front and side armor, roof armor, and obstacle avoidance systems are also crucial for enhancing vehicle survivability. Countermeasures systems, such as signal intelligence (SIGINT) and IED defeat mechanisms, are essential components of modern armored vehicles. Operational readiness rate is a significant factor in the market, with vehicle weight, fuel consumption, and traction control being critical considerations. Data links and networked vehicles enable real-time communication and coordination between forces, increasing overall effectiveness. Disposal costs and cost per mile are also important factors, driving the development of more efficient and cost-effective solutions. The market for armored vehicles and counter-IED technologies is dynamic, with ongoing research and development efforts focused on improving vehicle capabilities and reducing costs.
- The integration of advanced technologies, such as underbody armor, reactive armor tiles, and obstacle avoidance systems, is expected to drive growth in the market. Additionally, the increasing demand for vehicle health monitoring, traction control, and networked vehicles is expected to further boost market growth.
Dive into Technavio’s robust research methodology, blending expert interviews, extensive data synthesis, and validated models for unparalleled Military Armored Vehicles And Counter-IED Vehicles Market insights. See full methodology.
|
Market Scope |
|
|
Report Coverage |
Details |
|
Page number |
226 |
|
Base year |
2024 |
|
Historic period |
2019-2023 |
|
Forecast period |
2025-2029 |
|
Growth momentum & CAGR |
Accelerate at a CAGR of 4.6% |
|
Market growth 2025-2029 |
USD 10.22 billion |
|
Market structure |
Fragmented |
|
YoY growth 2024-2025(%) |
4.4 |
|
Key countries |
US, China, Japan, Canada, India, Saudi Arabia, Russia, France, Germany, and Italy |
|
Competitive landscape |
Leading Companies, Market Positioning of Companies, Competitive Strategies, and Industry Risks |
What are the Key Data Covered in this Military Armored Vehicles And Counter-IED Vehicles Market Research and Growth Report?
- CAGR of the Military Armored Vehicles And Counter-IED Vehicles industry during the forecast period
- Detailed information on factors that will drive the growth and forecasting between 2025 and 2029
- Precise estimation of the size of the market and its contribution of the industry in focus to the parent market
- Accurate predictions about upcoming growth and trends and changes in consumer behaviour
- Growth of the market across APAC, North America, Middle East and Africa, Europe, and South America
- Thorough analysis of the market’s competitive landscape and detailed information about companies
- Comprehensive analysis of factors that will challenge the military armored vehicles and counter-ied vehicles market growth of industry companies
We can help! Our analysts can customize this military armored vehicles and counter-ied vehicles market research report to meet your requirements.
 RIA -
RIA - 
