Military Drone Market Analysis, Size, and Forecast 2026-2030: North America (US, Canada, and Mexico), APAC (China, India, and Japan), Europe (UK, France, and Germany), Middle East and Africa (Israel, Turkey, and Saudi Arabia), South America (Brazil and Argentina), and Rest of World (ROW)

Military Drone Market Analysis, Size, and Forecast 2026-2030:
North America (US, Canada, and Mexico), APAC (China, India, and Japan), Europe (UK, France, and Germany), Middle East and Africa (Israel, Turkey, and Saudi Arabia), South America (Brazil and Argentina), and Rest of World (ROW)

Published: Mar 2026 324 Pages SKU: IRTNTR75098

Market Overview at a Glance

$12.00 B
Market Opportunity
13.6%
CAGR 2025 - 2030
33.9%
North America Growth
$8.50 B
Rotary blade segment 2024

Military Drone Market Size 2026-2030

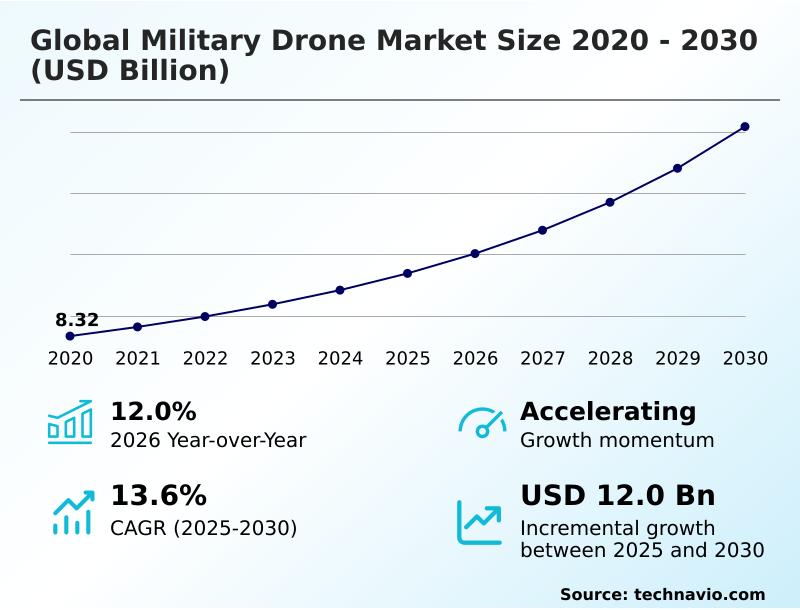
The military drone market size is valued to increase by USD 12.00 billion, at a CAGR of 13.6% from 2025 to 2030. Mainstreaming of mass and industrialization of low-cost uncrewed combat attack systems will drive the military drone market.

Major Market Trends & Insights

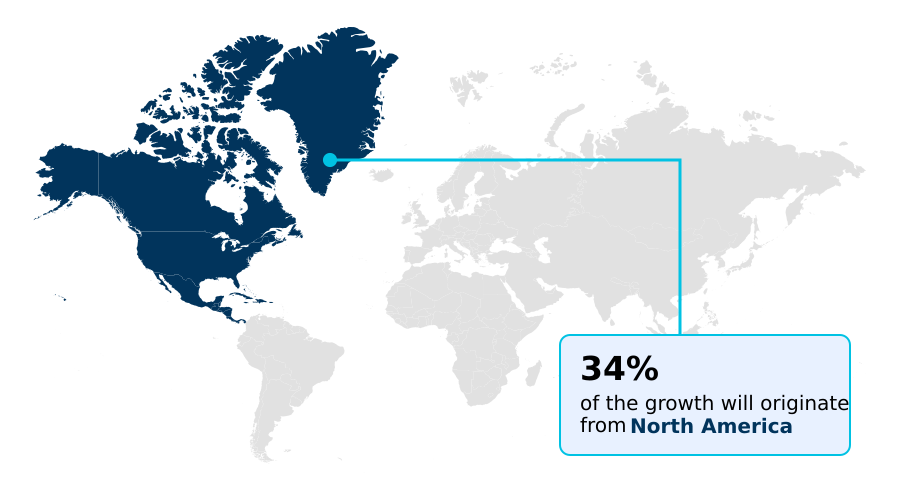
  • North America dominated the market and accounted for a 33.9% growth during the forecast period.
  • By Type - Rotary blade segment was valued at USD 8.50 billion in 2024
  • By Technology - Remotely operated segment accounted for the largest market revenue share in 2024

Market Size & Forecast

  • Market Opportunities: USD 17.14 billion
  • Market Future Opportunities: USD 12.00 billion
  • CAGR from 2025 to 2030 : 13.6%

Market Summary

  • The military drone market is undergoing a fundamental transformation, driven by the dual pressures of modernizing defense capabilities and achieving operational cost-efficiencies. This evolution is marked by a strategic pivot from large, high-cost platforms to doctrines centered on attritable mass and swarm intelligence.
  • The integration of AI-driven collaborative combat is enabling sophisticated manned-unmanned teaming (MUM-T), where autonomous loyal wingman systems function as force multipliers. For instance, a logistics command can leverage decentralized drone production and hybrid-VTOL platforms for just-in-time resupply to forward-deployed units, reducing dependence on high-risk ground convoys by over 40%.
  • However, this advancement is met with the challenge of escalating counter-UAS technologies, demanding greater electronic warfare resilience and GPS-denied navigation capabilities. Consequently, the industry is prioritizing modular open systems architecture and resilient communication networks to ensure platforms remain effective.
  • The deployment of loitering munitions and tactical unmanned aerial systems equipped with synthetic aperture radar and signals intelligence (SIGINT) payloads is becoming standard, reflecting a broader move toward multi-domain persistence and persistent situational awareness across all operational theaters.

What will be the Size of the Military Drone Market during the forecast period?

Get Key Insights on Market Forecast (PDF) Request Free Sample

How is the Military Drone Market Segmented?

The military drone industry research report provides comprehensive data (region-wise segment analysis), with forecasts and estimates in "USD million" for the period 2026-2030, as well as historical data from 2020-2024 for the following segments.

  • Type
    • Rotary blade
    • Fixed wing
    • Hybrid
  • Technology
    • Remotely operated
    • Semi-autonomous
    • Autonomous
  • Deployment
    • Visual line of sight
    • Extended visual line of sight
    • Beyond visual line of sight
  • Application
    • Intelligence surveillance and reconnaissance
    • Logistics and supply
    • Combat and strike missions
  • Geography
    • North America
      • US
      • Canada
      • Mexico
    • APAC
      • China
      • India
      • Japan
    • Europe
      • UK
      • France
      • Germany
    • Middle East and Africa
      • Israel
      • Turkey
      • Saudi Arabia
    • South America
      • Brazil
      • Argentina
    • Rest of World (ROW)

By Type Insights

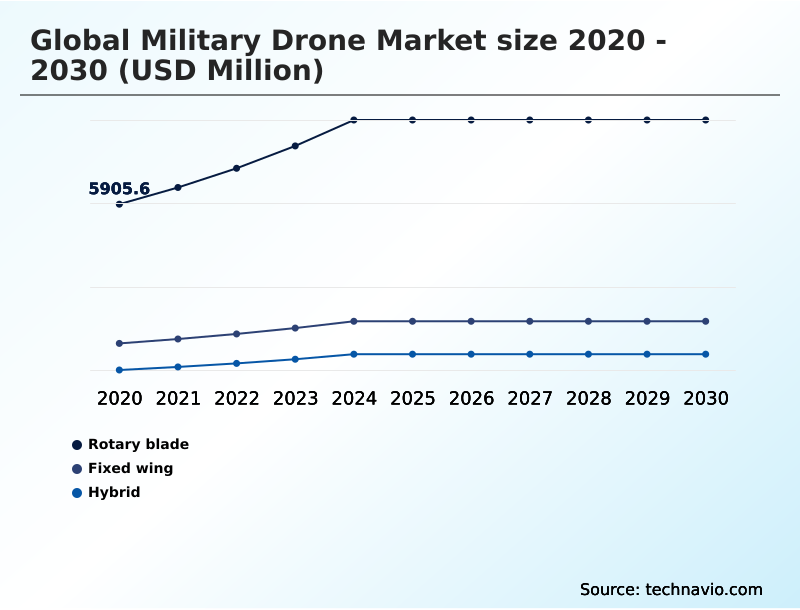
The rotary blade segment is estimated to witness significant growth during the forecast period.

The rotary blade segment is critical for military operations, defined by unmanned aerial vehicles (UAVs) with vertical takeoff and landing (VTOL) capabilities. These platforms excel in providing tactical intelligence in confined spaces where traditional runways are absent.

The operational advantage of a rotary blade drone is its ability to hover for persistent surveillance and navigate complex low-altitude environments.

A key development is the strategic shift toward enhancing the electronic warfare resilience and payload capacity of these systems, with next-generation platforms showing a 30% increase in mission endurance.

Integration of modular weapon systems is transforming these platforms from pure surveillance assets to tools for precision-strike and logistics, expanding their role in modernizing tactical capabilities.

Request Free Sample

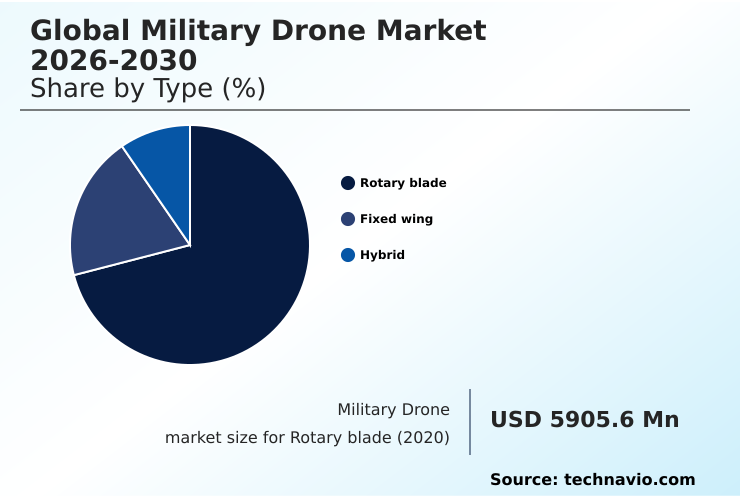
The Rotary blade segment was valued at USD 8.50 billion in 2024 and showed a gradual increase during the forecast period.

Request Free Sample

Regional Analysis

North America is estimated to contribute 33.9% to the growth of the global market during the forecast period.Technavio’s analysts have elaborately explained the regional trends and drivers that shape the market during the forecast period.

See How Military Drone Market Demand is Rising in North America Request Free Sample

The global military drone market's geographic landscape is characterized by distinct regional priorities and investment strategies. North America, contributing over 33% of the incremental growth, leads in developing sophisticated collaborative combat aircraft and emphasizes robust electronic warfare resilience.

The region's focus is on high-endurance platforms with advanced synthetic aperture radar.

In contrast, the APAC region, projected to have the fastest growth at a 13.9% CAGR, is driven by maritime security needs, fueling demand for both tactical unmanned aerial systems and loitering munitions.

European nations are accelerating investments in manned-unmanned teaming and sovereign drone programs, prioritizing modular open systems architecture.

The Middle East and Africa show the highest regional CAGR of 17.1%, with a focus on acquiring combat-proven platforms for precision strikes and developing domestic production capabilities for greater strategic autonomy.

Market Dynamics

Our researchers analyzed the data with 2025 as the base year, along with the key drivers, trends, and challenges. A holistic analysis of drivers will help companies refine their marketing strategies to gain a competitive advantage.

  • Strategic decision-making in the military drone sector is increasingly shaped by nuanced long-term assessments, moving beyond simple platform acquisition. Evaluating the cost-benefit of attritable drone fleets has become a central pillar of procurement strategy, where the lifecycle expense of high-volume, low-cost systems is weighed against fewer, more exquisite assets.
  • The successful integration of fifth-generation fighters with manned-unmanned teaming (MUM-T) hinges on advanced UAV swarm intelligence coordination protocols, a domain where software development is as critical as airframe design. For naval forces, the focus on hybrid VTOL drone naval operations is intensifying, as these platforms offer unparalleled flexibility for ship-based deployment without requiring extensive infrastructure.
  • In parallel, the demand for persistent surveillance in extreme environments is being met by solar-powered HALE arctic surveillance platforms, which provide satellite-like persistence at a fraction of the cost.
  • The ability of these platforms to function relies on robust edge-AI for GPS-denied drone navigation, a technology that has shown to reduce mission failure rates by over 20% compared to systems reliant solely on satellite links.
  • Furthermore, the development of counter-UAS laser defense systems is a direct response to the proliferation of these technologies, adding another layer of complexity to strategic planning.

What are the key market drivers leading to the rise in the adoption of Military Drone Industry?

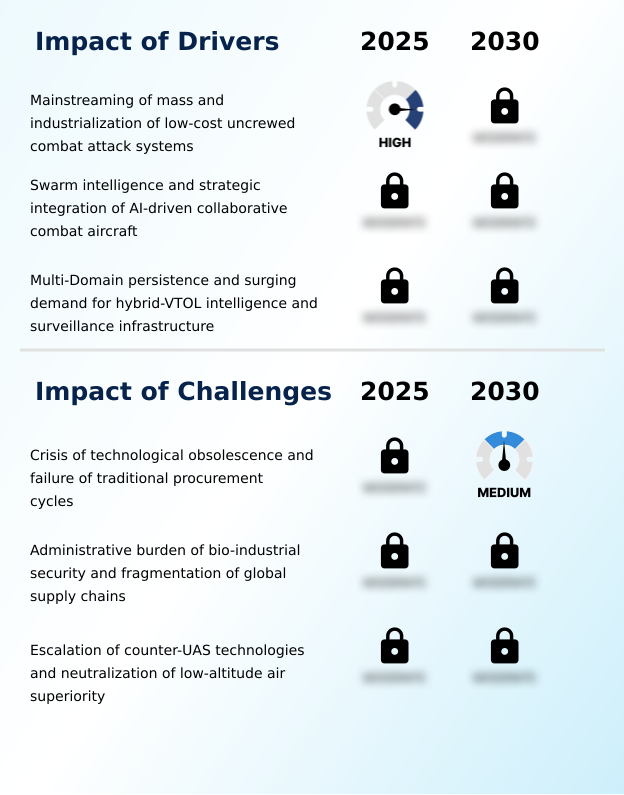
  • The mainstreaming of attritable mass and the industrialization of low-cost uncrewed combat attack systems are key drivers shaping the market.

  • Market growth is significantly propelled by the strategic shift towards attritable mass and the industrialization of low-cost uncrewed combat attack systems (UCAS).
  • This driver has led to procurement programs prioritizing volume and speed, with some initiatives aiming to reduce delivery timelines by 60% compared to traditional acquisition cycles. Another key driver is the integration of swarm intelligence and AI-driven collaborative combat aircraft.
  • The use of autonomous loyal wingman systems enhances the survivability and lethality of manned fighter squadrons, effectively increasing combat power without a proportional rise in personnel.
  • Lastly, the demand for multi-domain persistence is fueling the development of hybrid-VTOL platforms, which combine the flexibility of helicopters with the endurance of fixed-wing aircraft, extending surveillance times by up to 40% in maritime and border security missions.

What are the market trends shaping the Military Drone Industry?

  • The institutionalization of high-altitude, long-endurance solar-powered platforms designed for persistent surveillance is a significant trend. These systems function as cost-effective pseudo-satellites, providing continuous regional coverage.

  • The military drone market is experiencing a profound structural realignment, driven by the institutionalization of high-altitude long-endurance (HALE) platforms. These systems, particularly solar-powered platforms, offer unprecedented persistence, with some achieving flight durations measured in months, a 500% increase over traditional fuel-based counterparts. A parallel trend is the proliferation of edge-AI and onboard neural processing, enabling autonomous operations and GPS-denied navigation.
  • This shift to onboard intelligence has improved mission success rates in electronically contested zones by over 30%. Furthermore, the concept of collaborative combat aircraft and manned-unmanned teaming is transitioning from experimental to operational, with autonomous loyal wingman systems becoming integral to modern air combat doctrine, multiplying the effectiveness of piloted fighter jets.

What challenges does the Military Drone Industry face during its growth?

  • The crisis of technological obsolescence, coupled with the failure of traditional procurement cycles to keep pace, presents a key challenge to industry growth.

  • A primary challenge confronting the market is the crisis of technological obsolescence, where the speed of innovation outpaces slow-moving defense procurement cycles, rendering platforms irrelevant before they are even widely deployed. This can lead to capability gaps where adversaries deploying commercial-off-the-shelf technology gain a temporary advantage.
  • Another significant hurdle is the fragmentation of global supply chains due to new security regulations, which has increased the bill of materials for tactical UAVs by as much as 25% for some manufacturers. Finally, the rapid escalation of sophisticated counter-UAS technologies, including directed-energy weapons and high-power microwaves, threatens to neutralize the tactical advantages of drone fleets.
  • These systems can create electromagnetic fog zones, reducing drone operational effectiveness by over 50% in certain scenarios.

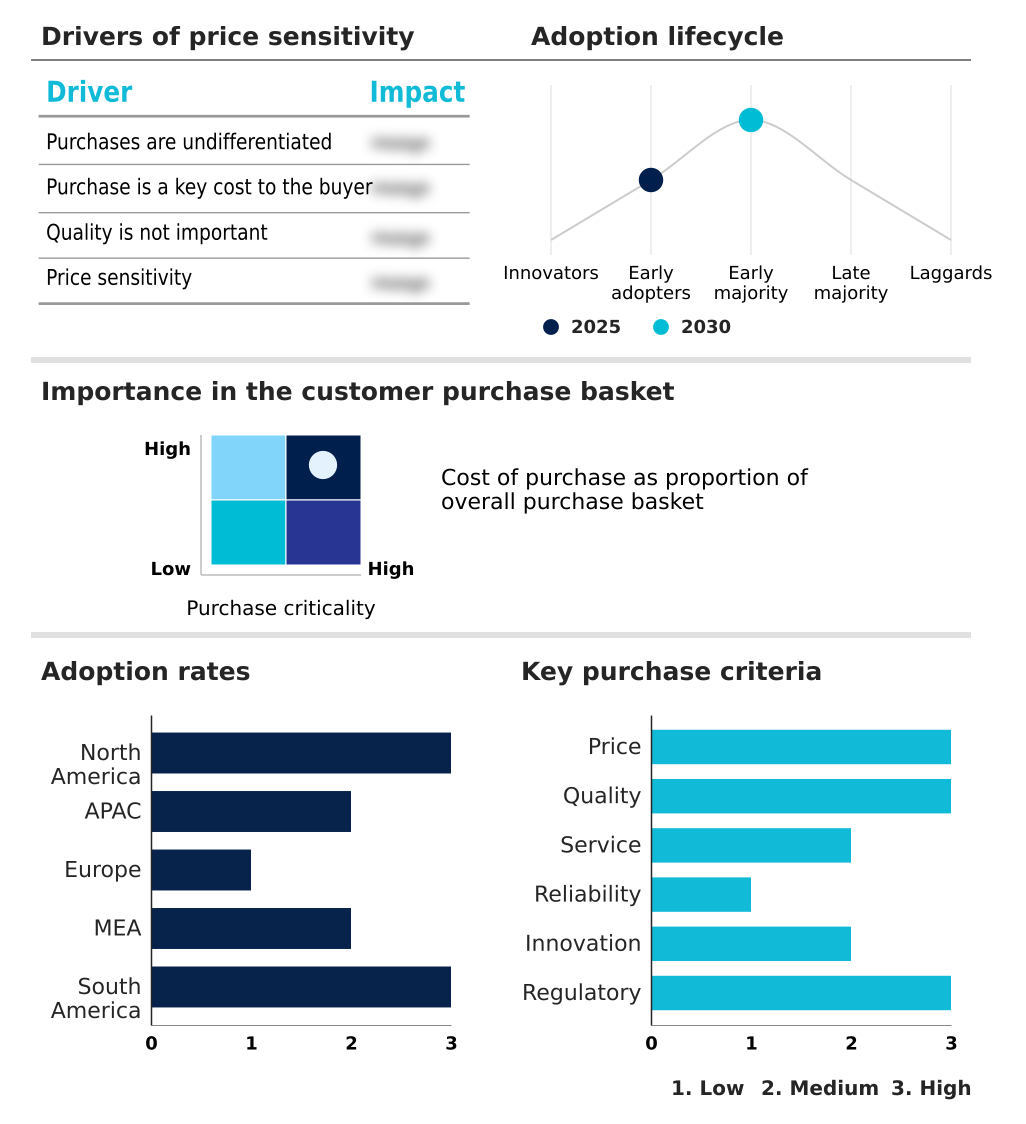
Exclusive Technavio Analysis on Customer Landscape

The military drone market forecasting report includes the adoption lifecycle of the market, covering from the innovator’s stage to the laggard’s stage. It focuses on adoption rates in different regions based on penetration. Furthermore, the military drone market report also includes key purchase criteria and drivers of price sensitivity to help companies evaluate and develop their market growth analysis strategies.

Customer Landscape of Military Drone Industry

Competitive Landscape

Companies are implementing various strategies, such as strategic alliances, military drone market forecast, partnerships, mergers and acquisitions, geographical expansion, and product/service launches, to enhance their presence in the industry.

AeroVironment Inc. - Analysts track the firm's portfolio of tactical UAVs, loitering munitions, and reconnaissance systems, which are integral to modern battlefield intelligence and surveillance operations.

The industry research and growth report includes detailed analyses of the competitive landscape of the market and information about key companies, including:

  • AeroVironment Inc.
  • Airbus SE
  • Anduril Industries Inc.
  • Asteria Aerospace Ltd.
  • BAE Systems Plc
  • Edge Group PJSC
  • Elbit Systems Ltd.
  • General Atomics
  • Israel Aerospace Ltd.
  • Leonardo S.p.A.
  • Lockheed Martin Corp.
  • Northrop Grumman Corp.
  • Rafael Advanced Defense Ltd.
  • RTX Corp.
  • Saab AB
  • Shield AI
  • Teledyne Technologies Inc.
  • Textron Inc.
  • Thales Group
  • The Boeing Co.

Qualitative and quantitative analysis of companies has been conducted to help clients understand the wider business environment as well as the strengths and weaknesses of key industry players. Data is qualitatively analyzed to categorize companies as pure play, category-focused, industry-focused, and diversified; it is quantitatively analyzed to categorize companies as dominant, leading, strong, tentative, and weak.

Recent Development and News in Military drone market

  • In May 2025, AeroVironment Inc. completed its acquisition of BlueHalo's directed energy and electronic warfare division, enhancing its tactical UAVs' survivability in contested electromagnetic environments.
  • In October 2025, The Boeing Co. introduced its Collaborative Transformational Rotorcraft (CxR) family, a modular tiltrotor concept engineered for collaborative flight with existing helicopter fleets at speeds reaching 250 knots.
  • In February 2026, General Atomics Aeronautical Systems Inc. unveiled its YFQ-42A Dark Merlin, a Collaborative Combat Aircraft (CCA) designed for high-density autonomous teaming and semi-autonomous airborne engagements.
  • In March 2026, the European Defence Agency selected Airbus Helicopters to spearhead the Multi Mission Unmanned Aircraft System project, aiming to develop a 120-kilogram hybrid uncrewed aircraft for diverse roles including electronic warfare.

Dive into Technavio’s robust research methodology, blending expert interviews, extensive data synthesis, and validated models for unparalleled Military Drone Market insights. See full methodology.

Market Scope
Page number 324
Base year 2025
Historic period 2020-2024
Forecast period 2026-2030
Growth momentum & CAGR Accelerate at a CAGR of 13.6%
Market growth 2026-2030 USD 12003.1 million
Market structure Fragmented
YoY growth 2025-2026(%) 12.0%
Key countries US, Canada, Mexico, China, India, Japan, South Korea, Australia, Indonesia, UK, France, Germany, Italy, The Netherlands, Spain, Israel, Turkey, Saudi Arabia, UAE, South Africa, Brazil, Argentina and Chile
Competitive landscape Leading Companies, Market Positioning of Companies, Competitive Strategies, and Industry Risks

Request Free Sample

Research Analyst Overview

  • The military drone market is undergoing a significant doctrinal shift, moving toward systems defined by software and autonomy. The emphasis is on developing attritable mass and leveraging swarm intelligence, where numerous interconnected platforms overwhelm traditional defenses. This trend is powered by the operational necessity for persistent situational awareness in contested environments.
  • A core technological pillar is the advancement of collaborative combat aircraft, which function as force multipliers in manned-unmanned teaming (MUM-T) scenarios. The integration of hybrid-VTOL technology addresses logistical challenges, enabling deployment from austere locations. Platforms are increasingly equipped with sophisticated payloads like synthetic aperture radar and signals intelligence suites for multi-domain persistence.
  • To ensure operational viability, there's a strong focus on electronic warfare resilience and GPS-denied navigation, often achieved through edge-AI and onboard neural processing. This focus on survivability extends to countering directed-energy weapons and other counter-UAS technologies.
  • For boardroom consideration, the adoption of a modular open systems architecture has been shown to reduce platform upgrade costs by up to 35%, ensuring long-term fleet viability against rapid technological obsolescence.

What are the Key Data Covered in this Military Drone Market Research and Growth Report?

  • What is the expected growth of the Military Drone Market between 2026 and 2030?

    • USD 12.00 billion, at a CAGR of 13.6%

  • What segmentation does the market report cover?

    • The report is segmented by Type (Rotary blade, Fixed wing, and Hybrid), Technology (Remotely operated, Semi-autonomous, and Autonomous), Deployment (Visual line of sight, Extended visual line of sight, and Beyond visual line of sight), Application (Intelligence surveillance and reconnaissance, Logistics and supply, and Combat and strike missions) and Geography (North America, APAC, Europe, Middle East and Africa, South America)

  • Which regions are analyzed in the report?

    • North America, APAC, Europe, Middle East and Africa and South America

  • What are the key growth drivers and market challenges?

    • Mainstreaming of mass and industrialization of low-cost uncrewed combat attack systems, Crisis of technological obsolescence and failure of traditional procurement cycles

  • Who are the major players in the Military Drone Market?

    • AeroVironment Inc., Airbus SE, Anduril Industries Inc., Asteria Aerospace Ltd., BAE Systems Plc, Edge Group PJSC, Elbit Systems Ltd., General Atomics, Israel Aerospace Ltd., Leonardo S.p.A., Lockheed Martin Corp., Northrop Grumman Corp., Rafael Advanced Defense Ltd., RTX Corp., Saab AB, Shield AI, Teledyne Technologies Inc., Textron Inc., Thales Group and The Boeing Co.

Market Research Insights

  • The military drone market is defined by a rapid evolution in operational doctrine, where the value of high-altitude long-endurance platforms is now complemented by the strategic necessity of attritable low-cost drones. This dynamic has spurred an 18% increase in R&D for AI-driven collaborative combat systems over the last two years.
  • The pursuit of multi-domain persistence and persistent situational awareness is paramount, leading to a 25% higher adoption rate of autonomous loyal wingman systems in advanced air forces. These platforms are crucial for maintaining an edge in environments demanding superior electronic warfare resilience.
  • Consequently, there is a clear trend toward decentralized drone production, allowing for faster deployment and iteration, which is critical for achieving tactical superiority.

We can help! Our analysts can customize this military drone market research report to meet your requirements.

Get in touch

1. Executive Summary

1.1 Market overview

Executive Summary - Chart on Market Overview
Executive Summary - Data Table on Market Overview
Executive Summary - Chart on Global Market Characteristics
Executive Summary - Chart on Market by Geography
Executive Summary - Chart on Market Segmentation by Type
Executive Summary - Chart on Market Segmentation by Technology
Executive Summary - Chart on Market Segmentation by Deployment
Executive Summary - Chart on Market Segmentation by Application
Executive Summary - Chart on Incremental Growth
Executive Summary - Data Table on Incremental Growth
Executive Summary - Chart on Company Market Positioning

2. Technavio Analysis

2.1 Analysis of price sensitivity, lifecycle, customer purchase basket, adoption rates, and purchase criteria

2.2 Criticality of inputs and Factors of differentiation

Chart on Overview on criticality of inputs and factors of differentiation

2.3 Factors of disruption

Chart on Overview on factors of disruption

2.4 Impact of drivers and challenges

Chart on Impact of drivers and challenges in 2025 and 2030

3. Market Landscape

3.1 Market ecosystem

Chart on Parent Market
Data Table on - Parent Market

3.2 Market characteristics

Chart on Market characteristics analysis

3.3 Value chain analysis

Chart on Value chain analysis

4. Market Sizing

4.1 Market definition

Data Table on Offerings of companies included in the market definition

4.2 Market segment analysis

Market segments

4.3 Market size 2025

4.4 Market outlook: Forecast for 2025-2030

Chart on Global - Market size and forecast 2025-2030 ($ million)
Data Table on Global - Market size and forecast 2025-2030 ($ million)
Chart on Global Market: Year-over-year growth 2025-2030 (%)
Data Table on Global Market: Year-over-year growth 2025-2030 (%)

5. Historic Market Size

5.1 Global Military Drone Market 2020 - 2024

Historic Market Size - Data Table on Global Military Drone Market 2020 - 2024 ($ million)

5.2 Type segment analysis 2020 - 2024

Historic Market Size - Type Segment 2020 - 2024 ($ million)

5.3 Technology segment analysis 2020 - 2024

Historic Market Size - Technology Segment 2020 - 2024 ($ million)

5.4 Deployment segment analysis 2020 - 2024

Historic Market Size - Deployment Segment 2020 - 2024 ($ million)

5.5 Application segment analysis 2020 - 2024

Historic Market Size - Application Segment 2020 - 2024 ($ million)

5.6 Geography segment analysis 2020 - 2024

Historic Market Size - Geography Segment 2020 - 2024 ($ million)

5.7 Country segment analysis 2020 - 2024

Historic Market Size - Country Segment 2020 - 2024 ($ million)

6. Qualitative Analysis

6.1 Impact of AI in global military drone market

6.2 Impact of geopolitical conflict for global military drone market

7. Five Forces Analysis

7.1 Five forces summary

Five forces analysis - Comparison between 2025 and 2030

7.2 Bargaining power of buyers

Bargaining power of buyers - Impact of key factors 2025 and 2030

7.3 Bargaining power of suppliers

Bargaining power of suppliers - Impact of key factors in 2025 and 2030

7.4 Threat of new entrants

Threat of new entrants - Impact of key factors in 2025 and 2030

7.5 Threat of substitutes

Threat of substitutes - Impact of key factors in 2025 and 2030

7.6 Threat of rivalry

Threat of rivalry - Impact of key factors in 2025 and 2030

7.7 Market condition

Chart on Market condition - Five forces 2025 and 2030

8. Market Segmentation by Type

8.1 Market segments

Chart on Type - Market share 2025-2030 (%)
Data Table on Type - Market share 2025-2030 (%)

8.2 Comparison by Type

Chart on Comparison by Type
Data Table on Comparison by Type

8.3 Rotary blade - Market size and forecast 2025-2030

Chart on Rotary blade - Market size and forecast 2025-2030 ($ million)
Data Table on Rotary blade - Market size and forecast 2025-2030 ($ million)
Chart on Rotary blade - Year-over-year growth 2025-2030 (%)
Data Table on Rotary blade - Year-over-year growth 2025-2030 (%)

8.4 Fixed wing - Market size and forecast 2025-2030

Chart on Fixed wing - Market size and forecast 2025-2030 ($ million)
Data Table on Fixed wing - Market size and forecast 2025-2030 ($ million)
Chart on Fixed wing - Year-over-year growth 2025-2030 (%)
Data Table on Fixed wing - Year-over-year growth 2025-2030 (%)

8.5 Hybrid - Market size and forecast 2025-2030

Chart on Hybrid - Market size and forecast 2025-2030 ($ million)
Data Table on Hybrid - Market size and forecast 2025-2030 ($ million)
Chart on Hybrid - Year-over-year growth 2025-2030 (%)
Data Table on Hybrid - Year-over-year growth 2025-2030 (%)

8.6 Market opportunity by Type

Market opportunity by Type ($ million)
Data Table on Market opportunity by Type ($ million)

9. Market Segmentation by Technology

9.1 Market segments

Chart on Technology - Market share 2025-2030 (%)
Data Table on Technology - Market share 2025-2030 (%)

9.2 Comparison by Technology

Chart on Comparison by Technology
Data Table on Comparison by Technology

9.3 Remotely operated - Market size and forecast 2025-2030

Chart on Remotely operated - Market size and forecast 2025-2030 ($ million)
Data Table on Remotely operated - Market size and forecast 2025-2030 ($ million)
Chart on Remotely operated - Year-over-year growth 2025-2030 (%)
Data Table on Remotely operated - Year-over-year growth 2025-2030 (%)

9.4 Semi-autonomous - Market size and forecast 2025-2030

Chart on Semi-autonomous - Market size and forecast 2025-2030 ($ million)
Data Table on Semi-autonomous - Market size and forecast 2025-2030 ($ million)
Chart on Semi-autonomous - Year-over-year growth 2025-2030 (%)
Data Table on Semi-autonomous - Year-over-year growth 2025-2030 (%)

9.5 Autonomous - Market size and forecast 2025-2030

Chart on Autonomous - Market size and forecast 2025-2030 ($ million)
Data Table on Autonomous - Market size and forecast 2025-2030 ($ million)
Chart on Autonomous - Year-over-year growth 2025-2030 (%)
Data Table on Autonomous - Year-over-year growth 2025-2030 (%)

9.6 Market opportunity by Technology

Market opportunity by Technology ($ million)
Data Table on Market opportunity by Technology ($ million)

10. Market Segmentation by Deployment

10.1 Market segments

Chart on Deployment - Market share 2025-2030 (%)
Data Table on Deployment - Market share 2025-2030 (%)

10.2 Comparison by Deployment

Chart on Comparison by Deployment
Data Table on Comparison by Deployment

10.3 Visual line of sight - Market size and forecast 2025-2030

Chart on Visual line of sight - Market size and forecast 2025-2030 ($ million)
Data Table on Visual line of sight - Market size and forecast 2025-2030 ($ million)
Chart on Visual line of sight - Year-over-year growth 2025-2030 (%)
Data Table on Visual line of sight - Year-over-year growth 2025-2030 (%)

10.4 Extended visual line of sight - Market size and forecast 2025-2030

Chart on Extended visual line of sight - Market size and forecast 2025-2030 ($ million)
Data Table on Extended visual line of sight - Market size and forecast 2025-2030 ($ million)
Chart on Extended visual line of sight - Year-over-year growth 2025-2030 (%)
Data Table on Extended visual line of sight - Year-over-year growth 2025-2030 (%)

10.5 Beyond visual line of sight - Market size and forecast 2025-2030

Chart on Beyond visual line of sight - Market size and forecast 2025-2030 ($ million)
Data Table on Beyond visual line of sight - Market size and forecast 2025-2030 ($ million)
Chart on Beyond visual line of sight - Year-over-year growth 2025-2030 (%)
Data Table on Beyond visual line of sight - Year-over-year growth 2025-2030 (%)

10.6 Market opportunity by Deployment

Market opportunity by Deployment ($ million)
Data Table on Market opportunity by Deployment ($ million)

11. Market Segmentation by Application

11.1 Market segments

Chart on Application - Market share 2025-2030 (%)
Data Table on Application - Market share 2025-2030 (%)

11.2 Comparison by Application

Chart on Comparison by Application
Data Table on Comparison by Application

11.3 Intelligence surveillance and reconnaissance - Market size and forecast 2025-2030

Chart on Intelligence surveillance and reconnaissance - Market size and forecast 2025-2030 ($ million)
Data Table on Intelligence surveillance and reconnaissance - Market size and forecast 2025-2030 ($ million)
Chart on Intelligence surveillance and reconnaissance - Year-over-year growth 2025-2030 (%)
Data Table on Intelligence surveillance and reconnaissance - Year-over-year growth 2025-2030 (%)

11.4 Logistics and supply - Market size and forecast 2025-2030

Chart on Logistics and supply - Market size and forecast 2025-2030 ($ million)
Data Table on Logistics and supply - Market size and forecast 2025-2030 ($ million)
Chart on Logistics and supply - Year-over-year growth 2025-2030 (%)
Data Table on Logistics and supply - Year-over-year growth 2025-2030 (%)

11.5 Combat and strike missions - Market size and forecast 2025-2030

Chart on Combat and strike missions - Market size and forecast 2025-2030 ($ million)
Data Table on Combat and strike missions - Market size and forecast 2025-2030 ($ million)
Chart on Combat and strike missions - Year-over-year growth 2025-2030 (%)
Data Table on Combat and strike missions - Year-over-year growth 2025-2030 (%)

11.6 Market opportunity by Application

Market opportunity by Application ($ million)
Data Table on Market opportunity by Application ($ million)

12. Customer Landscape

12.1 Customer landscape overview

Analysis of price sensitivity, lifecycle, customer purchase basket, adoption rates, and purchase criteria

13. Geographic Landscape

13.1 Geographic segmentation

Chart on Market share by geography 2025-2030 (%)
Data Table on Market share by geography 2025-2030 (%)

13.2 Geographic comparison

Chart on Geographic comparison
Data Table on Geographic comparison

13.3 North America - Market size and forecast 2025-2030

Chart on North America - Market size and forecast 2025-2030 ($ million)
Data Table on North America - Market size and forecast 2025-2030 ($ million)
Chart on North America - Year-over-year growth 2025-2030 (%)
Data Table on North America - Year-over-year growth 2025-2030 (%)
Chart on Regional Comparison - North America
Data Table on Regional Comparison - North America

13.3.1 US - Market size and forecast 2025-2030

Chart on US - Market size and forecast 2025-2030 ($ million)
Data Table on US - Market size and forecast 2025-2030 ($ million)
Chart on US - Year-over-year growth 2025-2030 (%)
Data Table on US - Year-over-year growth 2025-2030 (%)

13.3.2 Canada - Market size and forecast 2025-2030

Chart on Canada - Market size and forecast 2025-2030 ($ million)
Data Table on Canada - Market size and forecast 2025-2030 ($ million)
Chart on Canada - Year-over-year growth 2025-2030 (%)
Data Table on Canada - Year-over-year growth 2025-2030 (%)

13.3.3 Mexico - Market size and forecast 2025-2030

Chart on Mexico - Market size and forecast 2025-2030 ($ million)
Data Table on Mexico - Market size and forecast 2025-2030 ($ million)
Chart on Mexico - Year-over-year growth 2025-2030 (%)
Data Table on Mexico - Year-over-year growth 2025-2030 (%)

13.4 APAC - Market size and forecast 2025-2030

Chart on APAC - Market size and forecast 2025-2030 ($ million)
Data Table on APAC - Market size and forecast 2025-2030 ($ million)
Chart on APAC - Year-over-year growth 2025-2030 (%)
Data Table on APAC - Year-over-year growth 2025-2030 (%)
Chart on Regional Comparison - APAC
Data Table on Regional Comparison - APAC

13.4.1 China - Market size and forecast 2025-2030

Chart on China - Market size and forecast 2025-2030 ($ million)
Data Table on China - Market size and forecast 2025-2030 ($ million)
Chart on China - Year-over-year growth 2025-2030 (%)
Data Table on China - Year-over-year growth 2025-2030 (%)

13.4.2 India - Market size and forecast 2025-2030

Chart on India - Market size and forecast 2025-2030 ($ million)
Data Table on India - Market size and forecast 2025-2030 ($ million)
Chart on India - Year-over-year growth 2025-2030 (%)
Data Table on India - Year-over-year growth 2025-2030 (%)

13.4.3 Japan - Market size and forecast 2025-2030

Chart on Japan - Market size and forecast 2025-2030 ($ million)
Data Table on Japan - Market size and forecast 2025-2030 ($ million)
Chart on Japan - Year-over-year growth 2025-2030 (%)
Data Table on Japan - Year-over-year growth 2025-2030 (%)

13.4.4 South Korea - Market size and forecast 2025-2030

Chart on South Korea - Market size and forecast 2025-2030 ($ million)
Data Table on South Korea - Market size and forecast 2025-2030 ($ million)
Chart on South Korea - Year-over-year growth 2025-2030 (%)
Data Table on South Korea - Year-over-year growth 2025-2030 (%)

13.4.5 Australia - Market size and forecast 2025-2030

Chart on Australia - Market size and forecast 2025-2030 ($ million)
Data Table on Australia - Market size and forecast 2025-2030 ($ million)
Chart on Australia - Year-over-year growth 2025-2030 (%)
Data Table on Australia - Year-over-year growth 2025-2030 (%)

13.4.6 Indonesia - Market size and forecast 2025-2030

Chart on Indonesia - Market size and forecast 2025-2030 ($ million)
Data Table on Indonesia - Market size and forecast 2025-2030 ($ million)
Chart on Indonesia - Year-over-year growth 2025-2030 (%)
Data Table on Indonesia - Year-over-year growth 2025-2030 (%)

13.5 Europe - Market size and forecast 2025-2030

Chart on Europe - Market size and forecast 2025-2030 ($ million)
Data Table on Europe - Market size and forecast 2025-2030 ($ million)
Chart on Europe - Year-over-year growth 2025-2030 (%)
Data Table on Europe - Year-over-year growth 2025-2030 (%)
Chart on Regional Comparison - Europe
Data Table on Regional Comparison - Europe

13.5.1 UK - Market size and forecast 2025-2030

Chart on UK - Market size and forecast 2025-2030 ($ million)
Data Table on UK - Market size and forecast 2025-2030 ($ million)
Chart on UK - Year-over-year growth 2025-2030 (%)
Data Table on UK - Year-over-year growth 2025-2030 (%)

13.5.2 France - Market size and forecast 2025-2030

Chart on France - Market size and forecast 2025-2030 ($ million)
Data Table on France - Market size and forecast 2025-2030 ($ million)
Chart on France - Year-over-year growth 2025-2030 (%)
Data Table on France - Year-over-year growth 2025-2030 (%)

13.5.3 Germany - Market size and forecast 2025-2030

Chart on Germany - Market size and forecast 2025-2030 ($ million)
Data Table on Germany - Market size and forecast 2025-2030 ($ million)
Chart on Germany - Year-over-year growth 2025-2030 (%)
Data Table on Germany - Year-over-year growth 2025-2030 (%)

13.5.4 Italy - Market size and forecast 2025-2030

Chart on Italy - Market size and forecast 2025-2030 ($ million)
Data Table on Italy - Market size and forecast 2025-2030 ($ million)
Chart on Italy - Year-over-year growth 2025-2030 (%)
Data Table on Italy - Year-over-year growth 2025-2030 (%)

13.5.5 The Netherlands - Market size and forecast 2025-2030

Chart on The Netherlands - Market size and forecast 2025-2030 ($ million)
Data Table on The Netherlands - Market size and forecast 2025-2030 ($ million)
Chart on The Netherlands - Year-over-year growth 2025-2030 (%)
Data Table on The Netherlands - Year-over-year growth 2025-2030 (%)

13.5.6 Spain - Market size and forecast 2025-2030

Chart on Spain - Market size and forecast 2025-2030 ($ million)
Data Table on Spain - Market size and forecast 2025-2030 ($ million)
Chart on Spain - Year-over-year growth 2025-2030 (%)
Data Table on Spain - Year-over-year growth 2025-2030 (%)

13.6 Middle East and Africa - Market size and forecast 2025-2030

Chart on Middle East and Africa - Market size and forecast 2025-2030 ($ million)
Data Table on Middle East and Africa - Market size and forecast 2025-2030 ($ million)
Chart on Middle East and Africa - Year-over-year growth 2025-2030 (%)
Data Table on Middle East and Africa - Year-over-year growth 2025-2030 (%)
Chart on Regional Comparison - Middle East and Africa
Data Table on Regional Comparison - Middle East and Africa

13.6.1 Israel - Market size and forecast 2025-2030

Chart on Israel - Market size and forecast 2025-2030 ($ million)
Data Table on Israel - Market size and forecast 2025-2030 ($ million)
Chart on Israel - Year-over-year growth 2025-2030 (%)
Data Table on Israel - Year-over-year growth 2025-2030 (%)

13.6.2 Turkey - Market size and forecast 2025-2030

Chart on Turkey - Market size and forecast 2025-2030 ($ million)
Data Table on Turkey - Market size and forecast 2025-2030 ($ million)
Chart on Turkey - Year-over-year growth 2025-2030 (%)
Data Table on Turkey - Year-over-year growth 2025-2030 (%)

13.6.3 Saudi Arabia - Market size and forecast 2025-2030

Chart on Saudi Arabia - Market size and forecast 2025-2030 ($ million)
Data Table on Saudi Arabia - Market size and forecast 2025-2030 ($ million)
Chart on Saudi Arabia - Year-over-year growth 2025-2030 (%)
Data Table on Saudi Arabia - Year-over-year growth 2025-2030 (%)

13.6.4 UAE - Market size and forecast 2025-2030

Chart on UAE - Market size and forecast 2025-2030 ($ million)
Data Table on UAE - Market size and forecast 2025-2030 ($ million)
Chart on UAE - Year-over-year growth 2025-2030 (%)
Data Table on UAE - Year-over-year growth 2025-2030 (%)

13.6.5 South Africa - Market size and forecast 2025-2030

Chart on South Africa - Market size and forecast 2025-2030 ($ million)
Data Table on South Africa - Market size and forecast 2025-2030 ($ million)
Chart on South Africa - Year-over-year growth 2025-2030 (%)
Data Table on South Africa - Year-over-year growth 2025-2030 (%)

13.7 South America - Market size and forecast 2025-2030

Chart on South America - Market size and forecast 2025-2030 ($ million)
Data Table on South America - Market size and forecast 2025-2030 ($ million)
Chart on South America - Year-over-year growth 2025-2030 (%)
Data Table on South America - Year-over-year growth 2025-2030 (%)
Chart on Regional Comparison - South America
Data Table on Regional Comparison - South America

13.7.1 Brazil - Market size and forecast 2025-2030

Chart on Brazil - Market size and forecast 2025-2030 ($ million)
Data Table on Brazil - Market size and forecast 2025-2030 ($ million)
Chart on Brazil - Year-over-year growth 2025-2030 (%)
Data Table on Brazil - Year-over-year growth 2025-2030 (%)

13.7.2 Argentina - Market size and forecast 2025-2030

Chart on Argentina - Market size and forecast 2025-2030 ($ million)
Data Table on Argentina - Market size and forecast 2025-2030 ($ million)
Chart on Argentina - Year-over-year growth 2025-2030 (%)
Data Table on Argentina - Year-over-year growth 2025-2030 (%)

13.7.3 Chile - Market size and forecast 2025-2030

Chart on Chile - Market size and forecast 2025-2030 ($ million)
Data Table on Chile - Market size and forecast 2025-2030 ($ million)
Chart on Chile - Year-over-year growth 2025-2030 (%)
Data Table on Chile - Year-over-year growth 2025-2030 (%)

13.8 Market opportunity by geography

Market opportunity by geography ($ million)
Data Tables on Market opportunity by geography ($ million)

14. Drivers, Challenges, and Opportunity

14.1 Market drivers

Mainstreaming of mass and industrialization of low-cost uncrewed combat attack systems
Swarm intelligence and strategic integration of AI-driven collaborative combat aircraft
Multi-Domain persistence and surging demand for hybrid-VTOL intelligence and surveillance infrastructure

14.2 Market challenges

Crisis of technological obsolescence and failure of traditional procurement cycles
Administrative burden of bio-industrial security and fragmentation of global supply chains
Escalation of counter-UAS technologies and neutralization of low-altitude air superiority

14.3 Impact of drivers and challenges

Impact of drivers and challenges in 2025 and 2030

14.4 Market opportunities

Institutionalization of high-altitude long-endurance solar-powered platforms
Edge-AI and onboard neural processing for GPS-denied navigation
Collaborative combat aircraft and manned-unmanned teaming

15. Competitive Landscape

15.1 Overview

15.2

Overview on criticality of inputs and factors of differentiation

15.3 Landscape disruption

Overview on factors of disruption

15.4 Industry risks

Impact of key risks on business

16. Competitive Analysis

16.1 Companies profiled

Companies covered

16.2 Company ranking index

16.3 Market positioning of companies

Matrix on companies position and classification

16.4 AeroVironment Inc.

AeroVironment Inc. - Overview
AeroVironment Inc. - Business segments
AeroVironment Inc. - Key news
AeroVironment Inc. - Key offerings
AeroVironment Inc. - Segment focus
SWOT

16.5 Airbus SE

Airbus SE - Overview
Airbus SE - Business segments
Airbus SE - Key news
Airbus SE - Key offerings
Airbus SE - Segment focus
SWOT

16.6 Anduril Industries Inc.

Anduril Industries Inc. - Overview
Anduril Industries Inc. - Product / Service
Anduril Industries Inc. - Key offerings
SWOT

16.7 BAE Systems Plc

BAE Systems Plc - Overview
BAE Systems Plc - Business segments
BAE Systems Plc - Key news
BAE Systems Plc - Key offerings
BAE Systems Plc - Segment focus
SWOT

16.8 Elbit Systems Ltd.

Elbit Systems Ltd. - Overview
Elbit Systems Ltd. - Business segments
Elbit Systems Ltd. - Key news
Elbit Systems Ltd. - Key offerings
Elbit Systems Ltd. - Segment focus
SWOT

16.9 General Atomics

General Atomics - Overview
General Atomics - Product / Service
General Atomics - Key offerings
SWOT

16.10 Israel Aerospace Ltd.

Israel Aerospace Ltd. - Overview
Israel Aerospace Ltd. - Product / Service
Israel Aerospace Ltd. - Key news
Israel Aerospace Ltd. - Key offerings
SWOT

16.11 Lockheed Martin Corp.

Lockheed Martin Corp. - Overview
Lockheed Martin Corp. - Business segments
Lockheed Martin Corp. - Key news
Lockheed Martin Corp. - Key offerings
Lockheed Martin Corp. - Segment focus
SWOT

16.12 Northrop Grumman Corp.

Northrop Grumman Corp. - Overview
Northrop Grumman Corp. - Business segments
Northrop Grumman Corp. - Key news
Northrop Grumman Corp. - Key offerings
Northrop Grumman Corp. - Segment focus
SWOT

16.13 RTX Corp.

RTX Corp. - Overview
RTX Corp. - Business segments
RTX Corp. - Key news
RTX Corp. - Key offerings
RTX Corp. - Segment focus
SWOT

16.14 Saab AB

Saab AB - Overview
Saab AB - Business segments
Saab AB - Key news
Saab AB - Key offerings
Saab AB - Segment focus
SWOT

16.15 Teledyne Technologies Inc.

Teledyne Technologies Inc. - Overview
Teledyne Technologies Inc. - Business segments
Teledyne Technologies Inc. - Key news
Teledyne Technologies Inc. - Key offerings
Teledyne Technologies Inc. - Segment focus
SWOT

16.16 Textron Inc.

Textron Inc. - Overview
Textron Inc. - Business segments
Textron Inc. - Key offerings
Textron Inc. - Segment focus
SWOT

16.17 Thales Group

Thales Group - Overview
Thales Group - Business segments
Thales Group - Key news
Thales Group - Key offerings
Thales Group - Segment focus
SWOT

16.18 The Boeing Co.

The Boeing Co. - Overview
The Boeing Co. - Business segments
The Boeing Co. - Key news
The Boeing Co. - Key offerings
The Boeing Co. - Segment focus
SWOT

17. Appendix

17.1 Scope of the report

Market definition
Objectives
Notes and caveats

17.2 Inclusions and exclusions checklist

Inclusions checklist
Exclusions checklist

17.3 Currency conversion rates for US$

17.4 Research methodology

17.5 Data procurement

Information sources

17.6 Data validation

17.7 Validation techniques employed for market sizing

17.8 Data synthesis

17.9 360 degree market analysis

17.10 List of abbreviations

Research Methodology

Technavio presents a detailed picture of the market by way of study, synthesis, and summation of data from multiple sources. The analysts have presented the various facets of the market with a particular focus on identifying the key industry influencers. The data thus presented is comprehensive, reliable, and the result of extensive research, both primary and secondary.

INFORMATION SOURCES

Primary sources

  • Manufacturers and suppliers
  • Channel partners
  • Industry experts
  • Strategic decision makers

Secondary sources

  • Industry journals and periodicals
  • Government data
  • Financial reports of key industry players
  • Historical data
  • Press releases

DATA ANALYSIS

Data Synthesis

  • Collation of data
  • Estimation of key figures
  • Analysis of derived insights

Data Validation

  • Triangulation with data models
  • Reference against proprietary databases
  • Corroboration with industry experts

REPORT WRITING

Qualitative

  • Market drivers
  • Market challenges
  • Market trends
  • Five forces analysis

Quantitative

  • Market size and forecast
  • Market segmentation
  • Geographical insights
  • Competitive landscape

Interested in this report?

Get your sample now to see our research methodology and insights!

Download Now

Frequently Asked Questions

Military Drone market growth will increase by USD 12003.1 million during 2026-2030.

The Military Drone market is expected to grow at a CAGR of 13.6% during 2026-2030.

Military Drone market is segmented by Type (Rotary blade, Fixed wing, Hybrid) Technology (Remotely operated, Semi-autonomous, Autonomous) Deployment (Visual line of sight, Extended visual line of sight, Beyond visual line of sight) Application (Intelligence surveillance and reconnaissance, Logistics and supply, Combat and strike missions)

AeroVironment Inc., Airbus SE, Anduril Industries Inc., Asteria Aerospace Ltd., BAE Systems Plc, Edge Group PJSC, Elbit Systems Ltd., General Atomics, Israel Aerospace Ltd., Leonardo S.p.A., Lockheed Martin Corp., Northrop Grumman Corp., Rafael Advanced Defense Ltd., RTX Corp., Saab AB, Shield AI, Teledyne Technologies Inc., Textron Inc., Thales Group, The Boeing Co. are a few of the key vendors in the Military Drone market.

North America will register the highest growth rate of 33.9% among the other regions. Therefore, the Military Drone market in North America is expected to garner significant business opportunities for the vendors during the forecast period.

US, Canada, Mexico, China, India, Japan, South Korea, Australia, Indonesia, UK, France, Germany, Italy, The Netherlands, Spain, Israel, Turkey, Saudi Arabia, UAE, South Africa, Brazil, Argentina, Chile

  • Mainstreaming of mass and industrialization of low-cost uncrewed combat attack systems is the driving factor this market.

The Military Drone market vendors should focus on grabbing business opportunities from the Type segment as it accounted for the largest market share in the base year.