Military Sensor Fusion Market Analysis, Size, and Forecast 2026-2030: North America (US, Canada, and Mexico), Europe (Germany, France, and UK), APAC (China, Japan, and India), Middle East and Africa (Saudi Arabia, Israel, and UAE), South America (Brazil, Argentina, and Colombia), and Rest of World (ROW)

Military Sensor Fusion Market Analysis, Size, and Forecast 2026-2030:
North America (US, Canada, and Mexico), Europe (Germany, France, and UK), APAC (China, Japan, and India), Middle East and Africa (Saudi Arabia, Israel, and UAE), South America (Brazil, Argentina, and Colombia), and Rest of World (ROW)

Published: Apr 2026 311 Pages SKU: IRTNTR81438

Market Overview at a Glance

$311.78 Mn
Market Opportunity
6.1%
CAGR 2025 - 2030
33.8%
North America Growth
$371.98 Mn
Airborne and space segment 2024

Military Sensor Fusion Market Size 2026-2030

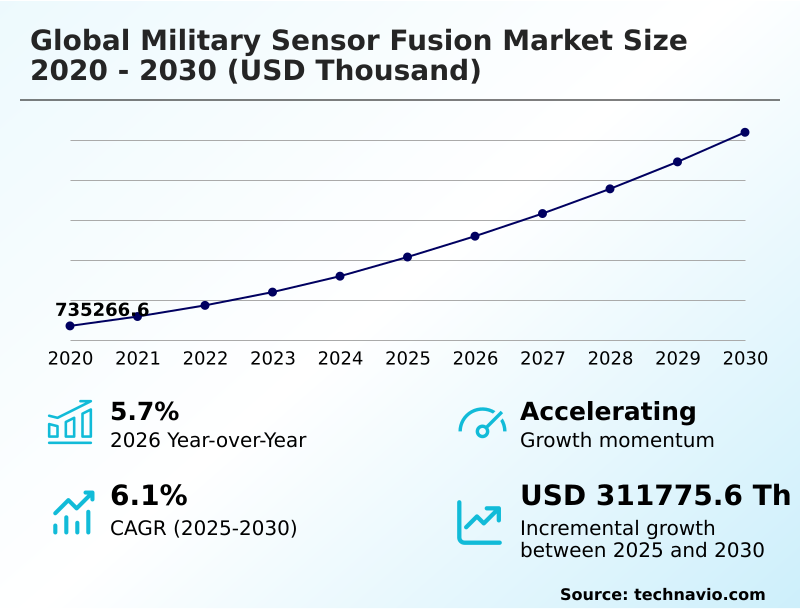
The military sensor fusion market size is valued to increase by USD 311.78 million, at a CAGR of 6.1% from 2025 to 2030. Increasing demand for enhanced situational awareness across multi-domain operations will drive the military sensor fusion market.

Major Market Trends & Insights

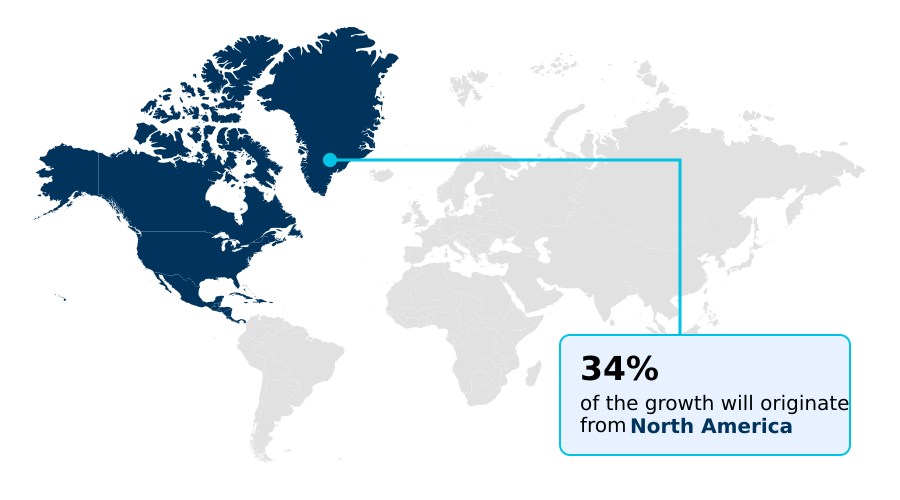
  • North America dominated the market and accounted for a 33.8% growth during the forecast period.
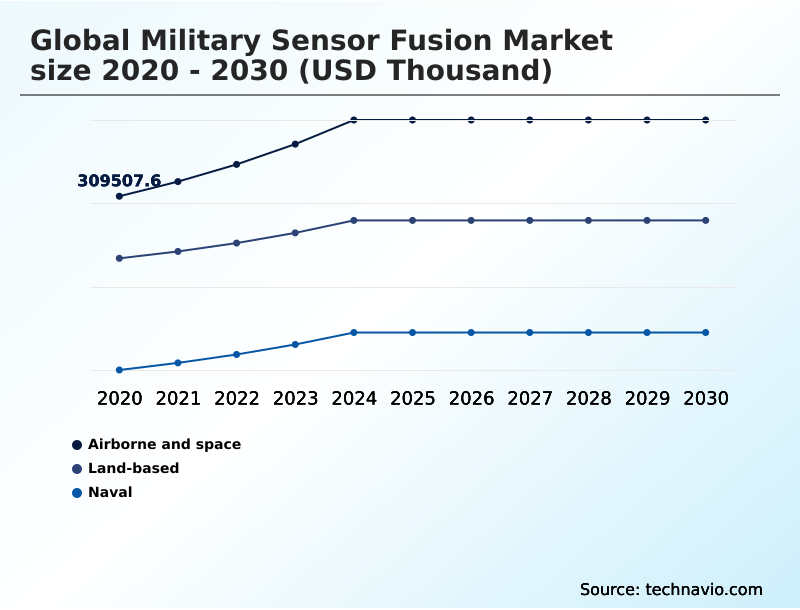
  • By Platform - Airborne and space segment was valued at USD 371.98 million in 2024
  • By Type - Radar segment accounted for the largest market revenue share in 2024

Market Size & Forecast

  • Market Opportunities:
  • Market Future Opportunities: USD 311.78 million
  • CAGR from 2025 to 2030 : 6.1%

Market Summary

  • The military sensor fusion market is crucial for modern warfare, integrating data from diverse sensors like radar, EO/IR, and sonar to create a unified operational picture. Key drivers include the necessity for superior enhanced situational awareness in multi-domain operations and the proliferation of unmanned systems.
  • The integration of artificial intelligence and machine learning is a pivotal driver, enabling automated target recognition (ATR) and predictive threat analysis to manage the overwhelming data from systems like multi-spectral imaging arrays.
  • For instance, in a naval scenario, a fleet's battlefield management system can fuse subsurface acoustic intelligence from an AUV with synthetic aperture radar (SAR) data from a patrol aircraft to generate a weapon-quality track on a hostile submarine, a task impossible for a single platform.
  • Key trends include the shift to open systems architecture for improved interoperability standards and the development of quantum sensing technology for navigation in signal-denied environments. However, challenges such as high integration costs, processing latency, and vulnerability to electronic warfare (EW) persist. Addressing the need for cyber-resilient networks and managing lifecycle costs are critical for sustained adoption and operational success.

What will be the Size of the Military Sensor Fusion Market during the forecast period?

Get Key Insights on Market Forecast (PDF) Request Free Sample

How is the Military Sensor Fusion Market Segmented?

The military sensor fusion industry research report provides comprehensive data (region-wise segment analysis), with forecasts and estimates in "USD thousand" for the period 2026-2030, as well as historical data from 2020-2024 for the following segments.

  • Platform
    • Airborne and space
    • Land-based
    • Naval
  • Type
    • Radar
    • Electro optical and infrared
    • Electronic warfare
    • Sonar
  • Application
    • ISR
    • Situational awareness
    • Target tracking
    • Battlefield management
  • Geography
    • North America
      • US
      • Canada
      • Mexico
    • Europe
      • Germany
      • France
      • UK
    • APAC
      • China
      • Japan
      • India
    • Middle East and Africa
      • Saudi Arabia
      • Israel
      • UAE
    • South America
      • Brazil
      • Argentina
      • Colombia
    • Rest of World (ROW)

By Platform Insights

The airborne and space segment is estimated to witness significant growth during the forecast period.

The airborne platform segment is defined by capital-intensive programs integrating technologies like active electronically scanned array (AESA) and hypersonic and ballistic tracking systems.

For successful multi-domain operations, platforms must utilize synthetic aperture radar (SAR) and phased-array radar to provide a common operating picture (COP). The use of advanced tactical data links enables real-time decision support, enhancing command and control (C2) agility.

This integration is critical for achieving an information dominance strategy and maintaining persistent surveillance capabilities. Onboard edge computing hardware is essential for processing data from electro-optical/infrared (EO/IR) systems, achieving target acquisition speed in contested environments.

Retrofitting legacy fleets with these capabilities often increases lifecycle costs by over 25%.

Request Free Sample

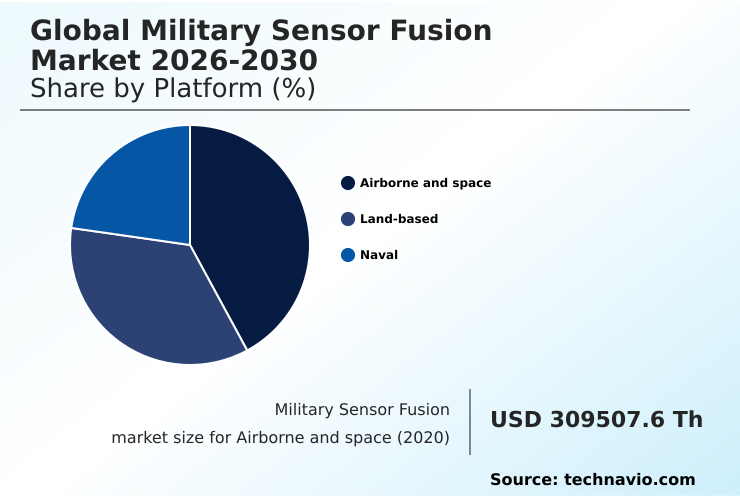
The Airborne and space segment was valued at USD 371.98 million in 2024 and showed a gradual increase during the forecast period.

Request Free Sample

Regional Analysis

North America is estimated to contribute 33.8% to the growth of the global market during the forecast period.Technavio’s analysts have elaborately explained the regional trends and drivers that shape the market during the forecast period.

See How Military Sensor Fusion Market Demand is Rising in North America Request Free Sample

The North America region leads the market, driven by substantial defense spending on battlefield management systems and modernization programs focused on cooperative engagement capability (CEC). This region's focus on weapon-quality track generation results in a 5.8% growth rate.

However, the APAC region is forecast to expand at a much faster rate of 7.6%, fueled by indigenous development of millimeter-wave radar, acoustic sensor arrays, and technologies for subsurface acoustic intelligence.

This push for self-reliance addresses unique regional needs for anti-access/area denial (A2/AD) capabilities.

European efforts often involve multinational collaboration on systems using multi-static radar configurations and time difference of arrival (TDOA) techniques for passive surveillance techniques, emphasizing shared development to manage costs and enhance coalition effectiveness.

Market Dynamics

Our researchers analyzed the data with 2025 as the base year, along with the key drivers, trends, and challenges. A holistic analysis of drivers will help companies refine their marketing strategies to gain a competitive advantage.

  • The strategic implementation of military sensor fusion is rapidly evolving, driven by specific operational demands across different domains. A primary focus is on sensor fusion for dismounted soldiers, where miniaturized systems provide unprecedented situational awareness. Concurrently, the use of AI in military target tracking is revolutionizing air and missile defense, improving accuracy and reducing response times.
  • The proliferation of autonomous platforms makes sensor fusion for unmanned systems and sensor fusion for autonomous vehicles critical for navigation and mission execution in contested environments. In naval contexts, data fusion in naval warfare, which combines acoustic and non-acoustic sensor fusion, is key to maintaining undersea dominance.
  • Similarly, sensor fusion for missile defense is paramount for national security, requiring the seamless integration of ground-based and space-based assets. Emerging fields like quantum sensing for secure navigation promise to overcome GPS vulnerabilities.
  • The core technology relies on robust sensor data fusion algorithms, such as the Kalman filter for target tracking, which are increasingly processed at the tactical edge through edge computing for sensor fusion. Adopting an open architecture for sensor integration is essential for managing multi-domain sensor fusion challenges and avoiding vendor lock-in.
  • The benefits of military sensor fusion, especially in providing enhanced sensor fusion for situational awareness, are undeniable. However, significant challenges in multi-sensor data fusion persist, particularly in complex scenarios like sensor fusion for urban warfare or coordinating data from UAV swarms.
  • These challenges are also present in sensor fusion in electronic warfare, where distinguishing between hostile and friendly signals is crucial. Finally, integrating disparate sensor types, such as combining radar and EO/IR sensor fusion, remains a complex but vital task, with advanced platforms showing a 30% faster target engagement cycle compared to legacy, non-integrated systems.

What are the key market drivers leading to the rise in the adoption of Military Sensor Fusion Industry?

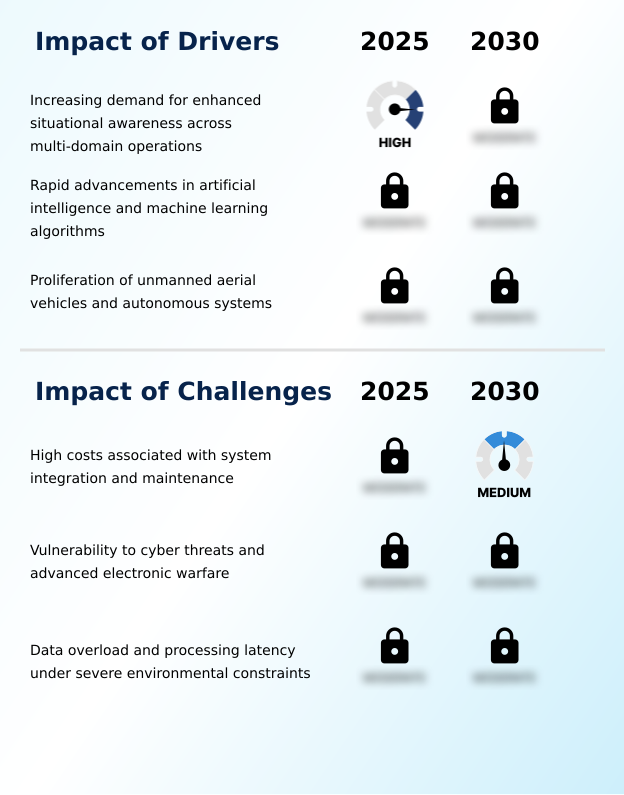
  • The increasing demand for enhanced situational awareness across multi-domain operations is a key driver fueling market growth.

  • The drive for enhanced situational awareness in joint all-domain command and control (JADC2) frameworks is a primary market driver.
  • The proliferation of unmanned surface vessels (USV) and autonomous underwater vehicles (AUV) demands sophisticated fusion for autonomous navigation and asymmetric threat detection. The integration of AI and cognitive radar systems allows for dynamic spectrum management and electromagnetic spectrum dominance.
  • This advanced processing, using methods like Kalman filtering algorithms, improves threat classification accuracy and enables predictive threat analysis. For instance, AI-driven fusion engines have demonstrated a 60% improvement in distinguishing hostile targets from civilian traffic in dense scenarios.
  • This leads to network-centric warfare and effective counter-UAV measures.

What are the market trends shaping the Military Sensor Fusion Industry?

  • The miniaturization of micro-electromechanical systems is a significant trend, enabling advanced sensor fusion capabilities for dismounted soldier applications.

  • A major market trend is the move toward open systems architecture, enabling rapid technology insertion and improved interoperability standards. This modularity supports the integration of next-generation quantum sensing technology for resilient navigation and timing (PNT) in signal-denied environments. The miniaturization of components like inertial measurement units (IMU) is facilitating deployment on unmanned aerial vehicle (UAV) swarms and dismounted soldiers.
  • These smaller systems utilize augmented reality overlays to reduce cognitive load and enhance human-machine teaming. The adoption of these architectures has been shown to reduce platform modernization timelines by up to 40%, a significant improvement over proprietary systems. This shift promotes platform modernization programs and unmanned systems integration.

What challenges does the Military Sensor Fusion Industry face during its growth?

  • High costs associated with system integration and lifecycle maintenance present a key challenge to market growth.

  • A key challenge is data overload mitigation, as multi-spectral imaging and distributed aperture systems (DAS) generate immense data volumes. This can lead to significant processing latency reduction issues, which are critical in fast-paced engagements. The high costs associated with lifecycle cost management and ensuring supply chain security for microelectronics present considerable financial hurdles.
  • Moreover, integrated systems are vulnerable to cyberattacks, requiring robust cyber-resilient networks. For example, integrating a new electronic warfare (EW) support measures suite can require a 15% increase in a platform's power and cooling capacity. Protecting low probability of intercept (LPI) signals and ensuring effective combat identification (CID) in a contested electromagnetic environment remain complex technical challenges for multi-domain battle management.

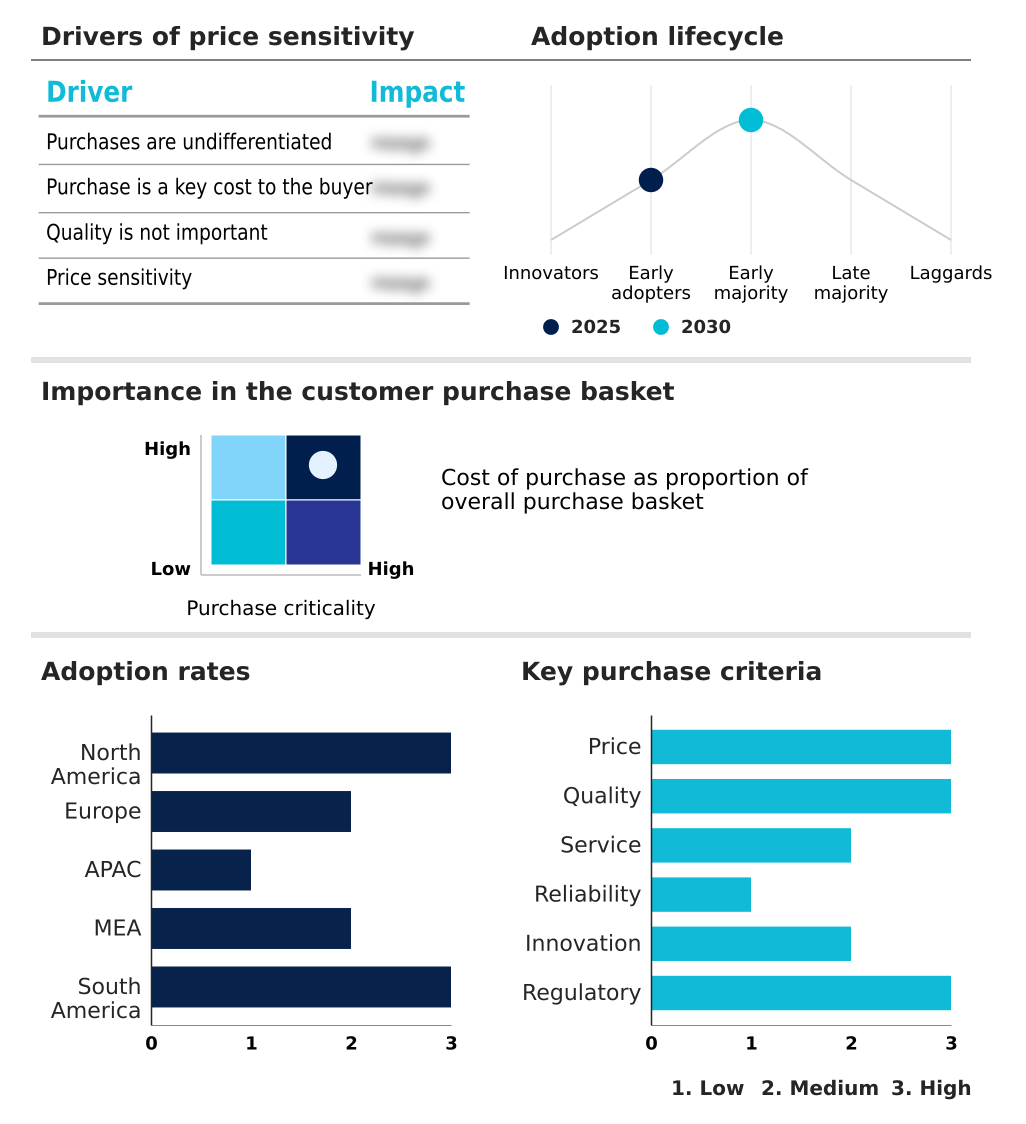
Exclusive Technavio Analysis on Customer Landscape

The military sensor fusion market forecasting report includes the adoption lifecycle of the market, covering from the innovator’s stage to the laggard’s stage. It focuses on adoption rates in different regions based on penetration. Furthermore, the military sensor fusion market report also includes key purchase criteria and drivers of price sensitivity to help companies evaluate and develop their market growth analysis strategies.

Customer Landscape of Military Sensor Fusion Industry

Competitive Landscape

Companies are implementing various strategies, such as strategic alliances, military sensor fusion market forecast, partnerships, mergers and acquisitions, geographical expansion, and product/service launches, to enhance their presence in the industry.

ASELSAN AS - Provides integrated combat management systems and multi-sensor fusion radar, specializing in advanced data synthesis for enhanced operational command and control.

The industry research and growth report includes detailed analyses of the competitive landscape of the market and information about key companies, including:

  • ASELSAN AS
  • BAE Systems Plc
  • CACI International Inc.
  • Elbit Systems Ltd.
  • General Dynamics Corp.
  • HENSOLDT AG
  • Indra Sistemas SA
  • Kongsberg Gruppen ASA
  • L3Harris Technologies Inc.
  • Leidos Holdings Inc.
  • Leonardo S.p.A.
  • Lockheed Martin Corp.
  • Northrop Grumman Corp.
  • Palantir Technologies Inc.
  • QinetiQ Ltd.
  • Rheinmetall AG
  • RTX Corp.
  • Saab AB
  • Textron Systems
  • The Boeing Co.

Qualitative and quantitative analysis of companies has been conducted to help clients understand the wider business environment as well as the strengths and weaknesses of key industry players. Data is qualitatively analyzed to categorize companies as pure play, category-focused, industry-focused, and diversified; it is quantitatively analyzed to categorize companies as dominant, leading, strong, tentative, and weak.

Recent Development and News in Military sensor fusion market

  • In May 2025, L3Harris Technologies and Thales Group launched development of a combined short-range air defense system designed to counter emerging aerial threats.
  • In April 2025, L3Harris Technologies announced its advanced missile-tracking sensor, developed under the Hypersonic and Ballistic Tracking Space Sensor (HBTSS) initiative, reached maturity for full-rate production.
  • In January 2025, Lockheed Martin Corp. secured a significant contract modification to upgrade the Aegis Combat System, enhancing its sensor fusion capabilities for multi-mission surface combatants.
  • In November 2024, Northrop Grumman Corp. announced a successful demonstration of its Integrated Battle Command System (IBCS), showcasing enhanced sensor data fusion from multiple disparate systems in a complex, simulated threat environment.

Dive into Technavio’s robust research methodology, blending expert interviews, extensive data synthesis, and validated models for unparalleled Military Sensor Fusion Market insights. See full methodology.

Market Scope
Page number 311
Base year 2025
Historic period 2020-2024
Forecast period 2026-2030
Growth momentum & CAGR Accelerate at a CAGR of 6.1%
Market growth 2026-2030 USD 311775.6 thousand
Market structure Fragmented
YoY growth 2025-2026(%) 5.7%
Key countries US, Canada, Mexico, Germany, France, UK, Italy, Spain, The Netherlands, China, Japan, India, South Korea, Australia, Indonesia, Saudi Arabia, Israel, UAE, Turkey, South Africa, Brazil, Argentina and Colombia
Competitive landscape Leading Companies, Market Positioning of Companies, Competitive Strategies, and Industry Risks

Request Free Sample

Research Analyst Overview

  • The military sensor fusion market is defined by the integration of sophisticated hardware and software to achieve dominance in multi-domain operations. Core technologies like active electronically scanned array (AESA) and phased-array radar are fundamental, providing the raw data for advanced processing.
  • The strategic push towards joint all-domain command and control (JADC2) necessitates the fusion of inputs from electro-optical/infrared (EO/IR) systems, synthetic aperture radar (SAR), and electronic warfare (EW) support measures. This creates a unified common operating picture (COP), which is essential for modern battlefield management systems.
  • A key boardroom-level consideration is the adoption of open systems architecture, which can reduce long-term sustainment costs by over 20% by enabling modular upgrades. The development of hypersonic and ballistic tracking capabilities, alongside cognitive radar systems, addresses emerging high-speed threats. For undersea warfare, combining acoustic sensor arrays with magnetic anomaly detectors (MAD) is critical.
  • On land and in the air, the fusion of inertial measurement units (IMU) with quantum sensing technology ensures navigation resilience. This complex data synthesis, managed by powerful edge computing hardware and shared via tactical data links, is the cornerstone of future military superiority, involving platforms from unmanned aerial vehicle (UAV) swarms to autonomous underwater vehicles (AUV).

What are the Key Data Covered in this Military Sensor Fusion Market Research and Growth Report?

  • What is the expected growth of the Military Sensor Fusion Market between 2026 and 2030?

    • USD 311.78 million, at a CAGR of 6.1%

  • What segmentation does the market report cover?

    • The report is segmented by Platform (Airborne and space, Land-based, and Naval), Type (Radar, Electro optical and infrared, Electronic warfare, and Sonar), Application (ISR, Situational awareness, Target tracking, and Battlefield management) and Geography (North America, Europe, APAC, Middle East and Africa, South America)

  • Which regions are analyzed in the report?

    • North America, Europe, APAC, Middle East and Africa and South America

  • What are the key growth drivers and market challenges?

    • Increasing demand for enhanced situational awareness across multi-domain operations, High costs associated with system integration and maintenance

  • Who are the major players in the Military Sensor Fusion Market?

    • ASELSAN AS, BAE Systems Plc, CACI International Inc., Elbit Systems Ltd., General Dynamics Corp., HENSOLDT AG, Indra Sistemas SA, Kongsberg Gruppen ASA, L3Harris Technologies Inc., Leidos Holdings Inc., Leonardo S.p.A., Lockheed Martin Corp., Northrop Grumman Corp., Palantir Technologies Inc., QinetiQ Ltd., Rheinmetall AG, RTX Corp., Saab AB, Textron Systems and The Boeing Co.

Market Research Insights

  • The dynamics of the military sensor fusion market are shaped by the imperative for an information dominance strategy and command and control (C2) agility. The adoption of network-centric warfare principles has led to a 40% increase in demand for platforms with robust unmanned systems integration.
  • Achieving enhanced situational awareness is paramount, with advanced fusion algorithms demonstrating a 60% improvement in threat classification accuracy in cluttered environments. This capability directly supports real-time decision support and reduces the cognitive load on operators by over 50%.
  • While these systems are critical for operations in degraded visual environments and achieving electromagnetic spectrum dominance, ensuring robust cyber-resilient networks and effective interoperability standards across allied forces remain key focus areas for defense organizations.

We can help! Our analysts can customize this military sensor fusion market research report to meet your requirements.

Get in touch

1. Executive Summary

1.1 Market overview

Executive Summary - Chart on Market Overview
Executive Summary - Data Table on Market Overview
Executive Summary - Chart on Global Market Characteristics
Executive Summary - Chart on Market by Geography
Executive Summary - Chart on Market Segmentation by Platform
Executive Summary - Chart on Market Segmentation by Type
Executive Summary - Chart on Market Segmentation by Application
Executive Summary - Chart on Incremental Growth
Executive Summary - Data Table on Incremental Growth
Executive Summary - Chart on Company Market Positioning

2. Technavio Analysis

2.1 Analysis of price sensitivity, lifecycle, customer purchase basket, adoption rates, and purchase criteria

2.2 Criticality of inputs and Factors of differentiation

Chart on Overview on criticality of inputs and factors of differentiation

2.3 Factors of disruption

Chart on Overview on factors of disruption

2.4 Impact of drivers and challenges

Chart on Impact of drivers and challenges in 2025 and 2030

3. Market Landscape

3.1 Market ecosystem

Chart on Parent Market
Data Table on - Parent Market

3.2 Market characteristics

Chart on Market characteristics analysis

3.3 Value chain analysis

Chart on Value chain analysis

4. Market Sizing

4.1 Market definition

Data Table on Offerings of companies included in the market definition

4.2 Market segment analysis

Market segments

4.3 Market size 2025

4.4 Market outlook: Forecast for 2025-2030

Chart on Global - Market size and forecast 2025-2030 ($ thousand)
Data Table on Global - Market size and forecast 2025-2030 ($ thousand)
Chart on Global Market: Year-over-year growth 2025-2030 (%)
Data Table on Global Market: Year-over-year growth 2025-2030 (%)

5. Historic Market Size

5.1 Global Military Sensor Fusion Market 2020 - 2024

Historic Market Size - Data Table on Global Military Sensor Fusion Market 2020 - 2024 ($ thousand)

5.2 Platform segment analysis 2020 - 2024

Historic Market Size - Platform Segment 2020 - 2024 ($ thousand)

5.3 Type segment analysis 2020 - 2024

Historic Market Size - Type Segment 2020 - 2024 ($ thousand)

5.4 Application segment analysis 2020 - 2024

Historic Market Size - Application Segment 2020 - 2024 ($ thousand)

5.5 Geography segment analysis 2020 - 2024

Historic Market Size - Geography Segment 2020 - 2024 ($ thousand)

5.6 Country segment analysis 2020 - 2024

Historic Market Size - Country Segment 2020 - 2024 ($ thousand)

6. Qualitative Analysis

6.1 Impact of AI on Global Military Sensor Fusion Market

6.2 Impact of Geopolitical Conflicts on Global Military Sensor Fusion Market

7. Five Forces Analysis

7.1 Five forces summary

Five forces analysis - Comparison between 2025 and 2030

7.2 Bargaining power of buyers

Bargaining power of buyers - Impact of key factors 2025 and 2030

7.3 Bargaining power of suppliers

Bargaining power of suppliers - Impact of key factors in 2025 and 2030

7.4 Threat of new entrants

Threat of new entrants - Impact of key factors in 2025 and 2030

7.5 Threat of substitutes

Threat of substitutes - Impact of key factors in 2025 and 2030

7.6 Threat of rivalry

Threat of rivalry - Impact of key factors in 2025 and 2030

7.7 Market condition

Chart on Market condition - Five forces 2025 and 2030

8. Market Segmentation by Platform

8.1 Market segments

Chart on Platform - Market share 2025-2030 (%)
Data Table on Platform - Market share 2025-2030 (%)

8.2 Comparison by Platform

Chart on Comparison by Platform
Data Table on Comparison by Platform

8.3 Airborne and space - Market size and forecast 2025-2030

Chart on Airborne and space - Market size and forecast 2025-2030 ($ thousand)
Data Table on Airborne and space - Market size and forecast 2025-2030 ($ thousand)
Chart on Airborne and space - Year-over-year growth 2025-2030 (%)
Data Table on Airborne and space - Year-over-year growth 2025-2030 (%)

8.4 Land-based - Market size and forecast 2025-2030

Chart on Land-based - Market size and forecast 2025-2030 ($ thousand)
Data Table on Land-based - Market size and forecast 2025-2030 ($ thousand)
Chart on Land-based - Year-over-year growth 2025-2030 (%)
Data Table on Land-based - Year-over-year growth 2025-2030 (%)

8.5 Naval - Market size and forecast 2025-2030

Chart on Naval - Market size and forecast 2025-2030 ($ thousand)
Data Table on Naval - Market size and forecast 2025-2030 ($ thousand)
Chart on Naval - Year-over-year growth 2025-2030 (%)
Data Table on Naval - Year-over-year growth 2025-2030 (%)

8.6 Market opportunity by Platform

Market opportunity by Platform ($ thousand)
Data Table on Market opportunity by Platform ($ thousand)

9. Market Segmentation by Type

9.1 Market segments

Chart on Type - Market share 2025-2030 (%)
Data Table on Type - Market share 2025-2030 (%)

9.2 Comparison by Type

Chart on Comparison by Type
Data Table on Comparison by Type

9.3 Radar - Market size and forecast 2025-2030

Chart on Radar - Market size and forecast 2025-2030 ($ thousand)
Data Table on Radar - Market size and forecast 2025-2030 ($ thousand)
Chart on Radar - Year-over-year growth 2025-2030 (%)
Data Table on Radar - Year-over-year growth 2025-2030 (%)

9.4 Electro optical and infrared - Market size and forecast 2025-2030

Chart on Electro optical and infrared - Market size and forecast 2025-2030 ($ thousand)
Data Table on Electro optical and infrared - Market size and forecast 2025-2030 ($ thousand)
Chart on Electro optical and infrared - Year-over-year growth 2025-2030 (%)
Data Table on Electro optical and infrared - Year-over-year growth 2025-2030 (%)

9.5 Electronic warfare - Market size and forecast 2025-2030

Chart on Electronic warfare - Market size and forecast 2025-2030 ($ thousand)
Data Table on Electronic warfare - Market size and forecast 2025-2030 ($ thousand)
Chart on Electronic warfare - Year-over-year growth 2025-2030 (%)
Data Table on Electronic warfare - Year-over-year growth 2025-2030 (%)

9.6 Sonar - Market size and forecast 2025-2030

Chart on Sonar - Market size and forecast 2025-2030 ($ thousand)
Data Table on Sonar - Market size and forecast 2025-2030 ($ thousand)
Chart on Sonar - Year-over-year growth 2025-2030 (%)
Data Table on Sonar - Year-over-year growth 2025-2030 (%)

9.7 Market opportunity by Type

Market opportunity by Type ($ thousand)
Data Table on Market opportunity by Type ($ thousand)

10. Market Segmentation by Application

10.1 Market segments

Chart on Application - Market share 2025-2030 (%)
Data Table on Application - Market share 2025-2030 (%)

10.2 Comparison by Application

Chart on Comparison by Application
Data Table on Comparison by Application

10.3 ISR - Market size and forecast 2025-2030

Chart on ISR - Market size and forecast 2025-2030 ($ thousand)
Data Table on ISR - Market size and forecast 2025-2030 ($ thousand)
Chart on ISR - Year-over-year growth 2025-2030 (%)
Data Table on ISR - Year-over-year growth 2025-2030 (%)

10.4 Situational awareness - Market size and forecast 2025-2030

Chart on Situational awareness - Market size and forecast 2025-2030 ($ thousand)
Data Table on Situational awareness - Market size and forecast 2025-2030 ($ thousand)
Chart on Situational awareness - Year-over-year growth 2025-2030 (%)
Data Table on Situational awareness - Year-over-year growth 2025-2030 (%)

10.5 Target tracking - Market size and forecast 2025-2030

Chart on Target tracking - Market size and forecast 2025-2030 ($ thousand)
Data Table on Target tracking - Market size and forecast 2025-2030 ($ thousand)
Chart on Target tracking - Year-over-year growth 2025-2030 (%)
Data Table on Target tracking - Year-over-year growth 2025-2030 (%)

10.6 Battlefield management - Market size and forecast 2025-2030

Chart on Battlefield management - Market size and forecast 2025-2030 ($ thousand)
Data Table on Battlefield management - Market size and forecast 2025-2030 ($ thousand)
Chart on Battlefield management - Year-over-year growth 2025-2030 (%)
Data Table on Battlefield management - Year-over-year growth 2025-2030 (%)

10.7 Market opportunity by Application

Market opportunity by Application ($ thousand)
Data Table on Market opportunity by Application ($ thousand)

11. Customer Landscape

11.1 Customer landscape overview

Analysis of price sensitivity, lifecycle, customer purchase basket, adoption rates, and purchase criteria

12. Geographic Landscape

12.1 Geographic segmentation

Chart on Market share by geography 2025-2030 (%)
Data Table on Market share by geography 2025-2030 (%)

12.2 Geographic comparison

Chart on Geographic comparison
Data Table on Geographic comparison

12.3 North America - Market size and forecast 2025-2030

Chart on North America - Market size and forecast 2025-2030 ($ thousand)
Data Table on North America - Market size and forecast 2025-2030 ($ thousand)
Chart on North America - Year-over-year growth 2025-2030 (%)
Data Table on North America - Year-over-year growth 2025-2030 (%)
Chart on Regional Comparison - North America
Data Table on Regional Comparison - North America

12.3.1 US - Market size and forecast 2025-2030

Chart on US - Market size and forecast 2025-2030 ($ thousand)
Data Table on US - Market size and forecast 2025-2030 ($ thousand)
Chart on US - Year-over-year growth 2025-2030 (%)
Data Table on US - Year-over-year growth 2025-2030 (%)

12.3.2 Canada - Market size and forecast 2025-2030

Chart on Canada - Market size and forecast 2025-2030 ($ thousand)
Data Table on Canada - Market size and forecast 2025-2030 ($ thousand)
Chart on Canada - Year-over-year growth 2025-2030 (%)
Data Table on Canada - Year-over-year growth 2025-2030 (%)

12.3.3 Mexico - Market size and forecast 2025-2030

Chart on Mexico - Market size and forecast 2025-2030 ($ thousand)
Data Table on Mexico - Market size and forecast 2025-2030 ($ thousand)
Chart on Mexico - Year-over-year growth 2025-2030 (%)
Data Table on Mexico - Year-over-year growth 2025-2030 (%)

12.4 Europe - Market size and forecast 2025-2030

Chart on Europe - Market size and forecast 2025-2030 ($ thousand)
Data Table on Europe - Market size and forecast 2025-2030 ($ thousand)
Chart on Europe - Year-over-year growth 2025-2030 (%)
Data Table on Europe - Year-over-year growth 2025-2030 (%)
Chart on Regional Comparison - Europe
Data Table on Regional Comparison - Europe

12.4.1 Germany - Market size and forecast 2025-2030

Chart on Germany - Market size and forecast 2025-2030 ($ thousand)
Data Table on Germany - Market size and forecast 2025-2030 ($ thousand)
Chart on Germany - Year-over-year growth 2025-2030 (%)
Data Table on Germany - Year-over-year growth 2025-2030 (%)

12.4.2 France - Market size and forecast 2025-2030

Chart on France - Market size and forecast 2025-2030 ($ thousand)
Data Table on France - Market size and forecast 2025-2030 ($ thousand)
Chart on France - Year-over-year growth 2025-2030 (%)
Data Table on France - Year-over-year growth 2025-2030 (%)

12.4.3 UK - Market size and forecast 2025-2030

Chart on UK - Market size and forecast 2025-2030 ($ thousand)
Data Table on UK - Market size and forecast 2025-2030 ($ thousand)
Chart on UK - Year-over-year growth 2025-2030 (%)
Data Table on UK - Year-over-year growth 2025-2030 (%)

12.4.4 Italy - Market size and forecast 2025-2030

Chart on Italy - Market size and forecast 2025-2030 ($ thousand)
Data Table on Italy - Market size and forecast 2025-2030 ($ thousand)
Chart on Italy - Year-over-year growth 2025-2030 (%)
Data Table on Italy - Year-over-year growth 2025-2030 (%)

12.4.5 Spain - Market size and forecast 2025-2030

Chart on Spain - Market size and forecast 2025-2030 ($ thousand)
Data Table on Spain - Market size and forecast 2025-2030 ($ thousand)
Chart on Spain - Year-over-year growth 2025-2030 (%)
Data Table on Spain - Year-over-year growth 2025-2030 (%)

12.4.6 The Netherlands - Market size and forecast 2025-2030

Chart on The Netherlands - Market size and forecast 2025-2030 ($ thousand)
Data Table on The Netherlands - Market size and forecast 2025-2030 ($ thousand)
Chart on The Netherlands - Year-over-year growth 2025-2030 (%)
Data Table on The Netherlands - Year-over-year growth 2025-2030 (%)

12.5 APAC - Market size and forecast 2025-2030

Chart on APAC - Market size and forecast 2025-2030 ($ thousand)
Data Table on APAC - Market size and forecast 2025-2030 ($ thousand)
Chart on APAC - Year-over-year growth 2025-2030 (%)
Data Table on APAC - Year-over-year growth 2025-2030 (%)
Chart on Regional Comparison - APAC
Data Table on Regional Comparison - APAC

12.5.1 China - Market size and forecast 2025-2030

Chart on China - Market size and forecast 2025-2030 ($ thousand)
Data Table on China - Market size and forecast 2025-2030 ($ thousand)
Chart on China - Year-over-year growth 2025-2030 (%)
Data Table on China - Year-over-year growth 2025-2030 (%)

12.5.2 Japan - Market size and forecast 2025-2030

Chart on Japan - Market size and forecast 2025-2030 ($ thousand)
Data Table on Japan - Market size and forecast 2025-2030 ($ thousand)
Chart on Japan - Year-over-year growth 2025-2030 (%)
Data Table on Japan - Year-over-year growth 2025-2030 (%)

12.5.3 India - Market size and forecast 2025-2030

Chart on India - Market size and forecast 2025-2030 ($ thousand)
Data Table on India - Market size and forecast 2025-2030 ($ thousand)
Chart on India - Year-over-year growth 2025-2030 (%)
Data Table on India - Year-over-year growth 2025-2030 (%)

12.5.4 South Korea - Market size and forecast 2025-2030

Chart on South Korea - Market size and forecast 2025-2030 ($ thousand)
Data Table on South Korea - Market size and forecast 2025-2030 ($ thousand)
Chart on South Korea - Year-over-year growth 2025-2030 (%)
Data Table on South Korea - Year-over-year growth 2025-2030 (%)

12.5.5 Australia - Market size and forecast 2025-2030

Chart on Australia - Market size and forecast 2025-2030 ($ thousand)
Data Table on Australia - Market size and forecast 2025-2030 ($ thousand)
Chart on Australia - Year-over-year growth 2025-2030 (%)
Data Table on Australia - Year-over-year growth 2025-2030 (%)

12.5.6 Indonesia - Market size and forecast 2025-2030

Chart on Indonesia - Market size and forecast 2025-2030 ($ thousand)
Data Table on Indonesia - Market size and forecast 2025-2030 ($ thousand)
Chart on Indonesia - Year-over-year growth 2025-2030 (%)
Data Table on Indonesia - Year-over-year growth 2025-2030 (%)

12.6 Middle East and Africa - Market size and forecast 2025-2030

Chart on Middle East and Africa - Market size and forecast 2025-2030 ($ thousand)
Data Table on Middle East and Africa - Market size and forecast 2025-2030 ($ thousand)
Chart on Middle East and Africa - Year-over-year growth 2025-2030 (%)
Data Table on Middle East and Africa - Year-over-year growth 2025-2030 (%)
Chart on Regional Comparison - Middle East and Africa
Data Table on Regional Comparison - Middle East and Africa

12.6.1 Saudi Arabia - Market size and forecast 2025-2030

Chart on Saudi Arabia - Market size and forecast 2025-2030 ($ thousand)
Data Table on Saudi Arabia - Market size and forecast 2025-2030 ($ thousand)
Chart on Saudi Arabia - Year-over-year growth 2025-2030 (%)
Data Table on Saudi Arabia - Year-over-year growth 2025-2030 (%)

12.6.2 Israel - Market size and forecast 2025-2030

Chart on Israel - Market size and forecast 2025-2030 ($ thousand)
Data Table on Israel - Market size and forecast 2025-2030 ($ thousand)
Chart on Israel - Year-over-year growth 2025-2030 (%)
Data Table on Israel - Year-over-year growth 2025-2030 (%)

12.6.3 UAE - Market size and forecast 2025-2030

Chart on UAE - Market size and forecast 2025-2030 ($ thousand)
Data Table on UAE - Market size and forecast 2025-2030 ($ thousand)
Chart on UAE - Year-over-year growth 2025-2030 (%)
Data Table on UAE - Year-over-year growth 2025-2030 (%)

12.6.4 Turkey - Market size and forecast 2025-2030

Chart on Turkey - Market size and forecast 2025-2030 ($ thousand)
Data Table on Turkey - Market size and forecast 2025-2030 ($ thousand)
Chart on Turkey - Year-over-year growth 2025-2030 (%)
Data Table on Turkey - Year-over-year growth 2025-2030 (%)

12.6.5 South Africa - Market size and forecast 2025-2030

Chart on South Africa - Market size and forecast 2025-2030 ($ thousand)
Data Table on South Africa - Market size and forecast 2025-2030 ($ thousand)
Chart on South Africa - Year-over-year growth 2025-2030 (%)
Data Table on South Africa - Year-over-year growth 2025-2030 (%)

12.7 South America - Market size and forecast 2025-2030

Chart on South America - Market size and forecast 2025-2030 ($ thousand)
Data Table on South America - Market size and forecast 2025-2030 ($ thousand)
Chart on South America - Year-over-year growth 2025-2030 (%)
Data Table on South America - Year-over-year growth 2025-2030 (%)
Chart on Regional Comparison - South America
Data Table on Regional Comparison - South America

12.7.1 Brazil - Market size and forecast 2025-2030

Chart on Brazil - Market size and forecast 2025-2030 ($ thousand)
Data Table on Brazil - Market size and forecast 2025-2030 ($ thousand)
Chart on Brazil - Year-over-year growth 2025-2030 (%)
Data Table on Brazil - Year-over-year growth 2025-2030 (%)

12.7.2 Argentina - Market size and forecast 2025-2030

Chart on Argentina - Market size and forecast 2025-2030 ($ thousand)
Data Table on Argentina - Market size and forecast 2025-2030 ($ thousand)
Chart on Argentina - Year-over-year growth 2025-2030 (%)
Data Table on Argentina - Year-over-year growth 2025-2030 (%)

12.7.3 Colombia - Market size and forecast 2025-2030

Chart on Colombia - Market size and forecast 2025-2030 ($ thousand)
Data Table on Colombia - Market size and forecast 2025-2030 ($ thousand)
Chart on Colombia - Year-over-year growth 2025-2030 (%)
Data Table on Colombia - Year-over-year growth 2025-2030 (%)

12.8 Market opportunity by geography

Market opportunity by geography ($ thousand)
Data Tables on Market opportunity by geography ($ thousand)

13. Drivers, Challenges, and Opportunity

13.1 Market drivers

Increasing demand for enhanced situational awareness across multi-domain operations
Rapid advancements in artificial intelligence and machine learning algorithms
Proliferation of unmanned aerial vehicles and autonomous systems

13.2 Market challenges

High costs associated with system integration and maintenance
Vulnerability to cyber threats and advanced electronic warfare
Data overload and processing latency under severe environmental constraints

13.3 Impact of drivers and challenges

Impact of drivers and challenges in 2025 and 2030

13.4 Market opportunities

Miniaturization of micro-electromechanical systems for dismounted soldier applications
Transition toward open systems architecture and modular frameworks
Implementation of quantum sensing technologies for secure navigation and targeting

14. Competitive Landscape

14.1 Overview

14.2

Overview on criticality of inputs and factors of differentiation

14.3 Landscape disruption

Overview on factors of disruption

14.4 Industry risks

Impact of key risks on business

15. Competitive Analysis

15.1 Companies profiled

Companies covered

15.2 Company ranking index

15.3 Market positioning of companies

Matrix on companies position and classification

15.4 ASELSAN AS

ASELSAN AS - Overview
ASELSAN AS - Product / Service
ASELSAN AS - Key offerings
SWOT

15.5 BAE Systems Plc

BAE Systems Plc - Overview
BAE Systems Plc - Business segments
BAE Systems Plc - Key offerings
BAE Systems Plc - Segment focus
SWOT

15.6 CACI International Inc.

CACI International Inc. - Overview
CACI International Inc. - Business segments
CACI International Inc. - Key offerings
CACI International Inc. - Segment focus
SWOT

15.7 Elbit Systems Ltd.

Elbit Systems Ltd. - Overview
Elbit Systems Ltd. - Business segments
Elbit Systems Ltd. - Key offerings
Elbit Systems Ltd. - Segment focus
SWOT

15.8 General Dynamics Corp.

General Dynamics Corp. - Overview
General Dynamics Corp. - Business segments
General Dynamics Corp. - Key offerings
General Dynamics Corp. - Segment focus
SWOT

15.9 HENSOLDT AG

HENSOLDT AG - Overview
HENSOLDT AG - Business segments
HENSOLDT AG - Key news
HENSOLDT AG - Key offerings
HENSOLDT AG - Segment focus
SWOT

15.10 Indra Sistemas SA

Indra Sistemas SA - Overview
Indra Sistemas SA - Business segments
Indra Sistemas SA - Key offerings
Indra Sistemas SA - Segment focus
SWOT

15.11 Kongsberg Gruppen ASA

Kongsberg Gruppen ASA - Overview
Kongsberg Gruppen ASA - Business segments
Kongsberg Gruppen ASA - Key offerings
Kongsberg Gruppen ASA - Segment focus
SWOT

15.12 L3Harris Technologies Inc.

L3Harris Technologies Inc. - Overview
L3Harris Technologies Inc. - Business segments
L3Harris Technologies Inc. - Key offerings
L3Harris Technologies Inc. - Segment focus
SWOT

15.13 Leidos Holdings Inc.

Leidos Holdings Inc. - Overview
Leidos Holdings Inc. - Business segments
Leidos Holdings Inc. - Key offerings
Leidos Holdings Inc. - Segment focus
SWOT

15.14 Leonardo S.p.A.

Leonardo S.p.A. - Overview
Leonardo S.p.A. - Business segments
Leonardo S.p.A. - Key offerings
Leonardo S.p.A. - Segment focus
SWOT

15.15 Lockheed Martin Corp.

Lockheed Martin Corp. - Overview
Lockheed Martin Corp. - Business segments
Lockheed Martin Corp. - Key offerings
Lockheed Martin Corp. - Segment focus
SWOT

15.16 Northrop Grumman Corp.

Northrop Grumman Corp. - Overview
Northrop Grumman Corp. - Business segments
Northrop Grumman Corp. - Key offerings
Northrop Grumman Corp. - Segment focus
SWOT

15.17 Palantir Technologies Inc.

Palantir Technologies Inc. - Overview
Palantir Technologies Inc. - Business segments
Palantir Technologies Inc. - Key offerings
Palantir Technologies Inc. - Segment focus
SWOT

15.18 The Boeing Co.

The Boeing Co. - Overview
The Boeing Co. - Business segments
The Boeing Co. - Key news
The Boeing Co. - Key offerings
The Boeing Co. - Segment focus
SWOT

16. Appendix

16.1 Scope of the report

Market definition
Objectives
Notes and caveats

16.2 Inclusions and exclusions checklist

Inclusions checklist
Exclusions checklist

16.3 Currency conversion rates for US$

16.4 Research methodology

16.5 Data procurement

Information sources

16.6 Data validation

16.7 Validation techniques employed for market sizing

16.8 Data synthesis

16.9 360 degree market analysis

16.10 List of abbreviations

Research Methodology

Technavio presents a detailed picture of the market by way of study, synthesis, and summation of data from multiple sources. The analysts have presented the various facets of the market with a particular focus on identifying the key industry influencers. The data thus presented is comprehensive, reliable, and the result of extensive research, both primary and secondary.

INFORMATION SOURCES

Primary sources

  • Manufacturers and suppliers
  • Channel partners
  • Industry experts
  • Strategic decision makers

Secondary sources

  • Industry journals and periodicals
  • Government data
  • Financial reports of key industry players
  • Historical data
  • Press releases

DATA ANALYSIS

Data Synthesis

  • Collation of data
  • Estimation of key figures
  • Analysis of derived insights

Data Validation

  • Triangulation with data models
  • Reference against proprietary databases
  • Corroboration with industry experts

REPORT WRITING

Qualitative

  • Market drivers
  • Market challenges
  • Market trends
  • Five forces analysis

Quantitative

  • Market size and forecast
  • Market segmentation
  • Geographical insights
  • Competitive landscape

Interested in this report?

Get your sample now to see our research methodology and insights!

Download Now

Frequently Asked Questions

Military Sensor Fusion market growth will increase by USD 311775.6 thousand thousand during 2026-2030.

The Military Sensor Fusion market is expected to grow at a CAGR of 6.1% during 2026-2030.

Military Sensor Fusion market is segmented by Platform (Airborne and space, Land-based, Naval) Type (Radar, Electro optical and infrared, Electronic warfare, Sonar) Application (ISR, Situational awareness, Target tracking, Battlefield management)

ASELSAN AS, BAE Systems Plc, CACI International Inc., Elbit Systems Ltd., General Dynamics Corp., HENSOLDT AG, Indra Sistemas SA, Kongsberg Gruppen ASA, L3Harris Technologies Inc., Leidos Holdings Inc., Leonardo S.p.A., Lockheed Martin Corp., Northrop Grumman Corp., Palantir Technologies Inc., QinetiQ Ltd., Rheinmetall AG, RTX Corp., Saab AB, Textron Systems, The Boeing Co. are a few of the key vendors in the Military Sensor Fusion market.

North America will register the highest growth rate of 33.8% among the other regions. Therefore, the Military Sensor Fusion market in North America is expected to garner significant business opportunities for the vendors during the forecast period.

US, Canada, Mexico, Germany, France, UK, Italy, Spain, The Netherlands, China, Japan, India, South Korea, Australia, Indonesia, Saudi Arabia, Israel, UAE, Turkey, South Africa, Brazil, Argentina, Colombia

  • Increasing demand for enhanced situational awareness across multi-domain operations is the driving factor this market.

The Military Sensor Fusion market vendors should focus on grabbing business opportunities from the Platform segment as it accounted for the largest market share in the base year.
RIA - Research AI Assistant
Ask RIA