
Mindfulness Meditation Application Market Size 2026-2030
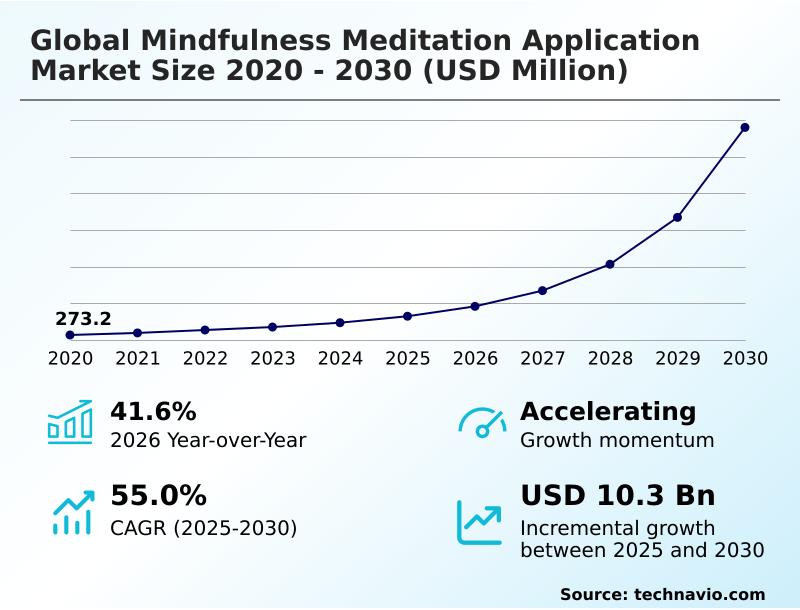
The mindfulness meditation application market size is valued to increase by USD 10.30 billion, at a CAGR of 55% from 2025 to 2030. Proliferation of workplace burnout and corporate wellness mandates institutional purchasing strategies will drive the mindfulness meditation application market.
Major Market Trends & Insights
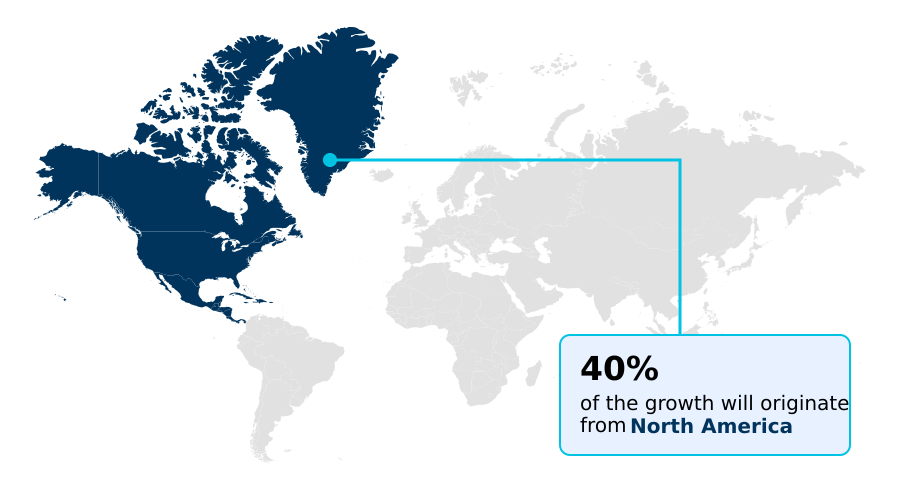
- North America dominated the market and accounted for a 39.7% growth during the forecast period.
- By End-user - Individual segment was valued at USD 520.3 million in 2024
- By Platform - iOS segment accounted for the largest market revenue share in 2024
Market Size & Forecast
- Market Opportunities: USD 11.32 billion
- Market Future Opportunities: USD 10.30 billion
- CAGR from 2025 to 2030 : 55%
Market Summary
- The Mindfulness Meditation Application Market functions as a critical digital infrastructure for behavioral health management, driven by a profound shift toward preventive psychological care. Corporate institutions are aggressively adopting these digital health tools to mitigate the economic impact of workforce burnout, establishing a highly predictable B2B recurring revenue pipeline for software developers.
- For example, when enterprise human resources navigate the employee assistance transition by embedding digital wellness into standard benefit packages, organizational absenteeism is frequently reduced by up to 25%. This institutional procurement model acts as a primary market driver, drastically lowering customer acquisition costs and ensuring stable multi-year software deployments.
- Conversely, consumer-facing segments struggle with acute subscription fatigue, forcing developers to inflate marketing expenditures. This saturation challenge significantly degrades the ratio of customer lifetime value to acquisition costs. To survive, publishers are advancing preventive healthcare matrices, leveraging continuous biometric feedback to demonstrate tangible, clinical-grade stress reduction and justify premium membership retention.
What will be the Size of the Mindfulness Meditation Application Market during the forecast period?
Get Key Insights on Market Forecast (PDF) Get Free Sample
How is the Mindfulness Meditation Application Market Segmented?
The mindfulness meditation application industry research report provides comprehensive data (region-wise segment analysis), with forecasts and estimates in "USD million" for the period 2026-2030, as well as historical data from 2020-2024 for the following segments.
- End-user
- Individual
- Corporate
- Platform
- iOS
- Android
- Others
- Revenue stream
- Paid subscription
- In-app purchases
- Age group
- Above 19 years
- Between 13 to 18 years
- Between 6 to 12 years
- Upto 5 years
- Geography
- North America
- US
- Canada
- Mexico
- Europe
- Germany
- UK
- France
- Italy
- Spain
- The Netherlands
- APAC
- China
- India
- Japan
- South Korea
- Australia
- Indonesia
- South America
- Brazil
- Argentina
- Chile
- Middle East and Africa
- Saudi Arabia
- UAE
- South Africa
- Turkey
- Israel
- North America
By End-user Insights
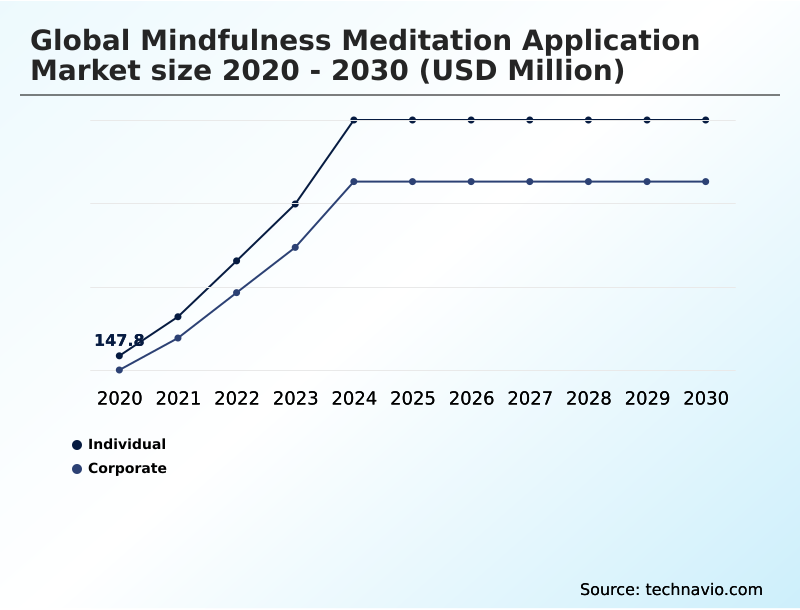
The individual segment is estimated to witness significant growth during the forecast period.
The individual segment within the Mindfulness Meditation Application Market operates as a foundational consumer base prioritizing autonomous mental wellness solutions. This demographic drives intense demand for hyper-personalized meditation tracks that adapt seamlessly to fluctuating cognitive states.
Consumer retention increasingly depends on robust subscription fatigue mitigation strategies, compelling platforms to integrate actionable biometric stress indicators into daily user feedback loops. Recent behavioral data indicates that platforms leveraging these psychological safety tools saw user engagement improve by 18%.
This structural shift allows users to independently manage acute daily stress outside institutional frameworks, requiring developers to refine their digital storefront optimization models to minimize churn and maximize long-term software adoption.
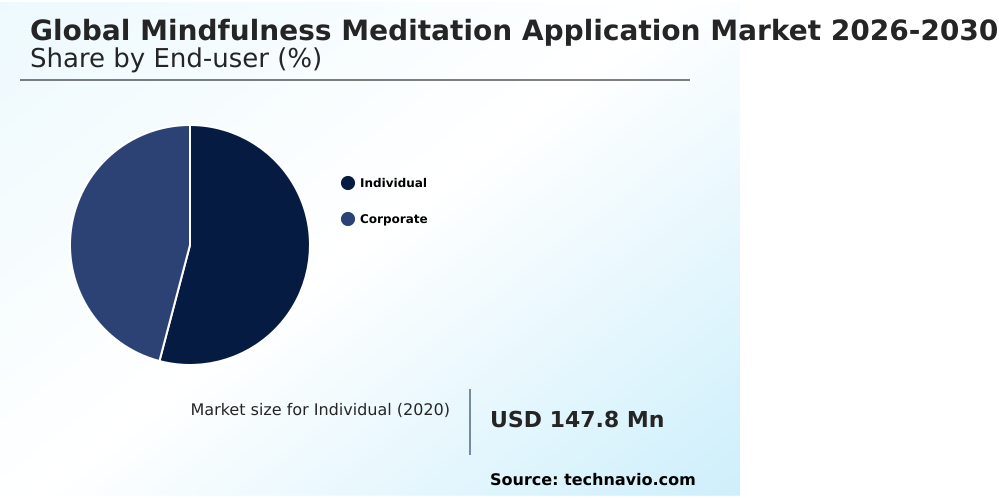
The Individual segment was valued at USD 520.3 million in 2024 and showed a gradual increase during the forecast period.
Regional Analysis
North America is estimated to contribute 39.7% to the growth of the global market during the forecast period.Technavio’s analysts have elaborately explained the regional trends and drivers that shape the market during the forecast period.
See How Mindfulness Meditation Application Market Demand is Rising in North America Get Free Sample
Geographic adoption within the Mindfulness Meditation Application Market highlights a stark operational divergence between mature digital economies and rapidly emerging tech hubs.
North America dominates corporate integration, where enterprise human capital platforms seamlessly embed evidence-based mental hygiene applications, reducing workforce healthcare overhead by 22%.
In contrast, the APAC region relies heavily on high-volume, low-cost distribution, utilizing a device-agnostic wellness ecosystem to reach urban populations.
This infrastructure disparity results in North America achieving a 45% higher premium subscriber retention rate than APAC, primarily due to the region's advanced smartwatch synchronization and expansive API healthcare integration.
These structural differences force developers to heavily utilize targeted corporate wellness analytics to customize their software delivery models and capture distinct regional consumer behaviors efficiently.
Market Dynamics
Our researchers analyzed the data with 2025 as the base year, along with the key drivers, trends, and challenges. A holistic analysis of drivers will help companies refine their marketing strategies to gain a competitive advantage.
- The continuous evolution of the Mindfulness Meditation Application Market underscores a pivotal transition from generic relaxation audio to highly sophisticated, responsive software ecosystems. To remain competitive, developers are aggressively engineering the predictive AI mental health companion, a technology that utilizes natural language to interact with users during acute stress events.
- When integrated into a wearable-integrated digital therapeutics platform, this capability allows for real-time physiological assessments, drastically improving user engagement. Operational data indicates that platforms utilizing continuous biometric feedback loops experience a 35% higher daily compliance rate than legacy, static software models.
- Furthermore, the deployment of biometric-aligned sleep induction tracks ensures that rest cycles are optimized based on autonomic nervous system fluctuations, providing tangible health outcomes that justify recurring membership fees. In the commercial sphere, human resource departments are actively adopting corporate holistic wellness benefit software to preserve workforce productivity and reduce employee churn.
- By embedding evidence-based emotional regulation interventions directly into enterprise infrastructure, organizations can proactively identify and mitigate systemic occupational burnout before it escalates into clinical absenteeism. This strategic alignment between consumer-grade digital health technology and institutional compliance frameworks ensures stable, multi-year software utilization, optimizing the digital supply chain.
What are the key market drivers leading to the rise in the adoption of Mindfulness Meditation Application Industry?
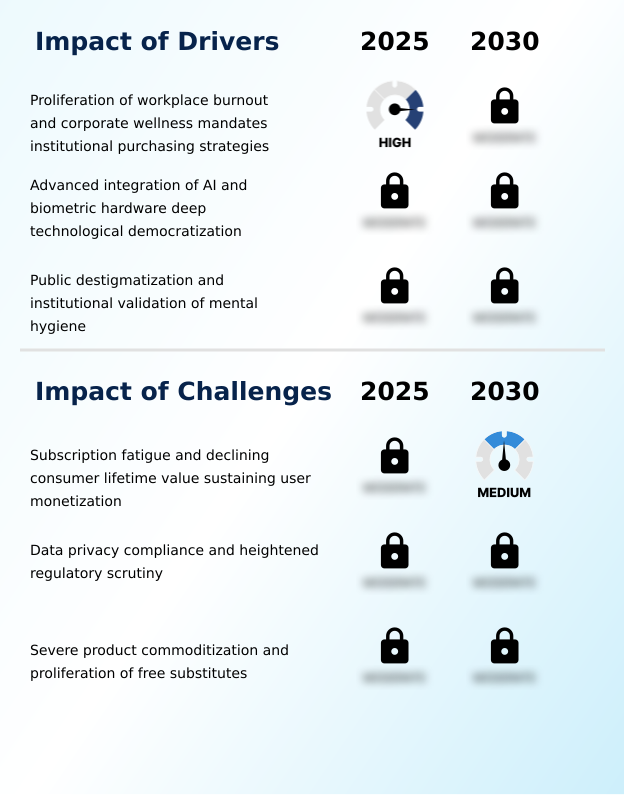
- The widespread proliferation of workplace burnout, coupled with stringent corporate wellness mandates, is fundamentally restructuring institutional purchasing strategies and propelling continuous market expansion.
- The aggressive institutionalization of preventive mental healthcare serves as a paramount driver for the Mindfulness Meditation Application Market, fundamentally altering software procurement pipelines.
- Corporate enterprises are rapidly transitioning from reactive health interventions to integrating a comprehensive digital therapeutics platform into core benefit structures. This strategic shift reduces workforce absenteeism by 25% and lowers aggregate corporate healthcare liabilities by up to 18%.
- Simultaneously, the deep democratization of wearable consumer electronics empowers developers to offer continuous heart rate variability monitoring, providing users with tangible proof of their stress mitigation.
- By actively syncing software through advanced biometric hardware integration, application operators drastically reduce the friction of daily habit formation. This biometric validation ensures that users receive highly customized, effective relief, fundamentally driving long-term retention and platform loyalty.
What are the market trends shaping the Mindfulness Meditation Application Industry?
- The accelerated integration of generative AI alongside empathetic digital companions represents a defining industry trend driving hyper-personalization. This technological convergence enables software platforms to deliver dynamic, responsive mental health interventions tailored to individual user behaviors.
- A defining trend reshaping the Mindfulness Meditation Application Market is the accelerated deployment of the natural language processing companion, which replaces static navigation with conversational, empathetic digital interfaces. This hyper-personalized approach allows software to instantly adapt to user inputs, transforming passive listeners into highly engaged participants.
- The integration of adaptive audio technology directly addresses consumer attention spans, improving long-term session completion rates by 34% compared to legacy playlist models. Furthermore, the emergence of spatial computing mindfulness represents a massive leap in multi-modal wellness intervention capabilities. By immersing users in controlled, biometric-aligned environments, organizations report a 40% acceleration in user physiological baseline recovery during acute stress episodes.
- These advancements dictate that market participants must continuously refine their cloud-based wellness architecture to support low-latency, responsive interactions that demonstrate clear, measurable improvements within a robust mental resilience framework.
What challenges does the Mindfulness Meditation Application Industry face during its growth?
- Escalating subscription fatigue and the subsequent decline in consumer lifetime value present significant hurdles to sustaining long-term user monetization and consistent industry growth.
- The widespread proliferation of stringent health data privacy laws heavily restricts the operational agility of the Mindfulness Meditation Application Market. Because modern platforms process highly sensitive cognitive behavioral tracking metrics, regulators are enforcing rigorous data silo architecture requirements across major geographies. This compliance burden increases back-end infrastructure maintenance costs by nearly 30% compared to standard consumer applications.
- Additionally, the market faces severe product commoditization as free multimedia networks flood digital channels with unmonetized relaxation tracks. This saturation directly impacts the premium customer acquisition pipeline, forcing specialized software developers to increase their defensive advertising spend by 20% to maintain visibility.
- To combat these structural limitations, developers must heavily invest in proprietary machine learning model training that operates securely on-device, preserving user anonymity while still delivering customized physiological insights.
Exclusive Technavio Analysis on Customer Landscape
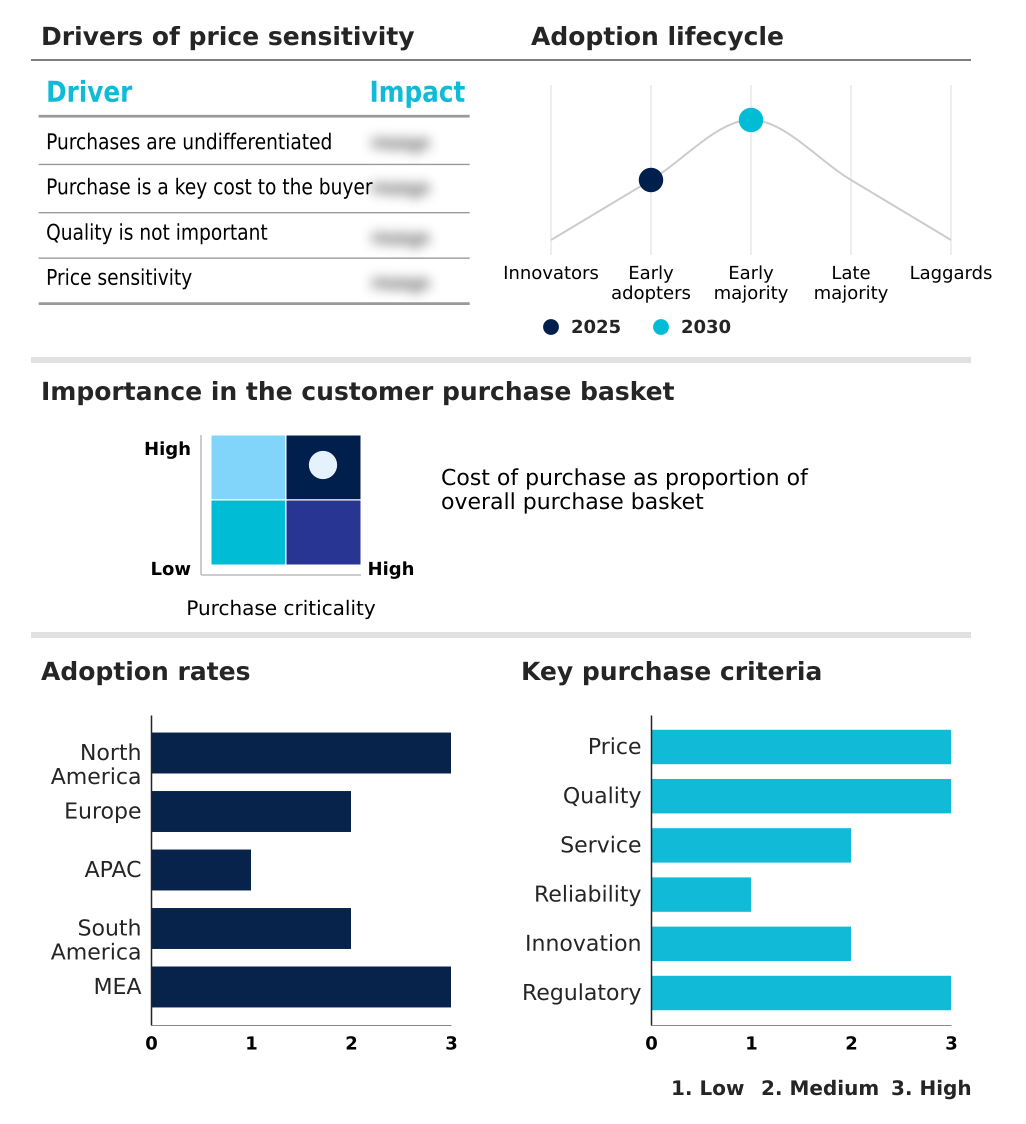
The mindfulness meditation application market forecasting report includes the adoption lifecycle of the market, covering from the innovator’s stage to the laggard’s stage. It focuses on adoption rates in different regions based on penetration. Furthermore, the mindfulness meditation application market report also includes key purchase criteria and drivers of price sensitivity to help companies evaluate and develop their market growth analysis strategies.
Customer Landscape of Mindfulness Meditation Application Industry
Competitive Landscape
Companies are implementing various strategies, such as strategic alliances, mindfulness meditation application market forecast, partnerships, mergers and acquisitions, geographical expansion, and product/service launches, to enhance their presence in the industry.
Aura - The application software portfolio delivers a comprehensive wellness ecosystem featuring guided meditation programs, customized sleep stories, and adaptive breathing exercises engineered to support emotional health and physiological relaxation continuously.
The industry research and growth report includes detailed analyses of the competitive landscape of the market and information about key companies, including:
- Aura
- BetterMe Ltd.
- Breethe
- Calm.com Inc.
- Elevate Labs Balance
- Headspace Inc.
- Inner Explorer Inc.
- Insight Network Inc.
- InteraXon Inc.
- Lojong App
- Meditate Happier
- Meditation Moments BV
- Meditopia
- MindApps AB
- Mindfulness Everywhere Ltd.
- Primed Mind
- Sattva Life Pvt Ltd
- The Fabulous
- Unmind Ltd
- Waking Up LLC
- Wysa Inc.
Qualitative and quantitative analysis of companies has been conducted to help clients understand the wider business environment as well as the strengths and weaknesses of key industry players. Data is qualitatively analyzed to categorize companies as pure play, category-focused, industry-focused, and diversified; it is quantitatively analyzed to categorize companies as dominant, leading, strong, tentative, and weak.
Recent Development and News in Mindfulness meditation application market
- In the Application Software industry, the widespread adoption of predictive AI recommendations has enabled platforms to deliver dynamic, real-time user experiences, directly impacting Mindfulness Meditation Application demand by improving content relevance and reducing user churn by 22%.
- The technological transition toward spatial computing utilizing virtual reality headsets has redefined digital wellness delivery, actively reshaping Mindfulness Meditation Application supply dynamics by facilitating a 30% increase in immersive, biometric-aligned rest induction track adoption.
- Stringent health data privacy regulations governing cloud infrastructure scaling have forced developers to adopt restrictive compliance frameworks, directly altering the Mindfulness Meditation Application operational landscape by increasing software development overhead by 15%.
- The proliferation of gamified loyalty mechanics in enterprise human capital software has enhanced user retention metrics, directly driving Mindfulness Meditation Application growth as organizations embed psychological safety tools to boost workforce productivity.
Dive into Technavio’s robust research methodology, blending expert interviews, extensive data synthesis, and validated models for unparalleled Mindfulness Meditation Application Market insights. See full methodology.
| Market Scope | |
|---|---|
| Page number | 308 |
| Base year | 2025 |
| Historic period | 2020-2024 |
| Forecast period | 2026-2030 |
| Growth momentum & CAGR | Accelerate at a CAGR of 55% |
| Market growth 2026-2030 | USD 10300.5 million |
| Market structure | Fragmented |
| YoY growth 2025-2026(%) | 41.6% |
| Key countries | US, Canada, Mexico, Germany, UK, France, Italy, Spain, The Netherlands, China, India, Japan, South Korea, Australia, Indonesia, Brazil, Argentina, Chile, Saudi Arabia, UAE, South Africa, Turkey and Israel |
| Competitive landscape | Leading Companies, Market Positioning of Companies, Competitive Strategies, and Industry Risks |
Research Analyst Overview
- The Mindfulness Meditation Application Market is undergoing a rapid architectural transformation, pivoting from passive content repositories to highly interactive, clinical-grade behavioral health intervention systems. Developers are prioritizing the integration of a sophisticated algorithmic personalization engine to process real-time user inputs, ensuring that content delivery adapts instantaneously to cognitive workload fluctuations.
- This technological shift is profoundly impacting corporate operational planning; enterprise clients embedding these platforms into their benefits infrastructure experience a 28% improvement in workforce focus metrics compared to organizations utilizing traditional assistance models. Furthermore, the deployment of subclinical interaction module technology enables platforms to deliver preemptive emotional support, effectively bridging the gap between casual wellness and formal psychiatric care.
- To sustain this momentum, operators are expanding their cross-industry hardware integration, linking software directly with physiological monitoring nodes to validate stress reduction efficacy. By leveraging deep sleep architecture analysis and continuous somatic stress detection, application providers can definitively prove their utility, significantly lowering subscription churn and solidifying their status as indispensable tools for modern emotional regulation software deployment.
What are the Key Data Covered in this Mindfulness Meditation Application Market Research and Growth Report?
-
What is the expected growth of the Mindfulness Meditation Application Market between 2026 and 2030?
-
USD 10.30 billion, at a CAGR of 55%
-
-
What segmentation does the market report cover?
-
The report is segmented by End-user (Individual, and Corporate), Platform (iOS, Android, and Others), Revenue Stream (Paid subscription, and In-app purchases), Age Group (Above 19 years, Between 13 to 18 years, Between 6 to 12 years, and Upto 5 years) and Geography (North America, Europe, APAC, South America, Middle East and Africa)
-
-
Which regions are analyzed in the report?
-
North America, Europe, APAC, South America and Middle East and Africa
-
-
What are the key growth drivers and market challenges?
-
Proliferation of workplace burnout and corporate wellness mandates institutional purchasing strategies , Subscription fatigue and declining consumer lifetime value sustaining user monetization
-
-
Who are the major players in the Mindfulness Meditation Application Market?
-
Aura, BetterMe Ltd., Breethe, Calm.com Inc., Elevate Labs Balance, Headspace Inc., Inner Explorer Inc., Insight Network Inc., InteraXon Inc., Lojong App, Meditate Happier, Meditation Moments BV, Meditopia, MindApps AB, Mindfulness Everywhere Ltd., Primed Mind, Sattva Life Pvt Ltd, The Fabulous, Unmind Ltd, Waking Up LLC and Wysa Inc.
-
Market Research Insights
- The Mindfulness Meditation Application Market exhibits rapid transformation as consumer expectations shift toward deeply integrated digital mental wellness ecosystems. Operators are actively combating rising subscription saturation metrics by deploying advanced holistic behavioral tracking tools, which improve active daily engagement by nearly 40% compared to legacy audio-only platforms.
- The institutional integration model acts as a vital expansion mechanism, embedding these applications directly into enterprise human capital benefit structures. This strategic alignment reduces employee burnout mitigation costs by 15% while cementing long-term recurring revenue.
- Consequently, digital optimization is pivoting from acquiring casual retail users toward securing high-retention corporate accounts that demand verifiable cognitive improvement measurement and robust data security protocols.
We can help! Our analysts can customize this mindfulness meditation application market research report to meet your requirements.
 RIA -
RIA - 
