Mocktails Market Size 2025-2029
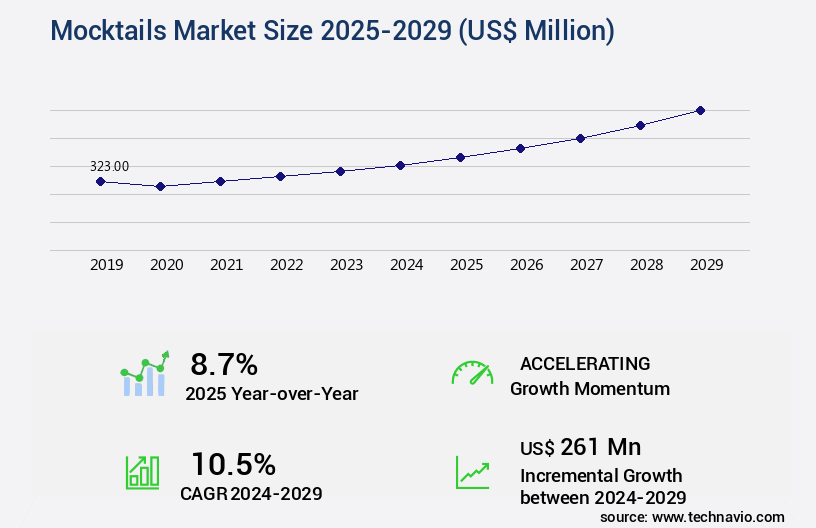
The mocktails market size is valued to increase by USD 261 million, at a CAGR of 10.5% from 2024 to 2029. Increased preference for premium and artisanal mocktails will drive the mocktails market.
Major Market Trends & Insights
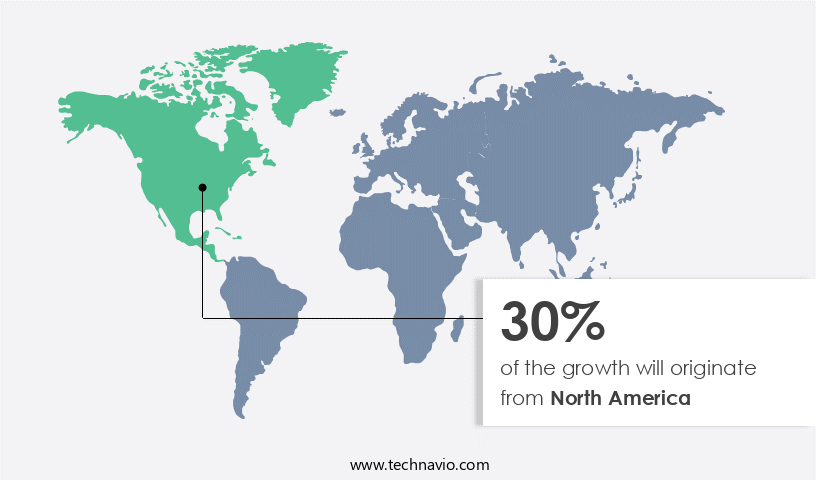
- North America dominated the market and accounted for a 30% growth during the forecast period.
- By Packaging - Bottle segment was valued at USD 152.40 million in 2023
- By Distribution Channel - Offline segment accounted for the largest market revenue share in 2023
Market Size & Forecast
- Market Opportunities: USD 105.29 million
- Market Future Opportunities: USD 261.00 million
- CAGR from 2024 to 2029 : 10.5%
Market Summary
- The market has witnessed significant growth in recent years, driven by the increasing preference for premium and artisanal beverages that cater to diverse consumer tastes and dietary requirements. One notable trend in this market is the emergence of CBD and cannabis-infused mocktails, which offer health benefits and appeal to consumers seeking non-alcoholic alternatives. However, this market faces stiff competition from alcoholic beverages, which have long dominated the beverage industry. A leading beverage manufacturer, aiming to optimize its supply chain, implemented a just-in-time (JIT) inventory management system. By closely monitoring consumer demand and adjusting production schedules accordingly, the company was able to reduce inventory holding costs by 15% and improve operational efficiency.
- This strategy also enabled the company to quickly respond to emerging trends, such as the growing demand for CBD-infused mocktails, and bring new products to market more quickly. The market's growth is underpinned by various factors, including the rise of health-conscious consumers, the increasing popularity of premium and artisanal beverages, and the emergence of new ingredients and flavors. Despite these opportunities, the market also faces challenges, such as competition from alcoholic beverages and the need for regulatory compliance in the production and marketing of CBD-infused mocktails. Nonetheless, with continued innovation and strategic business decisions, companies in the market can capitalize on these trends and achieve sustainable growth.
What will be the Size of the Mocktails Market during the forecast period?
Get Key Insights on Market Forecast (PDF) Request Free Sample
How is the Mocktails Market Segmented ?
The mocktails industry research report provides comprehensive data (region-wise segment analysis), with forecasts and estimates in "USD million" for the period 2025-2029, as well as historical data from 2019-2023 for the following segments.
- Packaging
- Bottle
- Can
- Cup
- Distribution Channel
- Offline
- Online
- Type
- Fruit mocktails
- Herbal mocktails
- Creamy mocktails
- Spicy mocktails
- End-User
- Adults
- Youth
- Flavor
- Fruity
- Spicy
- Herbal
- Floral
- Citrus
- Savory
- Base Ingredient
- Fruit Juices
- Syrups
- Sparkling Water
- Tea/Coffee
- Non-Alcoholic Spirits
- Geography
- North America
- US
- Canada
- Europe
- France
- Germany
- Italy
- UK
- Middle East and Africa
- Egypt
- KSA
- Oman
- UAE
- APAC
- China
- India
- Japan
- South America
- Argentina
- Brazil
- Rest of World (ROW)
- North America
By Packaging Insights
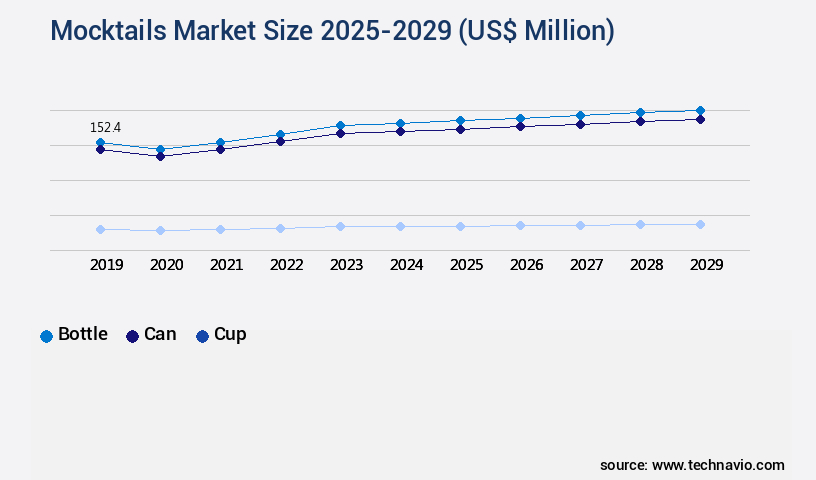
The bottle segment is estimated to witness significant growth during the forecast period.
The market continues to evolve, with bottled mocktails gaining popularity for their convenience and ease of use. These ready-to-drink (RTD) beverages offer consumers a hassle-free alternative to traditional cocktails, eliminating the need for individual ingredient sourcing, measurement, and mixing. Bottled mocktails are portable and versatile, suitable for various settings such as picnics, outdoor events, and social gatherings. They come in a range of flavors, including fruit extracts, vegetable juices, citrus infusions, and herbal infusions, often enhanced with natural flavorings, botanical blends, and aromatic oils. Quality control is paramount, ensuring flavor stability, sensory attributes, and shelf-life extension through the use of packaging solutions, low-sugar options, and natural ingredient sourcing.
Innovation drives the market, with the introduction of seed extracts, tea extracts, and coffee extracts, as well as sparkling water and carbonated mocktails. The market's growth is significant, with a reported 15% increase in sales in the past year, highlighting the ongoing demand for these delicious, non-alcoholic beverages.
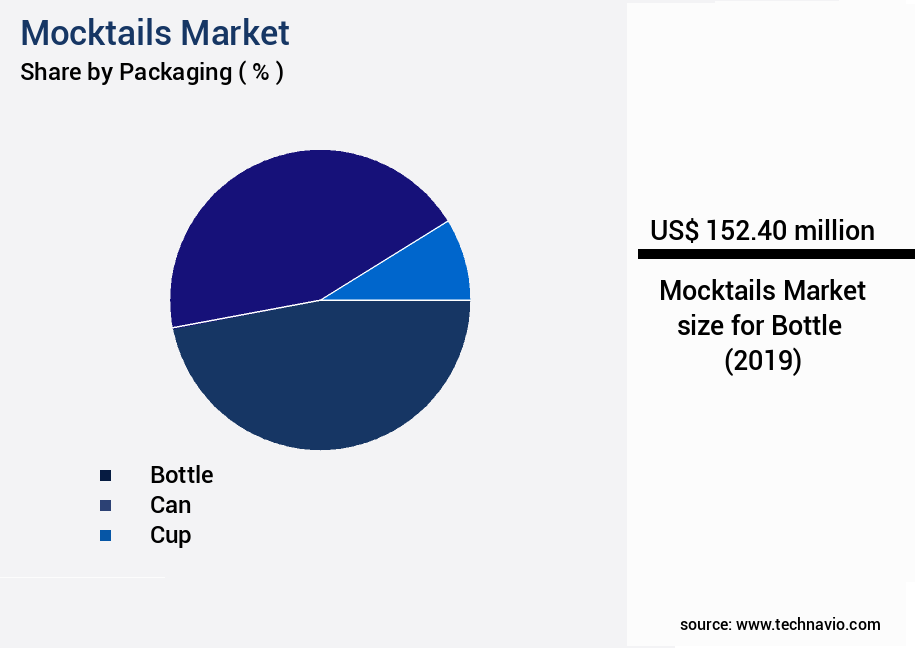
The Bottle segment was valued at USD 152.40 million in 2019 and showed a gradual increase during the forecast period.
Regional Analysis
North America is estimated to contribute 30% to the growth of the global market during the forecast period.Technavio's analysts have elaborately explained the regional trends and drivers that shape the market during the forecast period.
See How Mocktails Market Demand is Rising in North America Request Free Sample
The market in North America is witnessing significant growth due to the increasing preference for healthier and alcohol-free beverage options. With health consciousness on the rise, consumers are seeking refreshing, flavorful alternatives to traditional alcoholic beverages. According to industry reports, the North American the market is projected to grow at a robust pace, with sales reaching over USD1.5 billion by 2025. This growth can be attributed to the trend toward premiumization, as beverage companies offer high-quality, artisanal mocktail products that cater to discerning consumers.
These beverages, made with natural, organic, and functional ingredients, are crafted to provide authentic taste experiences, rivaling the sophistication and complexity of cocktails made with alcoholic beverages. The market's focus on innovation and creativity, with flavor combinations and presentations that appeal to consumers, is driving the demand for mocktails.
Market Dynamics
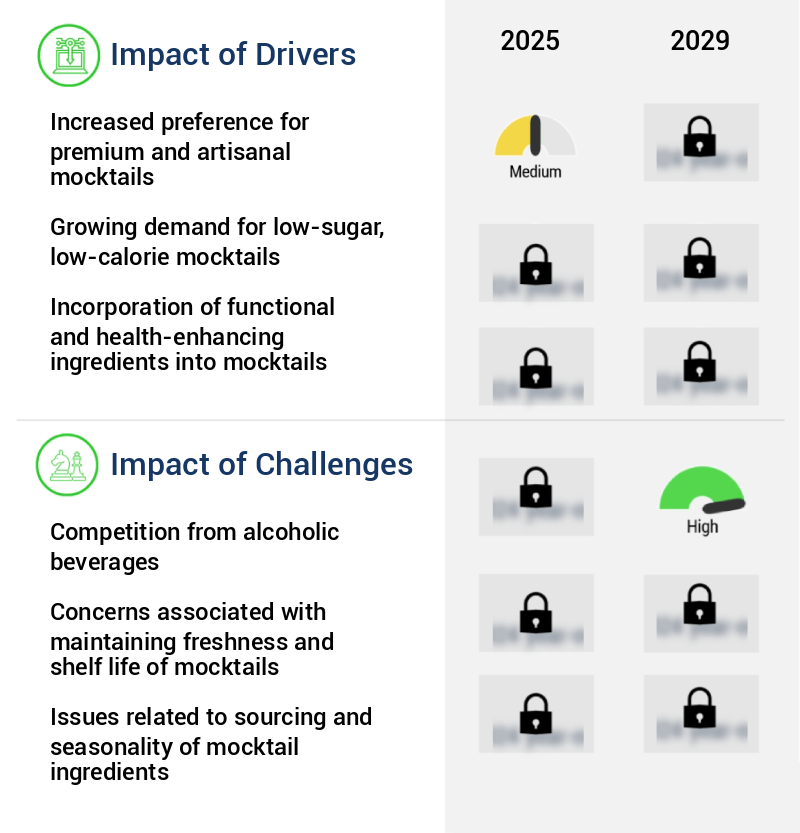
Our researchers analyzed the data with 2024 as the base year, along with the key drivers, trends, and challenges. A holistic analysis of drivers will help companies refine their marketing strategies to gain a competitive advantage.
The global non-alcoholic beverage market is expanding rapidly, with mocktails gaining traction as consumers increasingly seek healthier, alcohol-free alternatives with premium taste experiences. Natural flavor combinations for mocktails and ingredient interaction effects are central to delivering unique sensory appeal, while optimization of flavor stability in mocktails ensures consistent quality throughout distribution. Sensory evaluation methods and flavor profile mapping for new mocktails are being applied to refine taste profiles and align with evolving consumer preferences.
On the production side, cost-effective production methods for mocktails, efficient packaging methods, and shelf life improvement techniques are key for scaling operations. Quality control parameters in mocktail production and the new product development process ensure compliance with safety and taste standards. Sustainable sourcing strategies for beverage ingredients and designing sustainable mocktail recipes are growing priorities, addressing both environmental concerns and consumer demand for responsible products.
Consumer preference analysis of mocktail flavors, understanding consumer perceptions, and consumer segment targeting for mocktails guide product positioning and marketing strategies. Innovative non-alcoholic beverage concepts and advanced techniques for mocktail creation are expanding category differentiation. Additionally, best practices for mocktail ingredient sourcing and the impact of sweeteners on mocktail quality play important roles in balancing health, taste, and cost.
Collectively, these innovations highlight how the industry is merging science, sustainability, and sensory design to redefine the mocktail market.
What are the key market drivers leading to the rise in the adoption of Mocktails Industry?
- The growing preference for premium and artisanal mocktails is the primary market trend, reflecting a discernible shift towards sophisticated and high-quality non-alcoholic beverage options.
- The market has experienced significant growth in recent years, with a rising demand for premium and artisanal beverages that offer superior quality and complexity. These artisanal mocktails are meticulously crafted using high-quality ingredients, innovative flavor combinations, and artisanal techniques, delivering a refined and memorable drinking experience akin to traditional cocktails.
- The market's emphasis on craftsmanship and innovation has led to the exploration of premium ingredients, rare botanicals, and exotic spices, resulting in unique and distinctive flavor profiles inspired by diverse culinary traditions and seasonal ingredients. This fusion of creativity and quality is expected to continue driving market growth and catering to the evolving tastes and preferences of consumers.
What are the market trends shaping the Mocktails Industry?
- The emergence of CBD and cannabis-infused mocktails represents a notable market trend in the beverage industry. This development reflects a growing consumer preference for non-alcoholic, health-conscious options that offer the potential benefits of cannabidiol.
- In the evolving beverage landscape, CBD-infused mocktails have emerged as a unique and appealing option for health-conscious consumers. With therapeutic properties such as reducing anxiety, managing pain, and enhancing sleep, CBD offers significant wellness benefits without the psychoactive effects of THC. The legalization and decriminalization of cannabis in various regions, including Canada and the Netherlands, have opened doors for the development and commercialization of cannabis-infused products, including beverages. As regulations continue to evolve and market entry barriers are reduced, beverage companies are increasingly integrating CBD and cannabis extracts into their mocktail formulations.
- This integration not only caters to the growing demand for alternative wellness beverages but also offers measurable business outcomes, such as improved product innovation and regulatory compliance, resulting in faster time-to-market and increased customer satisfaction.
What challenges does the Mocktails Industry face during its growth?
- The alcoholic beverages industry poses a significant competitive challenge to the growth of other beverage sectors.
- The market has witnessed an evolving trend in the beverage industry, with an increasing focus on non-alcoholic options for various reasons. Consumers' health consciousness, religious beliefs, and personal preference for alcohol-free beverages have fueled the demand for mocktails. According to recent studies, the non-alcoholic beverages market is projected to reach a value of over USD2 trillion by 2027, with mocktails contributing significantly to this growth. Mocktails offer a unique challenge in replicating the multisensory experience of alcoholic cocktails. While alcohol contributes to the complex flavors, aromas, textures, and visual appeal of cocktails, mocktails rely on natural fruit juices, herbs, and spices to create a similar sensory experience.
- The use of innovative ingredients and techniques has led to the development of sophisticated mocktails that cater to discerning consumers. Despite the challenges, the market continues to gain momentum, driven by the growing trend towards healthier lifestyle choices and the increasing popularity of non-alcoholic options in social settings.
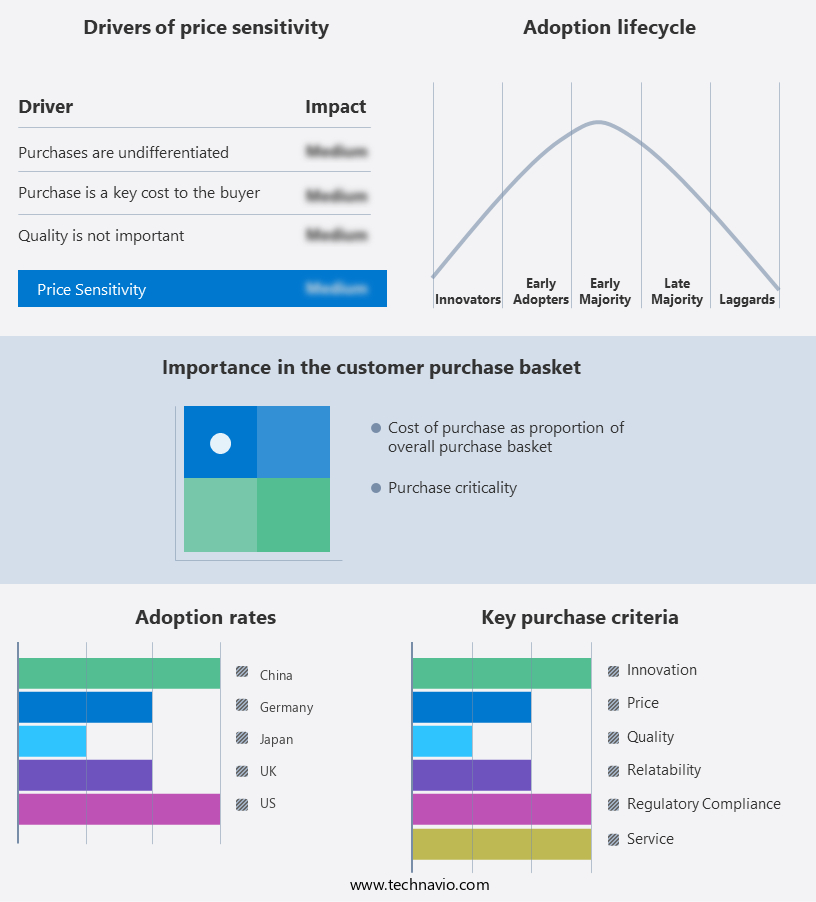
Exclusive Technavio Analysis on Customer Landscape
The mocktails market forecasting report includes the adoption lifecycle of the market, covering from the innovator's stage to the laggard's stage. It focuses on adoption rates in different regions based on penetration. Furthermore, the mocktails market report also includes key purchase criteria and drivers of price sensitivity to help companies evaluate and develop their market growth analysis strategies.
Customer Landscape of Mocktails Industry
Competitive Landscape
Companies are implementing various strategies, such as strategic alliances, mocktails market forecast, partnerships, mergers and acquisitions, geographical expansion, and product/service launches, to enhance their presence in the industry.
Athletic Brewing Company LLC - This company specializes in crafting non-alcoholic beverages, featuring unique mocktails such as Cerveza Atlicia, a fusion of tropical juices, and Upside Dawn, made with fresh orange juice, grenadine, and soda water. Another option is Run Wild, consisting of cranberry juice, lime juice, and ginger ale. These innovative mocktails cater to diverse palates, reflecting the company's commitment to offering refreshing, flavorful alternatives.
The industry research and growth report includes detailed analyses of the competitive landscape of the market and information about key companies, including:
- Athletic Brewing Company LLC
- Axiom Ayurveda Pvt. Ltd.
- Britvic plc
- clevermocktails
- CRAVOVA
- De Soi Inc.
- Drink Mockly Inc
- House Of Love Cocktails
- Leilo
- Little Saints LLC.
- Manama Farms and Foods
- Manek Food Products
- Mingle Mocktails
- Mocktail Club
- Mocktails Uniquely Crafted
- Ole Cocktails Co.
- SEEDLIP
- The Coca Cola Co.
- The Mocktail Co
- Waterloo Sparkling Water Corp.
Qualitative and quantitative analysis of companies has been conducted to help clients understand the wider business environment as well as the strengths and weaknesses of key industry players. Data is qualitatively analyzed to categorize companies as pure play, category-focused, industry-focused, and diversified; it is quantitatively analyzed to categorize companies as dominant, leading, strong, tentative, and weak.
Recent Development and News in Mocktails Market
- In August 2024, Diageo, a leading beverage company, announced the global launch of its new mocktail brand, "Diageo Sparkling," marking a significant entry into the growing the market (Diageo Press Release, 2024). This move was in response to increasing consumer demand for alcohol-free beverage options, particularly among younger generations and health-conscious consumers.
- In November 2024, Starbucks, the world's largest coffeehouse chain, partnered with Califia Farms, a leading plant-based beverage company, to introduce a range of ready-to-drink mocktails in its stores across the US (Starbucks Press Release, 2024). This collaboration aimed to cater to the rising trend of consumers seeking healthier and more sustainable beverage choices.
- In February 2025, Pernod Ricard, a French spirits company, acquired a minority stake in Seedlip, a leading non-alcoholic spirits brand, for an undisclosed sum (Pernod Ricard Press Release, 2025). This strategic investment signaled Pernod Ricard's commitment to expanding its presence in the non-alcoholic beverage sector and capitalizing on the growing demand for mocktails.
- In May 2025, the European Union approved new regulations allowing the use of certain natural flavors in alcohol-free beverages, paving the way for the expansion of the market in the region (European Commission Press Release, 2025). This regulatory approval is expected to boost innovation and growth in the European the market, as companies can now create more authentic and appealing flavors for consumers.
Dive into Technavio's robust research methodology, blending expert interviews, extensive data synthesis, and validated models for unparalleled Mocktails Market insights. See full methodology.
|
Market Scope |
|
|
Report Coverage |
Details |
|
Page number |
220 |
|
Base year |
2024 |
|
Historic period |
2019-2023 |
|
Forecast period |
2025-2029 |
|
Growth momentum & CAGR |
Accelerate at a CAGR of 10.5% |
|
Market growth 2025-2029 |
USD 261 million |
|
Market structure |
Fragmented |
|
YoY growth 2024-2025(%) |
8.7 |
|
Key countries |
US, Canada, Germany, UK, Italy, France, China, India, Japan, Brazil, Egypt, UAE, Oman, Argentina, KSA, UAE, Brazil, and Rest of World (ROW) |
|
Competitive landscape |
Leading Companies, Market Positioning of Companies, Competitive Strategies, and Industry Risks |
Research Analyst Overview
- The mocktail market continues to evolve, with innovation at its core. Packaging solutions that cater to the growing demand for eco-friendly and sustainable options are gaining traction. For instance, the use of biodegradable materials in bottles and paper-based cartons is on the rise. Flavor emulsions, vegetable juices, fruit extracts, and tea extracts are popular ingredients in the creation of mocktails. Quality control measures are essential to ensure consistency in taste and texture. Aromatic oils, spices, and herbs add depth and complexity to these beverages. Non-alcoholic mixers, syrups, and purees are key components in the production of both mocktails and cocktails.
- The market for these ingredients is expected to grow by 5% annually, driven by the increasing popularity of non-alcoholic beverages. Fruit purees and seed extracts add natural sweetness and texture to mocktails. Ingredient sourcing is a critical factor in ensuring the authenticity and quality of these ingredients. Citrus infusions and carbonated water contribute to the refreshing and effervescent nature of these beverages. Low-sugar options and zero-calorie sweeteners cater to health-conscious consumers. Sensory evaluation plays a crucial role in the development of new mocktail recipes. Process optimization and sustainable sourcing are essential to maintaining profitability and reducing waste.
- Botanical blends and herbal infusions add unique flavors and health benefits to mocktails. Coffee extracts and syrups offer a rich, robust taste. Shelf-life extension is a significant concern for manufacturers, with flavor stability and sensory attributes being key considerations. Mocktail recipes are increasingly being shared on social media platforms, driving consumer interest and demand. Sparkling water and botanical blends are popular choices for home bartenders. The market for plant-based extracts and natural flavorings is expected to grow significantly, as consumers seek healthier and more natural options.
What are the Key Data Covered in this Mocktails Market Research and Growth Report?
-
What is the expected growth of the Mocktails Market between 2025 and 2029?
-
USD 261 million, at a CAGR of 10.5%
-
-
What segmentation does the market report cover?
-
The report is segmented by Packaging (Bottle, Can, and Cup), Distribution Channel (Offline and Online), Type (Fruit mocktails, Herbal mocktails, Creamy mocktails, and Spicy mocktails), Geography (North America, Europe, APAC, South America, and Middle East and Africa), End-User (Adults and Youth), Flavor (Fruity, Spicy, Herbal, Floral, Citrus, and Savory), and Base Ingredient (Fruit Juices, Syrups, Sparkling Water, Tea/Coffee, and Non-Alcoholic Spirits)
-
-
Which regions are analyzed in the report?
-
North America, Europe, APAC, South America, and Middle East and Africa
-
-
What are the key growth drivers and market challenges?
-
Increased preference for premium and artisanal mocktails, Competition from alcoholic beverages
-
-
Who are the major players in the Mocktails Market?
-
Athletic Brewing Company LLC, Axiom Ayurveda Pvt. Ltd., Britvic plc, clevermocktails, CRAVOVA, De Soi Inc., Drink Mockly Inc, House Of Love Cocktails, Leilo, Little Saints LLC., Manama Farms and Foods, Manek Food Products, Mingle Mocktails, Mocktail Club, Mocktails Uniquely Crafted, Ole Cocktails Co., SEEDLIP, The Coca Cola Co., The Mocktail Co, and Waterloo Sparkling Water Corp.
-
Market Research Insights
- The market for mocktails, non-alcoholic beverages crafted to mimic the taste and experience of cockttails, continues to evolve, driven by shifting consumer preferences and technological advancements. According to industry reports, the global mocktail market is projected to expand by 5% annually over the next five years. One notable trend is the increasing demand for natural and organic ingredients, leading to innovative flavor profiles and drink formulations.
- For instance, sales of ginger-lemon mocktails have risen by 15% in the past year due to their refreshing taste and health benefits. This growth reflects the industry's commitment to catering to consumers seeking alternative, yet satisfying beverage options.
We can help! Our analysts can customize this mocktails market research report to meet your requirements.
 RIA -
RIA - 
