Ginger Ale Market Size 2024-2028
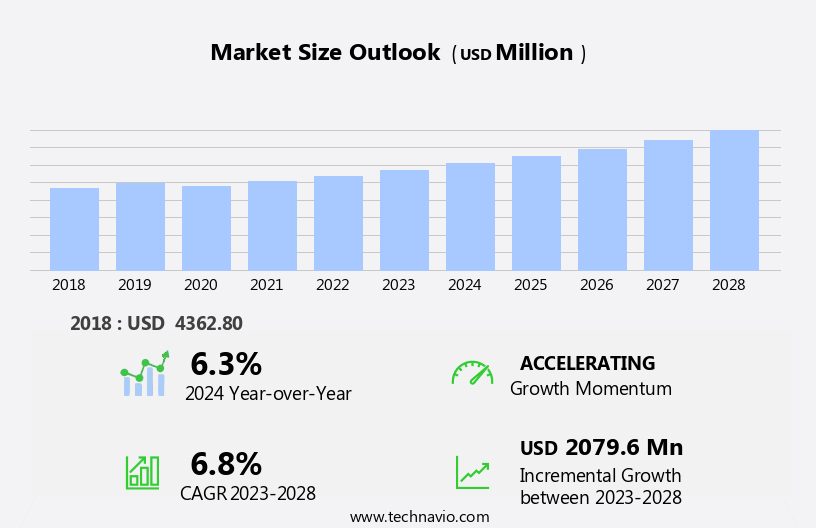
The ginger ale market size is forecast to increase by USD 2.08 billion at a CAGR of 6.8% between 2023 and 2028.
- The market is experiencing significant growth, driven primarily by the rise in disposable income and the increasing preference for crafted ginger ale drinks. Consumers are willing to pay a premium for these artisanal beverages, which offer unique flavors and higher quality ingredients. However, this market growth is not without challenges. Competition from alternative beverages, such as soft drinks, flavored waters and energy drinks, poses a significant threat. These beverages cater to similar consumer preferences for taste and refreshment, making it essential for ginger ale manufacturers to differentiate their offerings.
- To capitalize on market opportunities and navigate challenges effectively, companies must focus on product innovation, brand differentiation, and targeted marketing strategies. By addressing these key drivers, trends, and challenges, ginger ale manufacturers can position themselves for success in this dynamic market.
What will be the Size of the Ginger Ale Market during the forecast period?

Request Free Sample
- The market continues to evolve, driven by shifting consumer preferences and emerging trends. Herbal infusions and craft beverages have gained traction, leading to an increase in ginger ale mixers and soda fountains. Product differentiation is key, with glass bottles and ginger extract becoming popular for their artisanal appeal. Flavor innovation is also a significant factor, with spicy ginger and ginger snap variants gaining popularity. Social media marketing plays a crucial role in reaching consumers, with brands leveraging platforms to showcase natural ingredients, sustainable sourcing, and ethical production. Ginger ale is increasingly being marketed as a health and wellness product, with applications in morning sickness relief and digestive health.
- Aluminum cans and bulk packaging cater to convenience-seeking consumers, while shelf life and ambient temperature storage are essential considerations for retailers. Diet versions and natural and organic options are also gaining ground, with flavor profiles and anti-inflammatory properties attracting health-conscious consumers. Marketing campaigns emphasize the natural ingredients and unique flavor combinations, appealing to both Gen Z and older demographics. The market's continuous dynamism is reflected in the ongoing unfolding of market activities and evolving patterns, with ginger beer and other ginger-based beverages emerging as potential competitors. Recycling initiatives and packaging design are also key areas of focus for brands seeking to differentiate themselves and appeal to eco-conscious consumers.
How is this Ginger Ale Industry segmented?
The ginger ale industry research report provides comprehensive data (region-wise segment analysis), with forecasts and estimates in "USD million" for the period 2024-2028, as well as historical data from 2018-2022 for the following segments.
- Type
- Dry ginger ale
- Golden ginger ale
- Distribution Channel
- Packaging
- End-User
- Retail Consumers
- Foodservice Industry
- Beverage Manufacturers
- Geography
- North America
- Europe
- France
- Germany
- Italy
- Norway
- UK
- Middle East and Africa
- APAC
- Australia
- China
- India
- Japan
- South Korea
- South America
- Rest of World (ROW)
By Type Insights
The dry ginger ale segment is estimated to witness significant growth during the forecast period.
The market encompasses various types, with dry ginger ale gaining prominence for its unique taste and health-conscious appeal. Different from traditional ginger ales, dry ginger ale boasts a lighter, crisper flavor profile, appealing to consumers seeking a less sweet beverage option. This segment's growth is fueled by evolving consumer preferences, particularly among younger demographics. The trend toward natural, authentic, and lower-sugar beverages is driving demand for dry ginger ale. Herbal infusions and local sourcing add to its allure, while small-batch production and artisan production methods further distinguish it from mass-produced alternatives. In grocery stores, dry ginger ale is increasingly found alongside craft beverages and ginger ale mixers.
Social media marketing and product differentiation through glass bottles and sustainable sourcing also contribute to its growing popularity. Dry ginger ale's versatility extends to cocktail ingredients and soda fountains, further broadening its appeal. Spicy ginger and natural ingredients cater to health and wellness-focused consumers, while diet versions and recycling initiatives address convenience and sustainability concerns. Flavor innovation, including anti-inflammatory properties and flavor combinations, adds depth to the market. Dry ginger ale's potential uses as a morning sickness remedy and nausea relief further expand its market reach. Online retailers and convenience stores stock dry ginger ale, making it easily accessible to consumers. As the market evolves, organic options and ginger beer variants are emerging, catering to diverse consumer tastes and preferences.

Request Free Sample
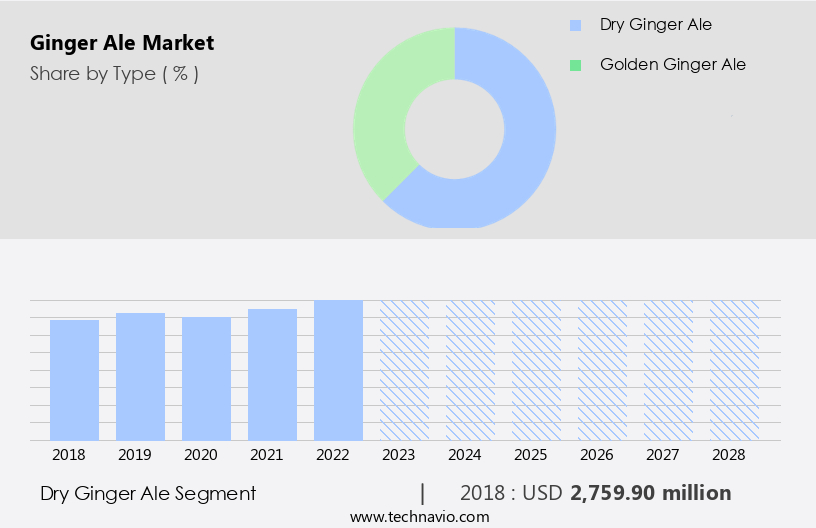
The Dry ginger ale segment was valued at USD 2.76 billion in 2018 and showed a gradual increase during the forecast period.
Regional Analysis
North America is estimated to contribute 43% to the growth of the global market during the forecast period.Technavio's analysts have elaborately explained the regional trends and drivers that shape the market during the forecast period.

Request Free Sample
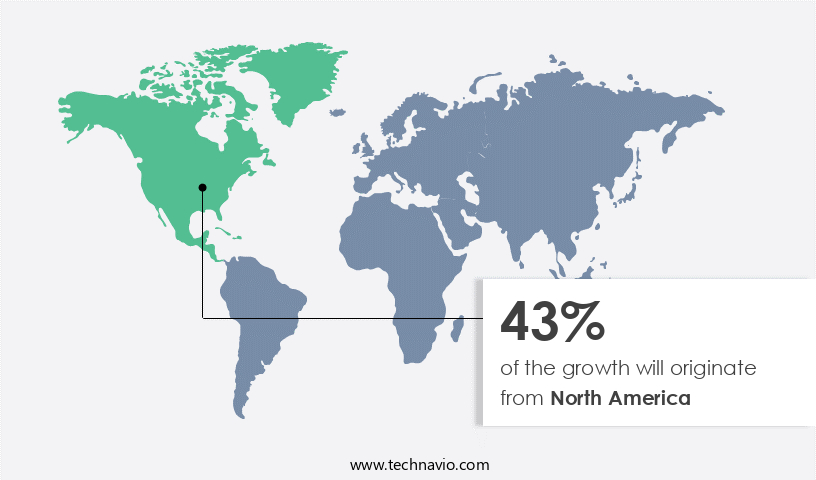
The North American the market experiences dynamic trends driven by consumer preferences and economic factors in the United States and Canada. In 2023, the average U.S. Household disposable income was a substantial USD61,291, totaling approximately USD17.05 trillion, signifying a strong purchasing power. This economic strength fuels demand for premium and specialty beverages, including ginger ale. Herbal infusions and natural ingredients are popular choices among health-conscious consumers, leading to the growth of craft ginger ale brands. Local sourcing and sustainable production are also key considerations for many buyers. Spicy ginger variants and ginger ale mixers cater to cocktail enthusiasts, while ginger ale's traditional role as a nausea relief beverage continues to attract those suffering from upset stomachs.
Small-batch production and artisan methods add to the beverage's appeal, with glass bottles and aluminum cans offering various packaging options. Social media marketing and online retailers expand accessibility, while diet versions and organic options cater to diverse consumer needs. Ginger ale's long shelf life makes it a convenient choice for convenience stores. The market's evolution reflects the importance of health and wellness, flavor innovation, and consumer convenience.
Market Dynamics
Our researchers analyzed the data with 2023 as the base year, along with the key drivers, trends, and challenges. A holistic analysis of drivers will help companies refine their marketing strategies to gain a competitive advantage.The ginger ale market is evolving with diverse offerings tailored to modern consumer preferences and industry needs. Organic ginger ale for health drinks is gaining traction among wellness-focused buyers, while dry ginger ale for cocktail mixing remains a staple in bars and restaurants. The rise of sugar-free ginger ale for retail supports demand for healthier options. Craft ginger ale for hospitality and premium ginger ale for events enhance upscale experiences. Sustainability drives innovation with eco-friendly ginger ale packaging. Consumers increasingly opt for low-calorie ginger ale, and golden ginger ale for food pairing complements gourmet dining. E-commerce platforms are boosting sales of natural ginger ale, and alcoholic drink ginger ale for bars continues to grow in the adult beverage segment.
What are the key market drivers leading to the rise in the adoption of Ginger Ale Industry?
- The increase in disposable income serves as the primary catalyst for market growth. The market is experiencing growth due to increasing disposable income levels in various regions. This economic trend empowers consumers to invest in premium and artisanal beverages, such as ginger ale. In Brazil, for instance, the job market has shown improvement, and the number of social program beneficiaries has risen. As a result, the total monthly household income per capita increased by 12.2% to USD 73.28 billion. The average real monthly income for employed individuals aged 14 and above was estimated at USD 548 in 2023, marking a 7% growth.
- This enhanced purchasing power fuels the demand for ginger ale, which offers unique flavor profiles and is known for its anti-inflammatory properties. Consumers, particularly those from Generation Z, are increasingly drawn to natural and organic ginger beer options with immersive and harmonious packaging designs. These trends underscore the market's potential for continued growth.
What are the market trends shaping the Ginger Ale Industry?
- The trend in the beverage market is leaning towards the adoption of crafted ginger ale drinks. The market is undergoing a transformation as consumers prioritize beverage choices based on taste and health benefits. This trend is evident in the rising preference for craft ginger ales, which are produced in small batches using natural herbal infusions, including real ginger extract. The authentic taste and health advantages of ginger, known for its digestive and anti-inflammatory properties, set these beverages apart from mass-produced options. Consumers, particularly those health-conscious, seek out drinks that offer more than just refreshment, aligning with broader health trends that emphasize natural and functional ingredients.
- In grocery stores, consumers can find these ginger ales in bulk packaging, often in plastic bottles, as they continue to gain popularity. This market dynamic underscores the importance of brand identity and local sourcing in the craft beverage industry.
What challenges does the Ginger Ale Industry face during its growth?
- The beverage industry faces significant competition from alternative drinks, posing a substantial challenge to its growth. The market experiences intense competition due to the increasing preference for alternative beverages among consumers. Producers must differentiate their ginger ale offerings to remain competitive. One notable competitor is kombucha, a fermented tea gaining popularity for its probiotic properties and unique flavors. Health-conscious consumers are drawn to kombucha as a functional beverage that supports gut health. With the rise of digestive wellness awareness, kombucha has emerged as a trendy, health-focused alternative to traditional sodas, including ginger ale.
- Product differentiation is crucial in this market, with ginger ale mixers, soda fountains, glass bottles, ginger extract, and flavor innovation being key strategies. Shelf life and packaging formats, such as aluminum cans, also play significant roles in product differentiation and market success.
Exclusive Customer Landscape
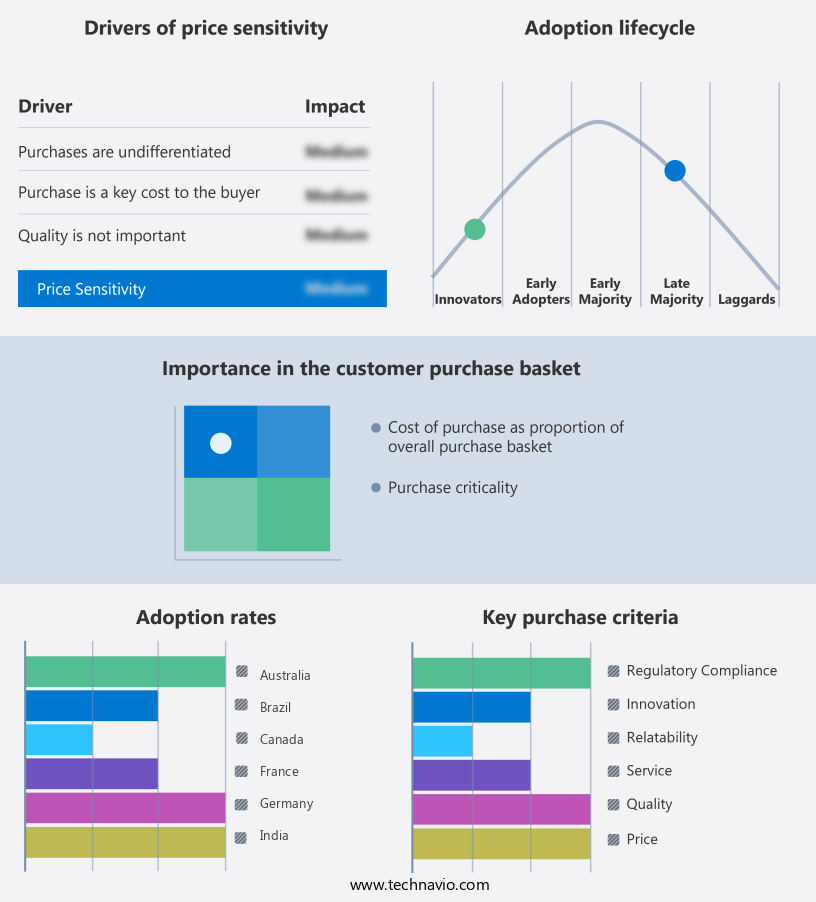
The ginger ale market forecasting report includes the adoption lifecycle of the market, covering from the innovator's stage to the laggard's stage. It focuses on adoption rates in different regions based on penetration. Furthermore, the ginger ale market report also includes key purchase criteria and drivers of price sensitivity to help companies evaluate and develop their market growth analysis strategies.

Customer Landscape
Key Companies & Market Insights
Companies are implementing various strategies, such as strategic alliances, ginger ale market forecast, partnerships, mergers and acquisitions, geographical expansion, and product/service launches, to enhance their presence in the industry.
A.G. Barr - This company produces a ginger ale beverage, devoid of artificial colors, flavors, and gluten. It adheres to vegan dietary preferences. The beverage's production aligns with a commitment to natural and inclusive consumer options.
The industry research and growth report includes detailed analyses of the competitive landscape of the market and information about key companies, including:
- A.G. Barr
- Blenheim Bottling Company
- Boylan Bottling Co.
- Britvic PLC
- Bruce Cost Ginger Ale
- Buffalo Rock Company
- Bundaberg Brewed Drinks
- Canada Dry
- Coca-Cola Company
- Dr Pepper Snapple Group
- Fever-Tree
- Hansen Beverage Company
- Jones Soda Co.
- Monster Beverage Corporation
- National Beverage Corp.
- PepsiCo Inc.
- Reed's Inc.
- Schweppes
- The Boston Beer Company
- Vernors
Qualitative and quantitative analysis of companies has been conducted to help clients understand the wider business environment as well as the strengths and weaknesses of key industry players. Data is qualitatively analyzed to categorize companies as pure play, category-focused, industry-focused, and diversified; it is quantitatively analyzed to categorize companies as dominant, leading, strong, tentative, and weak.
Recent Development and News in Ginger Ale Market
- In February 2024, The Coca-Cola Company, a leading beverage manufacturer, introduced a new ginger ale variant, named "Fanta Ginger," in select European markets. This expansion aimed to cater to the growing consumer preference for ginger-flavored beverages and strengthened Coca-Cola's presence in the market (Coca-Cola Company Press Release, 2024).
- In October 2024, PepsiCo and Dr. Pepper Snapple Group announced their merger, creating a leading beverage company with a combined market share of approximately 31% in the market. This merger was expected to result in cost savings and increased economies of scale, enabling the new entity to invest more in product innovation and marketing (Bloomberg, 2024).
- In March 2025, Canada Dry, a prominent ginger ale brand, secured a significant partnership with Starbucks to introduce a new ginger ale beverage, named "Starbucks Gingerbread Ginger Ale," exclusively in Starbucks stores during the holiday season. This collaboration aimed to leverage Starbucks' extensive retail network and Canada Dry's ginger ale expertise to attract consumers seeking unique, seasonal beverage offerings (Starbucks Press Release, 2025).
Research Analyst Overview
In the dynamic the market, functional beverages infused with ginger root continue to gain traction among health-conscious consumers. Brands are investing in digital marketing and influencer partnerships to boost consumer engagement and brand awareness. Flavor development is a key focus, with ginger cultivation and processing techniques undergoing innovation to enhance the sensory experience. Packaging innovations, such as eco-friendly materials and unique designs, are also driving growth. Consumer research and sensory analysis are essential for brand building, ensuring product quality and meeting evolving consumer preferences. Alternative medicine and natural remedies are influencing the market, with ginger ale being recognized for its health benefits.
The ginger ale market is witnessing innovation driven by health, sustainability, and premiumization trends. Low-calorie formulations are attracting health-conscious consumers, while plant-based sweeteners support clean-label positioning. Brands are investing in functional ingredients and high-potency ginger to meet demand for wellness-centric beverages. Artisanal flavors enhance product appeal across niche and premium segments. Sustainability remains central, with eco-friendly bottling, recyclable cans, and non-GMO products gaining market share. Technological advancements such as smart packaging and carbonation enhancements improve shelf appeal and product experience. Meanwhile, the adoption of advanced equipment enables consistent quality and scalable production, supporting growing demand across global markets.
Price point and retail strategy are crucial elements in distribution channels, as brands seek to cater to various consumer segments. Carbonation technology and brand partnerships are further shaping the market landscape, with product placement in lifestyle trends adding to the market's momentum. Consumer insights and market research are vital tools for brands to stay competitive and adapt to the ever-changing market dynamics.
Dive into Technavio's robust research methodology, blending expert interviews, extensive data synthesis, and validated models for unparalleled Ginger Ale Market insights. See full methodology.
|
Market Scope
|
|
Report Coverage
|
Details
|
|
Page number
|
194
|
|
Base year
|
2023
|
|
Historic period
|
2018-2022 |
|
Forecast period
|
2024-2028
|
|
Growth momentum & CAGR
|
Accelerate at a CAGR of 6.8%
|
|
Market growth 2024-2028
|
USD 2079.6 million
|
|
Market structure
|
Fragmented
|
|
YoY growth 2023-2024(%)
|
6.3
|
|
Key countries
|
US, China, Germany, Japan, UK, Australia, India, France, Brazil, UAE, Rest of World (ROW), Saudi Arabia, France, South Korea, Mexico, Italy, and Norway
|
|
Competitive landscape
|
Leading Companies, Market Positioning of Companies, Competitive Strategies, and Industry Risks
|
Request Free Sample
What are the Key Data Covered in this Ginger Ale Market Research and Growth Report?
- CAGR of the Ginger Ale industry during the forecast period
- Detailed information on factors that will drive the growth and forecasting between 2024 and 2028
- Precise estimation of the size of the market and its contribution of the industry in focus to the parent market
- Accurate predictions about upcoming growth and trends and changes in consumer behaviour
- Growth of the market across North America, Europe, APAC, South America, and Middle East and Africa
- Thorough analysis of the market's competitive landscape and detailed information about companies
- Comprehensive analysis of factors that will challenge the ginger ale market growth of industry companies
We can help! Our analysts can customize this ginger ale market research report to meet your requirements.
Get in touch
1 Executive Summary
- 1.1 Market overview
- Executive Summary - Chart on Market Overview
- Executive Summary - Data Table on Market Overview
- Executive Summary - Chart on Global Market Characteristics
- Executive Summary - Chart on Market by Geography
- Executive Summary - Chart on Market Segmentation by Type
- Executive Summary - Chart on Market Segmentation by Distribution Channel
- Executive Summary - Chart on Incremental Growth
- Executive Summary - Data Table on Incremental Growth
- Executive Summary - Chart on Company Market Positioning
2 Technavio Analysis
- 2.1 Analysis of price sensitivity, lifecycle, customer purchase basket, adoption rates, and purchase criteria
- Analysis of price sensitivity, lifecycle, customer purchase basket, adoption rates, and purchase criteria
- 2.2 Criticality of inputs and Factors of differentiation
- Overview on criticality of inputs and factors of differentiation
- 2.3 Factors of disruption
- Overview on factors of disruption
- 2.4 Impact of drivers and challenges
- Impact of drivers and challenges in 2023 and 2028
3 Market Landscape
- 3.1 Market ecosystem
- Parent Market
- Data Table on - Parent Market
- 3.2 Market characteristics
- Market characteristics analysis
4 Market Sizing
- 4.1 Market definition
- Offerings of companies included in the market definition
- 4.2 Market segment analysis
- 4.4 Market outlook: Forecast for 2023-2028
- Chart on Global - Market size and forecast 2023-2028 ($ million)
- Data Table on Global - Market size and forecast 2023-2028 ($ million)
- Chart on Global Market: Year-over-year growth 2023-2028 (%)
- Data Table on Global Market: Year-over-year growth 2023-2028 (%)
5 Historic Market Size
- 5.1 Global Ginger Ale Market 2018 - 2022
- Historic Market Size - Data Table on Global Ginger Ale Market 2018 - 2022 ($ million)
- 5.2 Type segment analysis 2018 - 2022
- Historic Market Size - Type Segment 2018 - 2022 ($ million)
- 5.3 Distribution Channel segment analysis 2018 - 2022
- Historic Market Size - Distribution Channel Segment 2018 - 2022 ($ million)
- 5.4 Geography segment analysis 2018 - 2022
- Historic Market Size - Geography Segment 2018 - 2022 ($ million)
- 5.5 Country segment analysis 2018 - 2022
- Historic Market Size - Country Segment 2018 - 2022 ($ million)
6 Qualitative Analysis
- 6.1 Impact of AI on the global ginger ale market
7 Five Forces Analysis
- 7.1 Five forces summary
- Five forces analysis - Comparison between 2023 and 2028
- 7.2 Bargaining power of buyers
- Bargaining power of buyers - Impact of key factors 2023 and 2028
- 7.3 Bargaining power of suppliers
- Bargaining power of suppliers - Impact of key factors in 2023 and 2028
- 7.4 Threat of new entrants
- Threat of new entrants - Impact of key factors in 2023 and 2028
- 7.5 Threat of substitutes
- Threat of substitutes - Impact of key factors in 2023 and 2028
- 7.6 Threat of rivalry
- Threat of rivalry - Impact of key factors in 2023 and 2028
- 7.7 Market condition
- Chart on Market condition - Five forces 2023 and 2028
8 Market Segmentation by Type
- 8.1 Market segments
- Chart on Type - Market share (2023-2028) (%)
- Data Table on Type - Market share (2023-2028) (%)
- 8.2 Comparison by Type
- Chart on Comparison by Type
- Data Table on Comparison by Type
- 8.3 Dry ginger ale - Market size and forecast (2023-2028)
- Chart on Dry ginger ale - Market size and forecast (2023-2028) ($ million)
- Data Table on Dry ginger ale - Market size and forecast (2023-2028) ($ million)
- Chart on Dry ginger ale - Year-over-year growth (2023-2028) (%)
- Data Table on Dry ginger ale - Year-over-year growth (2023-2028) (%)
- 8.4 Golden ginger ale - Market size and forecast (2023-2028)
- Chart on Golden ginger ale - Market size and forecast (2023-2028) ($ million)
- Data Table on Golden ginger ale - Market size and forecast (2023-2028) ($ million)
- Chart on Golden ginger ale - Year-over-year growth (2023-2028) (%)
- Data Table on Golden ginger ale - Year-over-year growth (2023-2028) (%)
- 8.5 Market opportunity by Type
- Market opportunity by Type ($ million)
- Data Table on Market opportunity by Type ($ million)
9 Market Segmentation by Distribution Channel
- 9.1 Market segments
- Chart on Distribution Channel - Market share (2023-2028) (%)
- Data Table on Distribution Channel - Market share (2023-2028) (%)
- 9.2 Comparison by Distribution Channel
- Chart on Comparison by Distribution Channel
- Data Table on Comparison by Distribution Channel
- 9.3 Offline - Market size and forecast (2023-2028)
- Chart on Offline - Market size and forecast (2023-2028) ($ million)
- Data Table on Offline - Market size and forecast (2023-2028) ($ million)
- Chart on Offline - Year-over-year growth (2023-2028) (%)
- Data Table on Offline - Year-over-year growth (2023-2028) (%)
- 9.4 Online - Market size and forecast (2023-2028)
- Chart on Online - Market size and forecast (2023-2028) ($ million)
- Data Table on Online - Market size and forecast (2023-2028) ($ million)
- Chart on Online - Year-over-year growth (2023-2028) (%)
- Data Table on Online - Year-over-year growth (2023-2028) (%)
- 9.5 Market opportunity by Distribution Channel
- Market opportunity by Distribution Channel ($ million)
- Data Table on Market opportunity by Distribution Channel ($ million)
10 Market Segmentation by Packaging
- 10.1 Market segments
- Chart on Packaging - Market share (2023-2028) (%)
- Data Table on Packaging - Market share (2023-2028) (%)
- 10.2 Comparison by Packaging
- Chart on Comparison by Packaging
- Data Table on Comparison by Packaging
- 10.3 Bottles - Market size and forecast (2023-2028)
- Chart on Bottles - Market size and forecast (2023-2028) ($ million)
- Data Table on Bottles - Market size and forecast (2023-2028) ($ million)
- Chart on Bottles - Year-over-year growth (2023-2028) (%)
- Data Table on Bottles - Year-over-year growth (2023-2028) (%)
- 10.4 Cans - Market size and forecast (2023-2028)
- Chart on Cans - Market size and forecast (2023-2028) ($ million)
- Data Table on Cans - Market size and forecast (2023-2028) ($ million)
- Chart on Cans - Year-over-year growth (2023-2028) (%)
- Data Table on Cans - Year-over-year growth (2023-2028) (%)
- 10.5 Kegs - Market size and forecast (2023-2028)
- Chart on Kegs - Market size and forecast (2023-2028) ($ million)
- Data Table on Kegs - Market size and forecast (2023-2028) ($ million)
- Chart on Kegs - Year-over-year growth (2023-2028) (%)
- Data Table on Kegs - Year-over-year growth (2023-2028) (%)
- 10.6 Market opportunity by Packaging
- Market opportunity by Packaging ($ million)
- Data Table on Market opportunity by Packaging ($ million)
11 Market Segmentation by End-User
- 11.1 Market segments
- Chart on End-User - Market share (2023-2028) (%)
- Data Table on End-User - Market share (2023-2028) (%)
- 11.2 Comparison by End-User
- Chart on Comparison by End-User
- Data Table on Comparison by End-User
- 11.3 Retail Consumers - Market size and forecast (2023-2028)
- Chart on Retail Consumers - Market size and forecast (2023-2028) ($ million)
- Data Table on Retail Consumers - Market size and forecast (2023-2028) ($ million)
- Chart on Retail Consumers - Year-over-year growth (2023-2028) (%)
- Data Table on Retail Consumers - Year-over-year growth (2023-2028) (%)
- 11.4 Foodservice Industry - Market size and forecast (2023-2028)
- Chart on Foodservice Industry - Market size and forecast (2023-2028) ($ million)
- Data Table on Foodservice Industry - Market size and forecast (2023-2028) ($ million)
- Chart on Foodservice Industry - Year-over-year growth (2023-2028) (%)
- Data Table on Foodservice Industry - Year-over-year growth (2023-2028) (%)
- 11.5 Beverage Manufacturers - Market size and forecast (2023-2028)
- Chart on Beverage Manufacturers - Market size and forecast (2023-2028) ($ million)
- Data Table on Beverage Manufacturers - Market size and forecast (2023-2028) ($ million)
- Chart on Beverage Manufacturers - Year-over-year growth (2023-2028) (%)
- Data Table on Beverage Manufacturers - Year-over-year growth (2023-2028) (%)
- 11.6 Market opportunity by End-User
- Market opportunity by End-User ($ million)
- Data Table on Market opportunity by End-User ($ million)
12 Customer Landscape
- 12.1 Customer landscape overview
- Analysis of price sensitivity, lifecycle, customer purchase basket, adoption rates, and purchase criteria
13 Geographic Landscape
- 13.1 Geographic segmentation
- Chart on Market share by geography 2023-2028 (%)
- Data Table on Market share by geography 2023-2028 (%)
- 13.2 Geographic comparison
- Chart on Geographic comparison
- Data Table on Geographic comparison
- 13.3 North America - Market size and forecast 2023-2028
- Chart on North America - Market size and forecast 2023-2028 ($ million)
- Data Table on North America - Market size and forecast 2023-2028 ($ million)
- Chart on North America - Year-over-year growth 2023-2028 (%)
- Data Table on North America - Year-over-year growth 2023-2028 (%)
- 13.4 Europe - Market size and forecast 2023-2028
- Chart on Europe - Market size and forecast 2023-2028 ($ million)
- Data Table on Europe - Market size and forecast 2023-2028 ($ million)
- Chart on Europe - Year-over-year growth 2023-2028 (%)
- Data Table on Europe - Year-over-year growth 2023-2028 (%)
- 13.5 APAC - Market size and forecast 2023-2028
- Chart on APAC - Market size and forecast 2023-2028 ($ million)
- Data Table on APAC - Market size and forecast 2023-2028 ($ million)
- Chart on APAC - Year-over-year growth 2023-2028 (%)
- Data Table on APAC - Year-over-year growth 2023-2028 (%)
- 13.6 South America - Market size and forecast 2023-2028
- Chart on South America - Market size and forecast 2023-2028 ($ million)
- Data Table on South America - Market size and forecast 2023-2028 ($ million)
- Chart on South America - Year-over-year growth 2023-2028 (%)
- Data Table on South America - Year-over-year growth 2023-2028 (%)
- 13.7 Middle East and Africa - Market size and forecast 2023-2028
- Chart on Middle East and Africa - Market size and forecast 2023-2028 ($ million)
- Data Table on Middle East and Africa - Market size and forecast 2023-2028 ($ million)
- Chart on Middle East and Africa - Year-over-year growth 2023-2028 (%)
- Data Table on Middle East and Africa - Year-over-year growth 2023-2028 (%)
- 13.8 US - Market size and forecast 2023-2028
- Chart on US - Market size and forecast 2023-2028 ($ million)
- Data Table on US - Market size and forecast 2023-2028 ($ million)
- Chart on US - Year-over-year growth 2023-2028 (%)
- Data Table on US - Year-over-year growth 2023-2028 (%)
- 13.9 Canada - Market size and forecast 2023-2028
- Chart on Canada - Market size and forecast 2023-2028 ($ million)
- Data Table on Canada - Market size and forecast 2023-2028 ($ million)
- Chart on Canada - Year-over-year growth 2023-2028 (%)
- Data Table on Canada - Year-over-year growth 2023-2028 (%)
- 13.10 UK - Market size and forecast 2023-2028
- Chart on UK - Market size and forecast 2023-2028 ($ million)
- Data Table on UK - Market size and forecast 2023-2028 ($ million)
- Chart on UK - Year-over-year growth 2023-2028 (%)
- Data Table on UK - Year-over-year growth 2023-2028 (%)
- 13.11 Germany - Market size and forecast 2023-2028
- Chart on Germany - Market size and forecast 2023-2028 ($ million)
- Data Table on Germany - Market size and forecast 2023-2028 ($ million)
- Chart on Germany - Year-over-year growth 2023-2028 (%)
- Data Table on Germany - Year-over-year growth 2023-2028 (%)
- 13.12 Japan - Market size and forecast 2023-2028
- Chart on Japan - Market size and forecast 2023-2028 ($ million)
- Data Table on Japan - Market size and forecast 2023-2028 ($ million)
- Chart on Japan - Year-over-year growth 2023-2028 (%)
- Data Table on Japan - Year-over-year growth 2023-2028 (%)
- 13.13 Australia - Market size and forecast 2023-2028
- Chart on Australia - Market size and forecast 2023-2028 ($ million)
- Data Table on Australia - Market size and forecast 2023-2028 ($ million)
- Chart on Australia - Year-over-year growth 2023-2028 (%)
- Data Table on Australia - Year-over-year growth 2023-2028 (%)
- 13.14 France - Market size and forecast 2023-2028
- Chart on France - Market size and forecast 2023-2028 ($ million)
- Data Table on France - Market size and forecast 2023-2028 ($ million)
- Chart on France - Year-over-year growth 2023-2028 (%)
- Data Table on France - Year-over-year growth 2023-2028 (%)
- 13.15 India - Market size and forecast 2023-2028
- Chart on India - Market size and forecast 2023-2028 ($ million)
- Data Table on India - Market size and forecast 2023-2028 ($ million)
- Chart on India - Year-over-year growth 2023-2028 (%)
- Data Table on India - Year-over-year growth 2023-2028 (%)
- 13.16 Brazil - Market size and forecast 2023-2028
- Chart on Brazil - Market size and forecast 2023-2028 ($ million)
- Data Table on Brazil - Market size and forecast 2023-2028 ($ million)
- Chart on Brazil - Year-over-year growth 2023-2028 (%)
- Data Table on Brazil - Year-over-year growth 2023-2028 (%)
- 13.17 South Africa - Market size and forecast 2023-2028
- Chart on South Africa - Market size and forecast 2023-2028 ($ million)
- Data Table on South Africa - Market size and forecast 2023-2028 ($ million)
- Chart on South Africa - Year-over-year growth 2023-2028 (%)
- Data Table on South Africa - Year-over-year growth 2023-2028 (%)
- 13.18 Market opportunity by geography
- Market opportunity by geography ($ million)
- Data Tables on Market opportunity by geography ($ million)
- 13.19 US - Market size and forecast (2023-2028)
- Chart on US - Market size and forecast (2023-2028) ($ million)
- Data Table on US - Market size and forecast (2023-2028) ($ million)
- Chart on US - Year-over-year growth (2023-2028) (%)
- Data Table on US - Year-over-year growth (2023-2028) (%)
- 13.20 China - Market size and forecast (2023-2028)
- Chart on China - Market size and forecast (2023-2028) ($ million)
- Data Table on China - Market size and forecast (2023-2028) ($ million)
- Chart on China - Year-over-year growth (2023-2028) (%)
- Data Table on China - Year-over-year growth (2023-2028) (%)
- 13.21 UAE - Market size and forecast (2023-2028)
- Chart on UAE - Market size and forecast (2023-2028) ($ million)
- Data Table on UAE - Market size and forecast (2023-2028) ($ million)
- Chart on UAE - Year-over-year growth (2023-2028) (%)
- Data Table on UAE - Year-over-year growth (2023-2028) (%)
- 13.22 Rest of World (ROW) - Market size and forecast (2023-2028)
- Chart on Rest of World (ROW) - Market size and forecast (2023-2028) ($ million)
- Data Table on Rest of World (ROW) - Market size and forecast (2023-2028) ($ million)
- Chart on Rest of World (ROW) - Year-over-year growth (2023-2028) (%)
- Data Table on Rest of World (ROW) - Year-over-year growth (2023-2028) (%)
- 13.23 Saudi Arabia - Market size and forecast (2023-2028)
- Chart on Saudi Arabia - Market size and forecast (2023-2028) ($ million)
- Data Table on Saudi Arabia - Market size and forecast (2023-2028) ($ million)
- Chart on Saudi Arabia - Year-over-year growth (2023-2028) (%)
- Data Table on Saudi Arabia - Year-over-year growth (2023-2028) (%)
- 13.24 South Korea - Market size and forecast (2023-2028)
- Chart on South Korea - Market size and forecast (2023-2028) ($ million)
- Data Table on South Korea - Market size and forecast (2023-2028) ($ million)
- Chart on South Korea - Year-over-year growth (2023-2028) (%)
- Data Table on South Korea - Year-over-year growth (2023-2028) (%)
- 13.25 Mexico - Market size and forecast (2023-2028)
- Chart on Mexico - Market size and forecast (2023-2028) ($ million)
- Data Table on Mexico - Market size and forecast (2023-2028) ($ million)
- Chart on Mexico - Year-over-year growth (2023-2028) (%)
- Data Table on Mexico - Year-over-year growth (2023-2028) (%)
- 13.26 Italy - Market size and forecast (2023-2028)
- Chart on Italy - Market size and forecast (2023-2028) ($ million)
- Data Table on Italy - Market size and forecast (2023-2028) ($ million)
- Chart on Italy - Year-over-year growth (2023-2028) (%)
- Data Table on Italy - Year-over-year growth (2023-2028) (%)
- 13.27 Norway - Market size and forecast (2023-2028)
- Chart on Norway - Market size and forecast (2023-2028) ($ million)
- Data Table on Norway - Market size and forecast (2023-2028) ($ million)
- Chart on Norway - Year-over-year growth (2023-2028) (%)
- Data Table on Norway - Year-over-year growth (2023-2028) (%)
14 Drivers, Challenges, and Opportunity/Restraints
- 14.3 Impact of drivers and challenges
- Impact of drivers and challenges in 2023 and 2028
- 14.4 Market opportunities/restraints
15 Competitive Landscape
- 15.2 Competitive Landscape
- Overview on criticality of inputs and factors of differentiation
- 15.3 Landscape disruption
- Overview on factors of disruption
- 15.4 Industry risks
- Impact of key risks on business
16 Competitive Analysis
- 16.2 Market positioning of companies
- Matrix on companies position and classification
- 16.3 A.G. Barr
- A.G. Barr - Overview
- A.G. Barr - Product / Service
- A.G. Barr - Key offerings
- 16.4 Blenheim Bottling Company
- Blenheim Bottling Company - Overview
- Blenheim Bottling Company - Product / Service
- Blenheim Bottling Company - Key offerings
- 16.5 Boylan Bottling Co.
- Boylan Bottling Co. - Overview
- Boylan Bottling Co. - Product / Service
- Boylan Bottling Co. - Key offerings
- 16.6 Britvic PLC
- Britvic PLC - Overview
- Britvic PLC - Product / Service
- Britvic PLC - Key offerings
- 16.7 Bruce Cost Ginger Ale
- Bruce Cost Ginger Ale - Overview
- Bruce Cost Ginger Ale - Product / Service
- Bruce Cost Ginger Ale - Key offerings
- 16.8 Buffalo Rock Company
- Buffalo Rock Company - Overview
- Buffalo Rock Company - Product / Service
- Buffalo Rock Company - Key offerings
- 16.9 Bundaberg Brewed Drinks
- Bundaberg Brewed Drinks - Overview
- Bundaberg Brewed Drinks - Product / Service
- Bundaberg Brewed Drinks - Key offerings
- 16.10 Canada Dry
- Canada Dry - Overview
- Canada Dry - Product / Service
- Canada Dry - Key offerings
- 16.11 Coca-Cola Company
- Coca-Cola Company - Overview
- Coca-Cola Company - Product / Service
- Coca-Cola Company - Key offerings
- 16.12 Dr Pepper Snapple Group
- Dr Pepper Snapple Group - Overview
- Dr Pepper Snapple Group - Product / Service
- Dr Pepper Snapple Group - Key offerings
- 16.13 Fever-Tree
- Fever-Tree - Overview
- Fever-Tree - Product / Service
- Fever-Tree - Key offerings
- 16.14 Hansen Beverage Company
- Hansen Beverage Company - Overview
- Hansen Beverage Company - Product / Service
- Hansen Beverage Company - Key offerings
- 16.15 Jones Soda Co.
- Jones Soda Co. - Overview
- Jones Soda Co. - Product / Service
- Jones Soda Co. - Key offerings
- 16.16 Monster Beverage Corporation
- Monster Beverage Corporation - Overview
- Monster Beverage Corporation - Product / Service
- Monster Beverage Corporation - Key offerings
- 16.17 National Beverage Corp.
- National Beverage Corp. - Overview
- National Beverage Corp. - Product / Service
- National Beverage Corp. - Key offerings
- 16.18 PepsiCo Inc.
- PepsiCo Inc. - Overview
- PepsiCo Inc. - Product / Service
- PepsiCo Inc. - Key offerings
- 16.19 Reed’s Inc.
- Reed’s Inc. - Overview
- Reed’s Inc. - Product / Service
- Reed’s Inc. - Key offerings
- 16.20 Schweppes
- Schweppes - Overview
- Schweppes - Product / Service
- Schweppes - Key offerings
- 16.21 The Boston Beer Company
- The Boston Beer Company - Overview
- The Boston Beer Company - Product / Service
- The Boston Beer Company - Key offerings
- 16.22 Vernors
- Vernors - Overview
- Vernors - Product / Service
- Vernors - Key offerings
- 16.23 Bickford and Sons
- Bickford and Sons - Overview
- Bickford and Sons - Product / Service
- Bickford and Sons - Key offerings
- 16.24 Blenheim Ginger Ale
- Blenheim Ginger Ale - Overview
- Blenheim Ginger Ale - Product / Service
- Blenheim Ginger Ale - Key offerings
- 16.25 Boylan Bottling Co.
- Boylan Bottling Co. - Overview
- Boylan Bottling Co. - Product / Service
- Boylan Bottling Co. - Key offerings
- 16.26 Britvic Plc
- Britvic Plc - Overview
- Britvic Plc - Product / Service
- Britvic Plc - Key offerings
- 16.27 Bruce Cost Ginger Beer
- Bruce Cost Ginger Beer - Overview
- Bruce Cost Ginger Beer - Product / Service
- Bruce Cost Ginger Beer - Key offerings
- 16.28 Buffalo Rock Company
- Buffalo Rock Company - Overview
- Buffalo Rock Company - Product / Service
- Buffalo Rock Company - Key offerings
- 16.29 Canada Dry
- Canada Dry - Overview
- Canada Dry - Product / Service
- Canada Dry - Key offerings
- 16.30 Dhampur Green
- Dhampur Green - Overview
- Dhampur Green - Product / Service
- Dhampur Green - Key offerings
- 16.31 Fentimans Ltd.
- Fentimans Ltd. - Overview
- Fentimans Ltd. - Product / Service
- Fentimans Ltd. - Key offerings
- 16.32 Fevertree Drinks Plc
- Fevertree Drinks Plc - Overview
- Fevertree Drinks Plc - Product / Service
- Fevertree Drinks Plc - Key offerings
- 16.33 Keurig Dr Pepper
- Keurig Dr Pepper - Overview
- Keurig Dr Pepper - Product / Service
- Keurig Dr Pepper - Key offerings
- 16.34 Malaki
- Malaki - Overview
- Malaki - Product / Service
- Malaki - Key offerings
- 16.35 PepsiCo Inc.
- PepsiCo Inc. - Overview
- PepsiCo Inc. - Product / Service
- PepsiCo Inc. - Key offerings
- 16.36 Pureearth Beverages Pvt. Ltd.
- Pureearth Beverages Pvt. Ltd. - Overview
- Pureearth Beverages Pvt. Ltd. - Product / Service
- Pureearth Beverages Pvt. Ltd. - Key offerings
- 16.37 Q Tonic LLC
- Q Tonic LLC - Overview
- Q Tonic LLC - Product / Service
- Q Tonic LLC - Key offerings
- 16.38 Reeds
- Reeds - Overview
- Reeds - Product / Service
- Reeds - Key offerings
- 16.39 Sepoy and Co.
- Sepoy and Co. - Overview
- Sepoy and Co. - Product / Service
- Sepoy and Co. - Key offerings
- 16.40 The Coca Cola Co.
- The Coca Cola Co. - Overview
- The Coca Cola Co. - Product / Service
- The Coca Cola Co. - Key offerings
- 16.41 Thomas Henry GmbH
- Thomas Henry GmbH - Overview
- Thomas Henry GmbH - Product / Service
- Thomas Henry GmbH - Key offerings
- 16.42 Zevia LLC
- Zevia LLC - Overview
- Zevia LLC - Product / Service
- Zevia LLC - Key offerings
17 Appendix
- 17.2 Inclusions and exclusions checklist
- Inclusions checklist
- Exclusions checklist
- 17.3 Currency conversion rates for US$
- Currency conversion rates for US$
- 17.4 Research methodology
- 17.7 Validation techniques employed for market sizing
- Validation techniques employed for market sizing
- 17.9 360 degree market analysis
- 360 degree market analysis
- 17.10 List of abbreviations