
Model Inference Optimization Tools Market Size 2026-2030
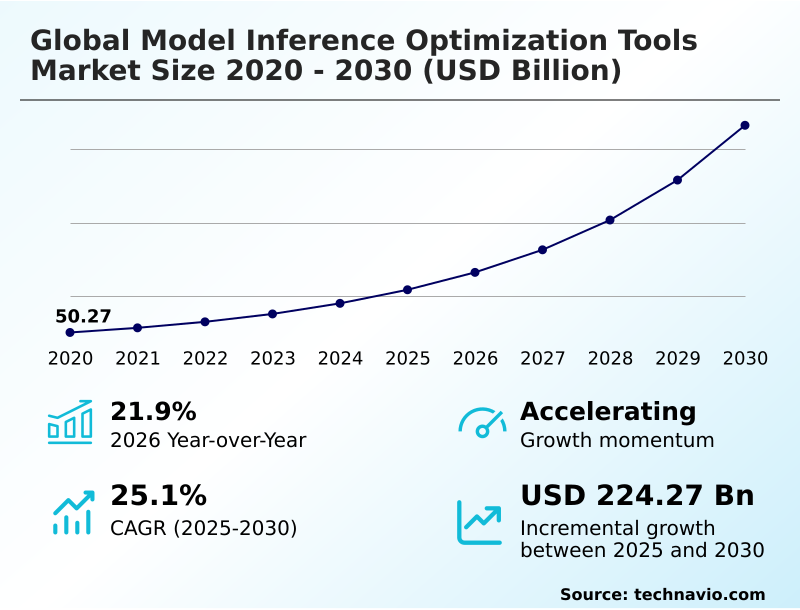
The Model Inference Optimization Tools Market size was valued at USD 108.50 billion in 2025, growing at a CAGR of 25.1% during the forecast period 2026-2030.
Major Market Trends & Insights
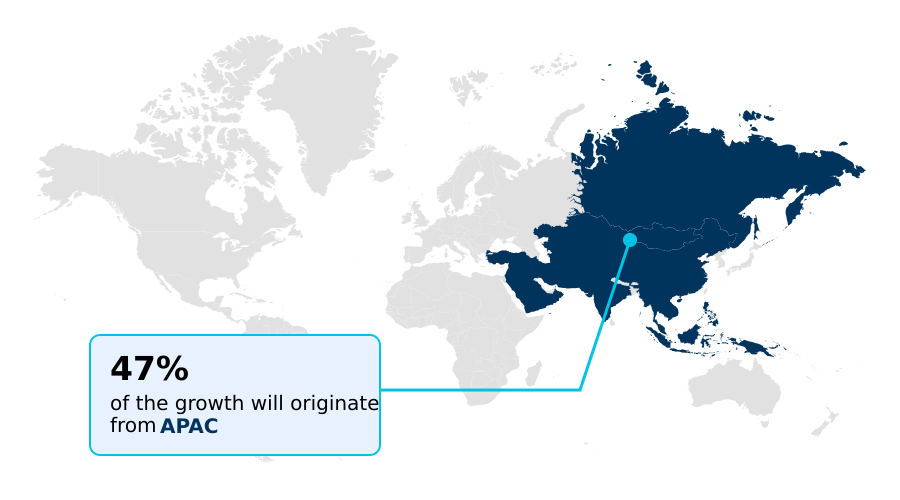
- APAC dominated the market and accounted for a 47.4% growth during the forecast period.
- By Deployment - Cloud segment was valued at USD 40.22 billion in 2024
- By End-user - BFSI segment accounted for the largest market revenue share in 2024
Market Size & Forecast
- Historic Market Opportunities 2020-2024: USD 282.50 billion
- Market Future Opportunities 2025-2030: USD 224.27 billion
- CAGR from 2025 to 2030 : 25.1%
Market Summary
- The model inference optimization tools market is driven by an urgent need to reduce operational costs, with optimized models demonstrating up to a 70% decrease in cloud computing expenses. In a retail supply chain context, deploying these tools can enhance demand forecast accuracy by over 15%, directly improving inventory management and reducing waste.
- A primary driver is the evolution toward agentic AI workflows, which require continuous, real-time inference that is only feasible through ultra-low latency optimization. This demand for speed and efficiency creates a virtuous cycle of innovation. However, the market faces a significant challenge from hardware fragmentation, as a lack of interoperability standards across diverse processing units creates substantial engineering overhead.
- This heterogeneity slows deployment cycles, forcing enterprises to make difficult trade-offs between achieving broad compatibility and extracting peak performance from their hardware investments, ultimately impacting the total cost of ownership for AI systems.
What will be the Size of the Model Inference Optimization Tools Market during the forecast period?
Get Key Insights on Market Forecast (PDF) Request Free Sample
How is the Model Inference Optimization Tools Market Segmented?
The model inference optimization tools industry research report provides comprehensive data (region-wise segment analysis), with forecasts and analysis for the period 2026-2030, as well as historical data from 2020-2024 for the following segments.
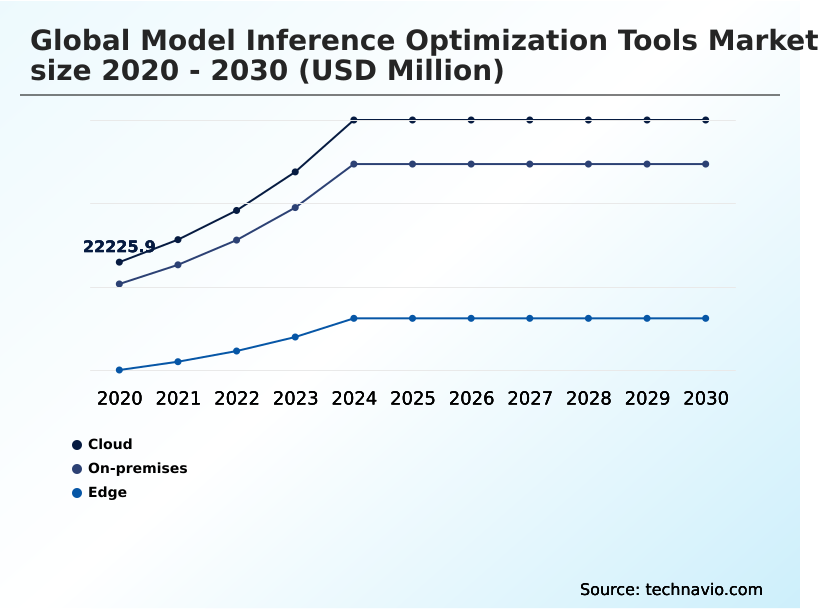
- Deployment
- Cloud
- On-premises
- Edge
- End-user
- BFSI
- Healthcare
- Retail and e-commerce
- Automotive
- Others
- Application
- Machine learning
- Generative AI
- Natural language processing (NLP)
- Computer vision
- Others
- Geography
- APAC
- China
- Japan
- India
- North America
- US
- Canada
- Mexico
- Europe
- Germany
- UK
- France
- South America
- Brazil
- Argentina
- Middle East and Africa
- UAE
- Israel
- Saudi Arabia
- Rest of World (ROW)
- APAC
How is the Model Inference Optimization Tools Market Segmented by Deployment?
The cloud segment is estimated to witness significant growth during the forecast period.
The cloud deployment segment, enabling over 99.9% availability for fluctuating workloads, serves as the foundational pillar for the model inference optimization tools market.
This model is favored by enterprises for its elastic scalability, which allows for a 40% reduction in model deployment time and MLOps integration.
Cloud platforms provide integrated optimization suites that allow for automated quantization and distributed inference, which are crucial for real-time AI processing.
These platforms offer access to the latest hardware accelerators, allowing for inference speeds up to 2.3 times faster than unoptimized benchmarks.
This addresses primary enterprise concerns regarding computational cost optimization and data security, making it vital for organizations scaling their AI operations and managing memory footprint reduction.
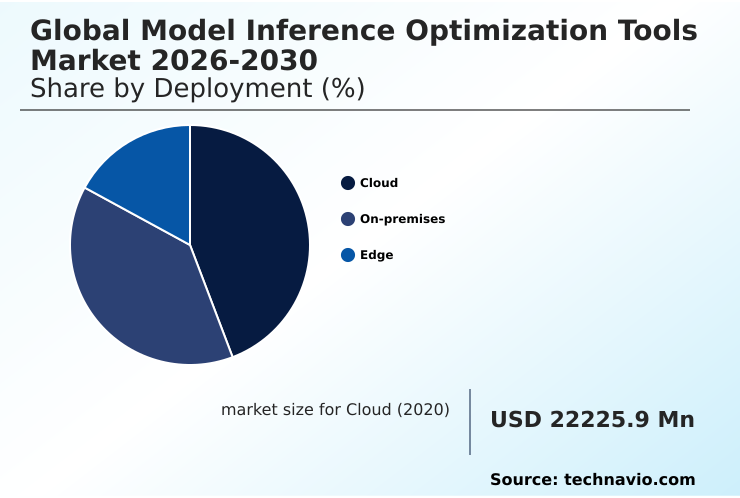
The Cloud segment was valued at USD 40.22 billion in 2024 and showed a gradual increase during the forecast period.
How demand for the Model Inference Optimization Tools market is rising in the leading region?
APAC is estimated to contribute 47.4% to the growth of the global market during the forecast period.Technavio’s analysts have elaborately explained the regional trends and drivers that shape the market during the forecast period.
See How Model Inference Optimization Tools Market demand is rising in APAC Request Free Sample
The APAC region is the fastest-growing market for model inference optimization tools, projected to contribute 47.4% of the global incremental growth, significantly outpacing North America.
This growth is led by countries like China, which alone accounts for nearly 28% of the regional market, driven by a national push for technological self-reliance and large-scale smart city projects.
The adoption drivers differ regionally; North America focuses on computational cost optimization in hyperscale data centers for low-latency applications, whereas APAC prioritizes on-device intelligence and edge AI acceleration for its mobile-first consumer base, which can reduce bandwidth needs by over 50%.
This creates distinct demands, with North American firms seeking throughput enhancement for complex workloads and APAC developers requiring tools that support hardware fragmentation and enable real-time AI processing on lower-specification devices, highlighting the diverse global requirements for model integrity and deployment.
What are the key Drivers, Trends, and Challenges in the Model Inference Optimization Tools Market?
Our researchers analyzed the data with 2025 as the base year, along with the key drivers, trends, and challenges. A holistic analysis of drivers will help companies refine their marketing strategies to gain a competitive advantage.
- Enterprises are strategically focused on reducing generative AI inference cost, which can account for up to 90% of a model's total lifecycle expense in production environments.
- The application of advanced quantization techniques for deep learning has proven highly effective in this regard, with methods like 4-bit integer quantization shrinking model memory footprints by over 75% without a critical loss in predictive accuracy. This intense pressure to control expenditures is a primary factor driving the adoption of specialized solutions.
- For cloud-centric deployments, the emphasis is on GPU inference performance tuning to maximize the throughput of large-scale clusters handling millions of simultaneous requests. This operational focus differs significantly from decentralized strategies, which rely on edge AI model deployment tools to enable low-latency AI processing directly on consumer or industrial hardware.
- In either scenario, optimizing LLM inference latency remains a critical objective for ensuring responsive, real-time user experiences in applications ranging from conversational AI to autonomous systems. Success hinges on selecting the right optimization stack that aligns with both the specific hardware target and the economic constraints of the AI-powered service.
What are the key market drivers leading to the rise in the adoption of Model Inference Optimization Tools Industry?
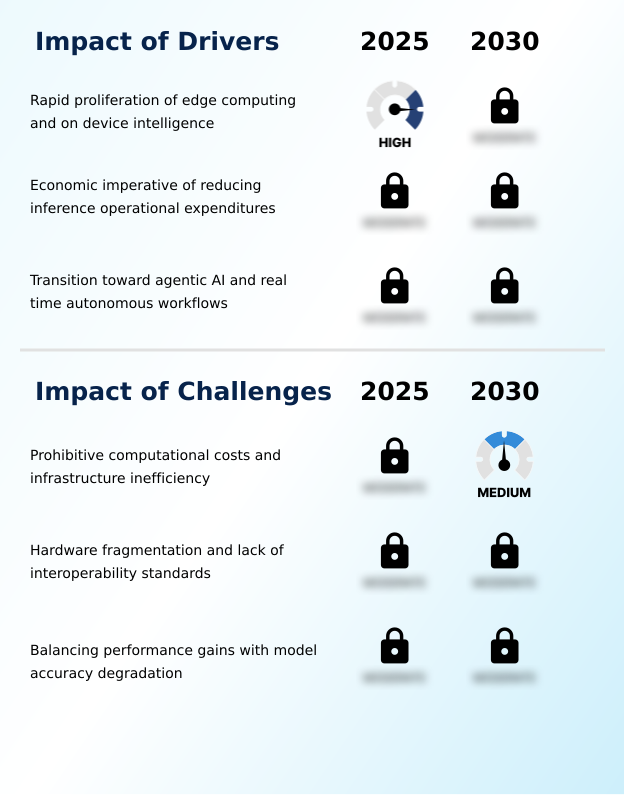
- The rapid proliferation of edge computing and on-device intelligence is a primary market driver, creating substantial demand for tools that optimize AI models for resource-constrained environments.
- The shift to edge computing is a primary market driver, with on-device intelligence reducing data transmission to the cloud by over 90% in certain autonomous systems.
- This proliferation is fueled by the need for real-time AI processing, enhanced data privacy, and the operational necessity of low-latency applications.
- In industrial automation, a latency reduction of just 50 milliseconds can prevent costly production errors, making edge AI acceleration a critical requirement.
- Consequently, demand has surged for tools that specialize in memory footprint reduction and model distillation, enabling sophisticated AI to run on resource-constrained hardware.
- This migration of workloads away from centralized servers is fundamental to scaling AI in sectors where immediate, localized decision-making is paramount for both efficiency and safety, directly fueling the growth of optimization toolkits.
What are the market trends shaping the Model Inference Optimization Tools Industry?
- A predominant trend is the shift toward hardware-software co-design, coupled with the emergence of specialized neural architectures. This convergence aims to maximize computational efficiency for AI workloads.
- The market is defined by a decisive trend toward deep hardware-software co-design, where optimization tools are built in tandem with specialized neural architectures to overcome the limits of general-purpose processors. This approach has demonstrated the ability to improve performance-per-watt by up to 3x compared to non-specialized hardware.
- This convergence is driven by the need for energy-efficient inference to handle the parallel workloads of generative AI. By using a custom graph compiler to expose low-level hardware features, these tools enable the deployment of models that are 80% smaller in memory footprint.
- This synergy between silicon design and software optimization is creating a more integrated ecosystem where performance is defined by the entire technical stack, enabling advanced deep learning inference on both large-scale hardware accelerators and resource-constrained edge devices.
What challenges does the Model Inference Optimization Tools Industry face during its growth?
- A key market challenge stems from the prohibitive computational costs and infrastructure inefficiencies associated with deploying large-scale AI models.
- Hardware fragmentation remains a significant challenge, with development teams spending up to 40% of their time on platform-specific model tuning rather than core innovation due to the lack of workflow interoperability. This issue stems from the diverse array of processing units, each with proprietary architectures, forcing a bespoke approach to runtime optimization.
- The absence of a universal standard that covers 100% of new model features means achieving peak performance can require a 2x increase in engineering resources for cross-platform validation.
- This heterogeneity creates a persistent accuracy-performance tradeoff, complicating MLOps pipelines and slowing the deployment of AI, as organizations must balance the high cost of customization against the risk of suboptimal performance on different hardware accelerators.
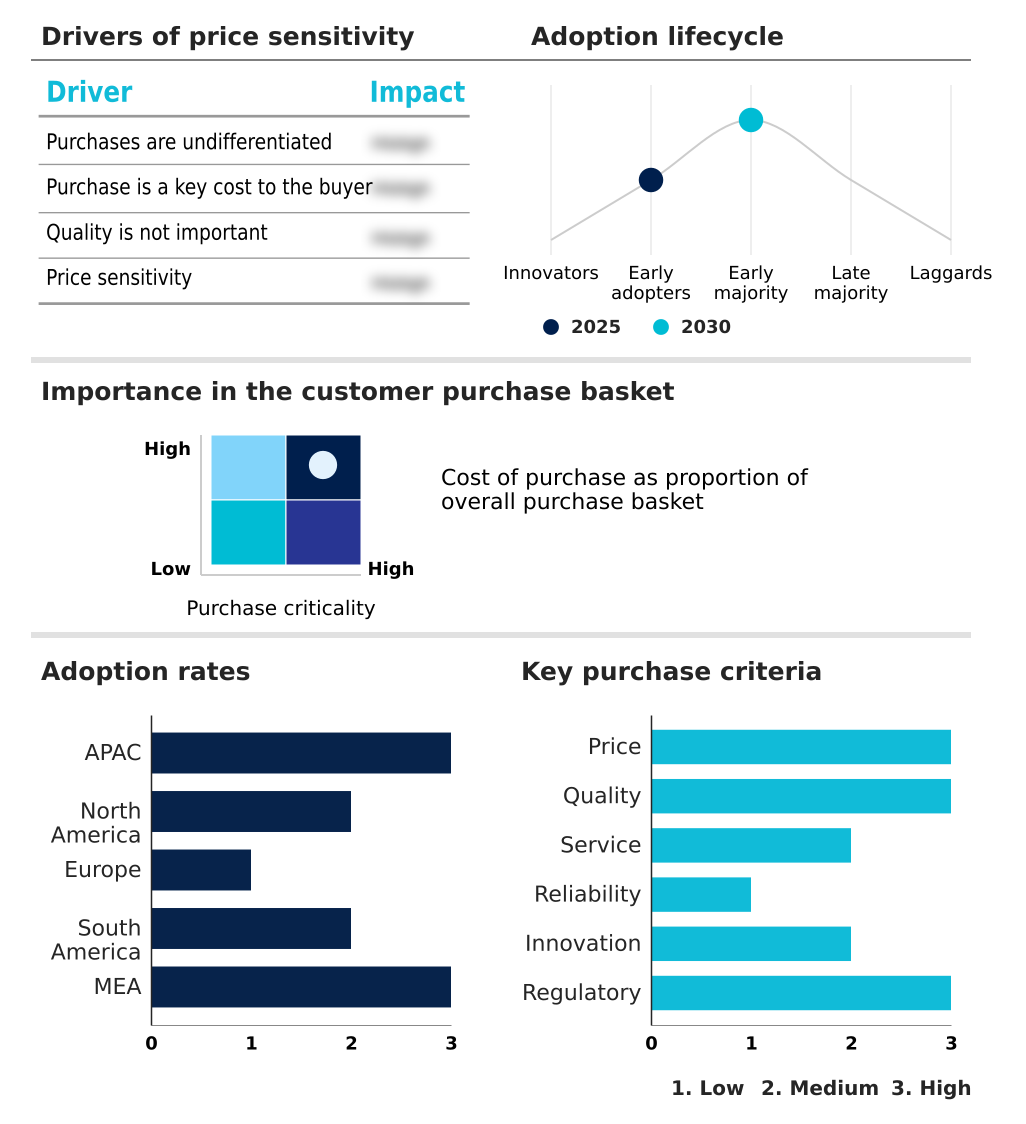
Exclusive Technavio Analysis on Customer Landscape
The model inference optimization tools market forecasting report includes the adoption lifecycle of the market, covering from the innovator’s stage to the laggard’s stage. It focuses on adoption rates in different regions based on penetration. Furthermore, the model inference optimization tools market report also includes key purchase criteria and drivers of price sensitivity to help companies evaluate and develop their market growth analysis strategies.
Customer Landscape of Model Inference Optimization Tools Industry
Competitive Landscape
Companies are implementing various strategies, such as strategic alliances, model inference optimization tools market forecast, partnerships, mergers and acquisitions, geographical expansion, and product/service launches, to enhance their presence in the industry.
Advanced Micro Devices Inc. - Delivering optimized deep learning inference acceleration, the tools support deployment across proprietary CPU, GPU, and NPU hardware architectures for diverse workloads.
The industry research and growth report includes detailed analyses of the competitive landscape of the market and information about key companies, including:
- Advanced Micro Devices Inc.
- Alibaba Group Holding Ltd.
- Amazon Web Services Inc.
- Axelera AI
- Cerebras Systems Inc.
- Gcore
- Google LLC
- Graphcore Ltd.
- Groq Inc.
- Hugging Face Inc.
- IBM Corp.
- Intel Corp.
- Microsoft Corp.
- Modular Inc.
- NVIDIA Corp.
- Qualcomm Inc.
- Recogni
- Scaleway SAS
- Tenstorrent Inc.
Qualitative and quantitative analysis of companies has been conducted to help clients understand the wider business environment as well as the strengths and weaknesses of key industry players. Data is qualitatively analyzed to categorize companies as pure play, category-focused, industry-focused, and diversified; it is quantitatively analyzed to categorize companies as dominant, leading, strong, tentative, and weak.
Market Intelligence Radar: High-Impact Developments & Growth Signals
- In the Application Software industry, the integration of AI capabilities into over 75% of core enterprise platforms such as ERP and CRM has significantly driven demand for model inference optimization tools to ensure embedded AI features are performant and cost-effective for enterprise automation.
- The enforcement of stringent data privacy regulations like GDPR has compelled a shift toward on-device and sovereign AI infrastructure, directly increasing the need for optimization tools that facilitate edge AI acceleration and local processing.
- A dominant trend toward cloud-based delivery models and SaaS has created a market for managed optimization services that integrate seamlessly with existing MLOps pipelines, altering how enterprises procure and deploy AI performance solutions.
- The strategic push for hyper-automation and enhanced workflow interoperability across business processes requires continuous, low-latency AI decisioning, which is only achievable through highly optimized models capable of real-time AI processing.
Dive into Technavio’s robust research methodology, blending expert interviews, extensive data synthesis, and validated models for unparalleled Model Inference Optimization Tools Market insights. See full methodology.
| Market Scope | |
|---|---|
| Page number | 313 |
| Base year | 2025 |
| Historic period | 2020-2024 |
| Forecast period | 2026-2030 |
| Growth momentum & CAGR | Accelerate at a CAGR of 25.1% |
| Market growth 2026-2030 | USD 224273.5 million |
| Market structure | Fragmented |
| YoY growth 2025-2026(%) | 21.9% |
| Key countries | China, Japan, India, South Korea, Taiwan, Indonesia, US, Canada, Mexico, Germany, UK, France, The Netherlands, Sweden, Spain, Brazil, Argentina, Chile, UAE, Israel, Saudi Arabia, South Africa and Egypt |
| Competitive landscape | Leading Companies, Market Positioning of Companies, Competitive Strategies, and Industry Risks |
Research Analyst Overview
- The ecosystem for model inference optimization tools is a complex interplay of hardware suppliers, cloud platforms, and end-users, where successful integration can reduce inference latency by over 50%. Silicon vendors are the primary technology suppliers, providing the foundational hardware architectures and low-level software libraries.
- These are leveraged by solution providers, including major cloud service operators and specialized software companies, who build and distribute the optimization frameworks. These tools are then integrated into enterprise MLOps pipelines for consumption by end-users in sectors such as automotive and healthcare, which together represent over 30% of the market.
- Supporting entities, including open-source projects and academic research labs, continually fuel innovation by developing new compression algorithms and performance benchmarks, ensuring the value chain remains dynamic and responsive to the escalating demands of next-generation AI models.
What are the Key Data Covered in this Model Inference Optimization Tools Market Research and Growth Report?
-
What is the expected growth of the Model Inference Optimization Tools Market between 2026 and 2030?
-
The Model Inference Optimization Tools Market is expected to grow by USD 224.27 billion during 2026-2030, registering a CAGR of 25.1%. Year-over-year growth in 2026 is estimated at 21.9%%. This acceleration is shaped by rapid proliferation of edge computing and on device intelligence , which is intensifying demand across multiple end-use verticals covered in the report.
-
-
What segmentation does the market report cover?
-
The report is segmented by Deployment (Cloud, On-premises, and Edge), End-user (BFSI, Healthcare, Retail and e-commerce, Automotive, and Others), Application (Machine learning, Generative AI, Natural language processing (NLP), Computer vision, and Others) and Geography (APAC, North America, Europe, South America, Middle East and Africa). Among these, the Cloud segment is estimated to witness significant growth during the forecast period, driven by rising adoption across key application areas. Each segment includes detailed qualitative and quantitative analysis, along with historical data from 2020-2024 and forecasts through 2030 with year-over-year growth rates.
-
-
Which regions are analyzed in the report?
-
The report covers APAC, North America, Europe, South America and Middle East and Africa. APAC is estimated to contribute 47.4% to market growth during the forecast period. Country-level analysis includes China, Japan, India, South Korea, Taiwan, Indonesia, US, Canada, Mexico, Germany, UK, France, The Netherlands, Sweden, Spain, Brazil, Argentina, Chile, UAE, Israel, Saudi Arabia, South Africa and Egypt, with dedicated market size tables and year-over-year growth for each.
-
-
What are the key growth drivers and market challenges?
-
The primary driver is rapid proliferation of edge computing and on device intelligence , which is accelerating investment and industry demand. The main challenge is prohibitive computational costs and infrastructure inefficiency , creating operational barriers for key market participants. The report quantifies the impact of each driver and challenge across 2026 and 2030 with comparative analysis.
-
-
Who are the major players in the Model Inference Optimization Tools Market?
-
Key vendors include Advanced Micro Devices Inc., Alibaba Group Holding Ltd., Amazon Web Services Inc., Axelera AI, Cerebras Systems Inc., Gcore, Google LLC, Graphcore Ltd., Groq Inc., Hugging Face Inc., IBM Corp., Intel Corp., Microsoft Corp., Modular Inc., NVIDIA Corp., Qualcomm Inc., Recogni, Scaleway SAS and Tenstorrent Inc.. The report provides qualitative and quantitative analysis categorizing companies as dominant, leading, strong, tentative, and weak based on their market positioning. Company profiles include business segment analysis, SWOT assessment, key offerings, and recent strategic developments.
-
Market Research Insights
- The competitive landscape for model inference optimization tools is increasingly concentrated, with the top three hardware vendors commanding over 80% of the market for AI accelerators and their corresponding software stacks.
- Pioneers like NVIDIA and Intel are intensely focused on hardware-software co-design; for example, recent updates to software frameworks deliver up to a 4x increase in inference throughput via advanced quantization techniques. These innovations directly address enterprise demand for reduced latency in generative AI applications, where responsiveness is critical for user adoption.
- However, this deep integration creates a challenge of vendor lock-in. In response, open-source-focused players like Hugging Face and Modular are gaining traction by offering hardware-agnostic platforms that prioritize interoperability and developer flexibility across different silicon architectures, providing a crucial alternative for enterprises seeking to avoid dependency on a single ecosystem.
We can help! Our analysts can customize this model inference optimization tools market research report to meet your requirements.
 RIA -
RIA - 
