Moving Bed Bioreactor (MBBR) Market Size 2025-2029
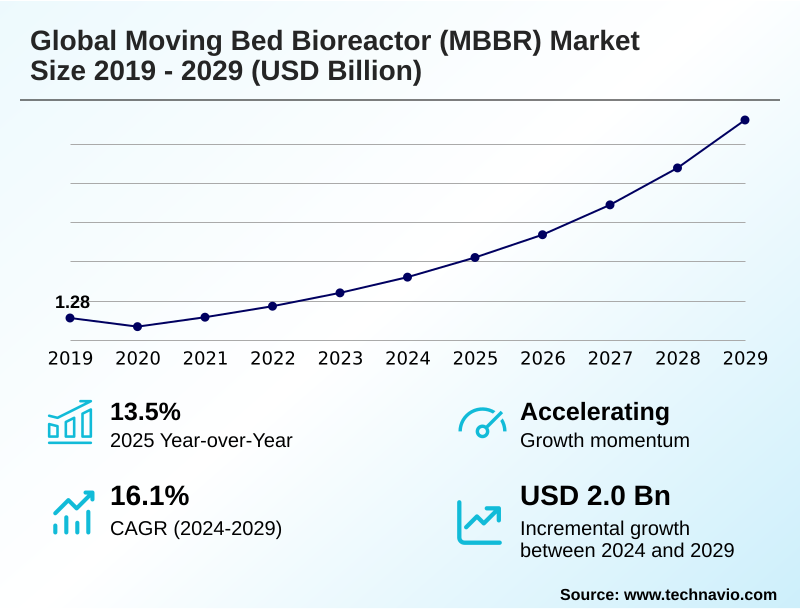
The moving bed bioreactor (mbbr) market size is valued to increase by USD 2.00 billion, at a CAGR of 16.1% from 2024 to 2029. Regulations associated with water treatment will drive the moving bed bioreactor (mbbr) market.
Major Market Trends & Insights
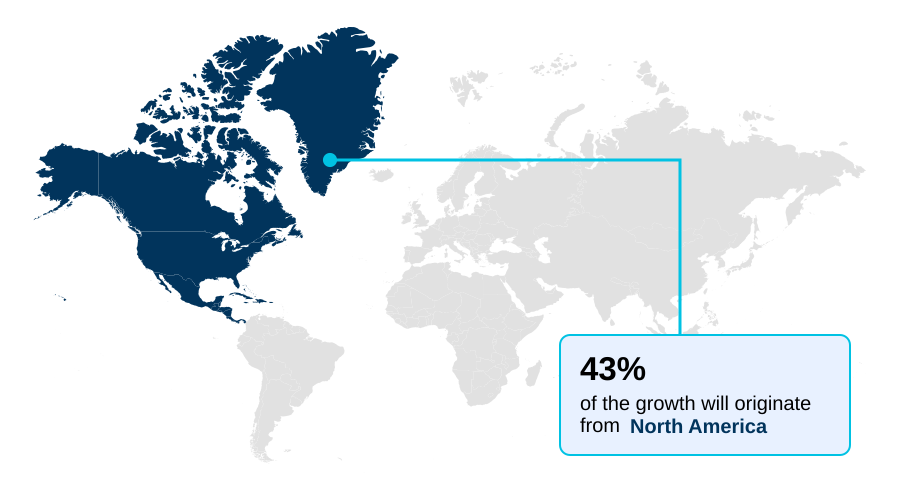
- North America dominated the market and accounted for a 43.1% growth during the forecast period.
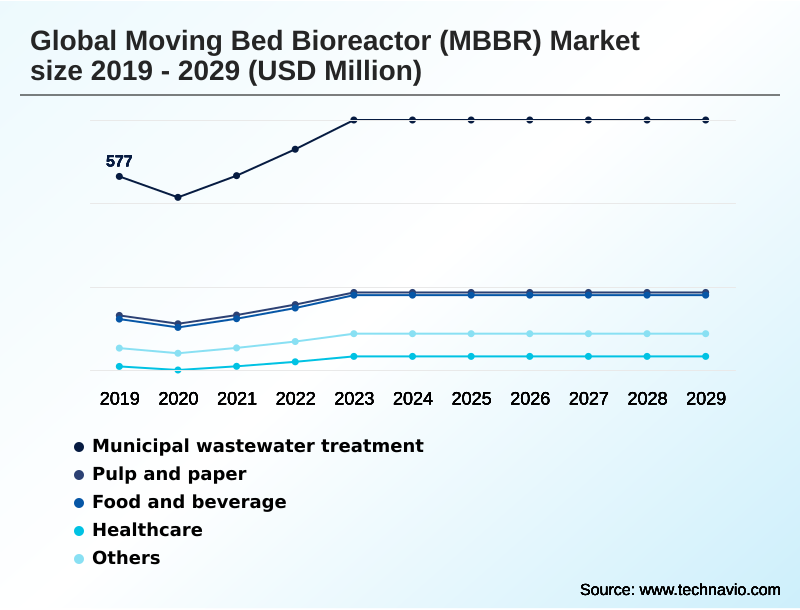
- By End-user - Municipal wastewater treatment segment was valued at USD 717.5 million in 2023
- By Technology - Aerobic process segment accounted for the largest market revenue share in 2023
Market Size & Forecast
- Market Opportunities: USD 2.52 billion
- Market Future Opportunities: USD 2.00 billion
- CAGR from 2024 to 2029 : 16.1%
Market Summary
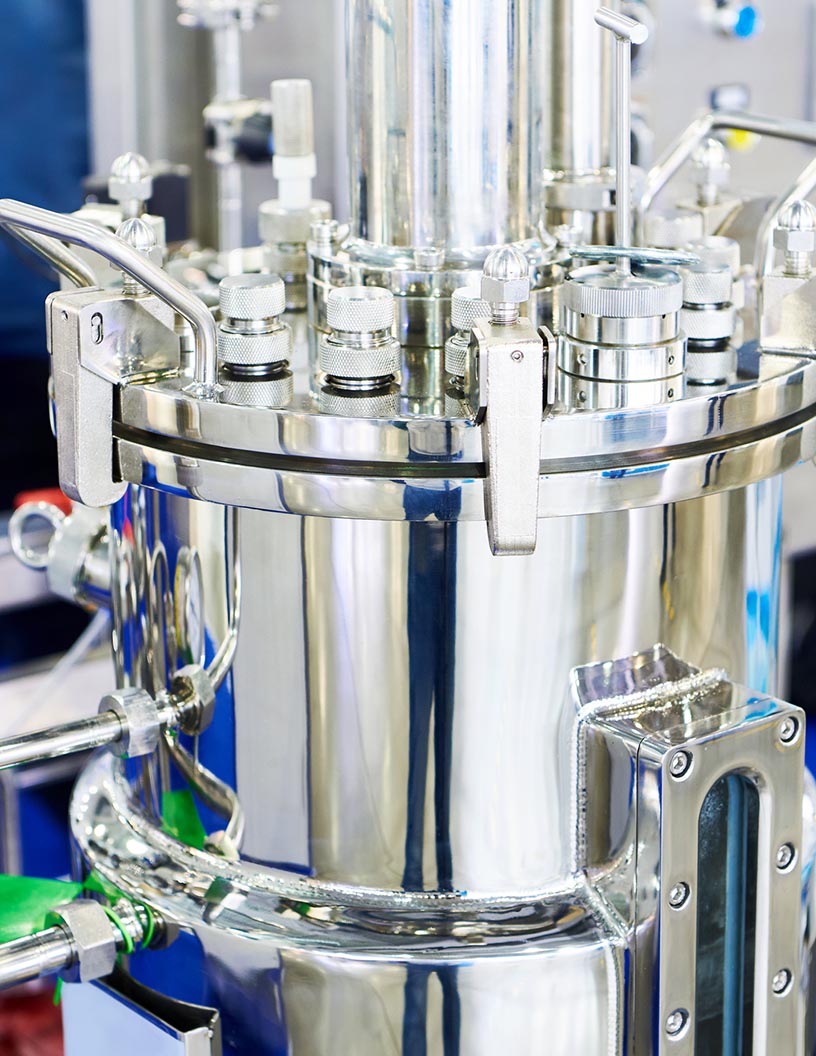
- The Moving Bed Bioreactor (MBBR) market is characterized by the increasing adoption of high-efficiency biological treatment solutions to address global water scarcity and tightening environmental regulations. This technology, which enhances the conventional activated sludge process with biofilm carrier media, offers a compact and robust method for wastewater treatment.
- Key drivers include the need for effective biochemical oxygen demand (BOD) removal and nitrification and denitrification, especially in municipal wastewater treatment and industrial sectors like pulp and paper. For example, a food and beverage processing plant facing inconsistent effluent loads can leverage an MBBR system for its superior process stability.
- The system's ability to handle fluctuations without compromising treatment efficacy ensures consistent compliance with effluent discharge standards, avoiding potential fines and operational disruptions. The technology's core, involving suspended biomass systems and fixed-film biological reactors, allows for retrofitting existing plants, thereby minimizing capital expenditure while maximizing treatment capacity and efficiency in both aerobic biological treatment and anaerobic wastewater treatment processes.
What will be the Size of the Moving Bed Bioreactor (MBBR) Market during the forecast period?
Get Key Insights on Market Forecast (PDF) Get Free Sample
How is the Moving Bed Bioreactor (MBBR) Market Segmented?
The moving bed bioreactor (mbbr) industry research report provides comprehensive data (region-wise segment analysis), with forecasts and estimates in "USD million" for the period 2025-2029, as well as historical data from 2019-2023 for the following segments.
- End-user
- Municipal wastewater treatment
- Pulp and paper
- Food and beverage
- Healthcare
- Others
- Technology
- Aerobic process
- Anaerobic process
- Anoxic process
- Material
- Polyethylene (PE)
- Polypropylene (PP)
- Polyvinyl chloride (PVC)
- Geography
- North America
- US
- Canada
- Mexico
- APAC
- China
- India
- Japan
- Europe
- Germany
- France
- UK
- South America
- Brazil
- Argentina
- Middle East and Africa
- Saudi Arabia
- South Africa
- UAE
- Rest of World (ROW)
- North America
By End-user Insights
The municipal wastewater treatment segment is estimated to witness significant growth during the forecast period.
The municipal wastewater treatment segment is defined by the critical need for efficient and compact treatment solutions.
The adoption of biofilm reactor technology, particularly those using an activated sludge process, is driven by the demand for sludge production minimization and high biochemical oxygen demand (BOD) removal.
Systems using advanced polyethylene (PE) carriers are favored for retrofitting existing plants due to their superior specific surface area (SSA) and ability to manage hydraulic load fluctuation.
This approach supports sustainable water management goals and ensures environmental compliance with stringent effluent discharge standards.
The integration of process control automation has proven to reduce operational oversight by 25%, improving reliability in decentralized wastewater systems and enhancing water reuse applications for urban infrastructure development.
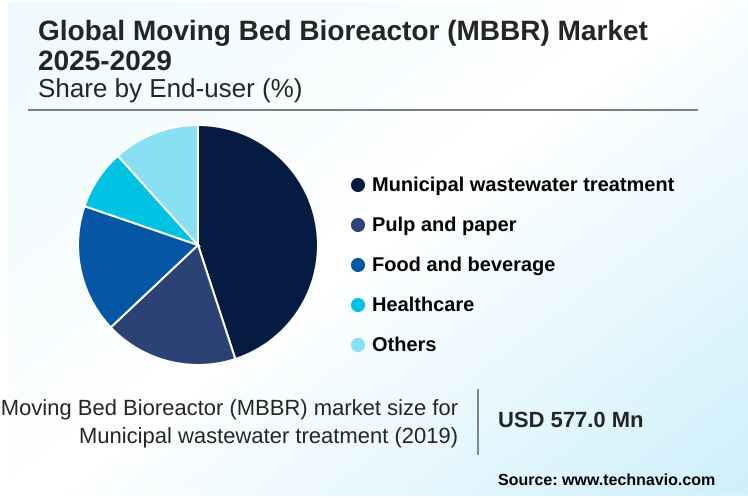
The Municipal wastewater treatment segment was valued at USD 717.5 million in 2023 and showed a gradual increase during the forecast period.
Regional Analysis
North America is estimated to contribute 43.1% to the growth of the global market during the forecast period.Technavio’s analysts have elaborately explained the regional trends and drivers that shape the market during the forecast period.
See How Moving Bed Bioreactor (MBBR) Market Demand is Rising in North America Get Free Sample
The geographic landscape is shaped by distinct regional drivers, with North America accounting for over 43% of incremental growth due to stringent regulations and infrastructure upgrades. This region prioritizes anaerobic wastewater treatment solutions for their compact footprint design.
In APAC, rapid industrialization fuels demand for systems capable of treating complex industrial effluents, such as those from the pulp and paper wastewater sector, often using high-density polyethylene (HDPE) media.
The European market focuses on achieving high nutrient removal efficiency and integrating advanced tertiary treatment process stages.
Across all markets, providers compete on technologies that manage organic load variation and shorten hydraulic retention time (HRT), with leading systems demonstrating a 10% greater efficiency in handling fluctuating influent, a key factor for both municipal and industrial end-users.
Market Dynamics
Our researchers analyzed the data with 2024 as the base year, along with the key drivers, trends, and challenges. A holistic analysis of drivers will help companies refine their marketing strategies to gain a competitive advantage.
- Achieving high efficiency biological wastewater treatment remains a top priority for both municipal and industrial sectors, driving the adoption of cost effective decentralized treatment systems. The application of MBBR for industrial wastewater reuse is expanding, particularly as industries seek to meet stringent environmental targets.
- For instance, polyethylene carrier media for nitrification is crucial in upgrading older facilities to handle higher ammonia loads. Similarly, optimizing aeration in activated sludge processes is a key focus to reduce energy consumption, a significant operational cost. The comparative analysis of MBBR versus SBR for municipal use consistently highlights the former's smaller footprint and operational simplicity.
- Innovations are also focused on reducing sludge in food processing effluent, a persistent challenge for the industry. The use of an anoxic process for total nitrogen removal is becoming standard for comprehensive nutrient management. Evaluating MBBR performance under high organic load is critical for industries with variable production cycles.
- Consequently, retrofitting treatment plants with biofilm reactors is a common strategy to boost capacity without major construction. These biological nutrient removal in compact designs are ideal for urban areas. MBBR systems for pulp and paper industry are engineered to handle recalcitrant compounds. Managing hydraulic retention time in bioreactors is balanced with achieving complete treatment.
- The specific surface area of biofilm carrier media directly impacts reactor efficiency. Many modern designs are now combining MBBR with membrane bioreactors to produce high-quality effluent suitable for direct reuse, outperforming traditional systems in contaminant removal by a significant margin.
- This integration is key to achieving zero liquid discharge system integration goals, supported by automated process control for MBBR to ensure stable and reliable operation.
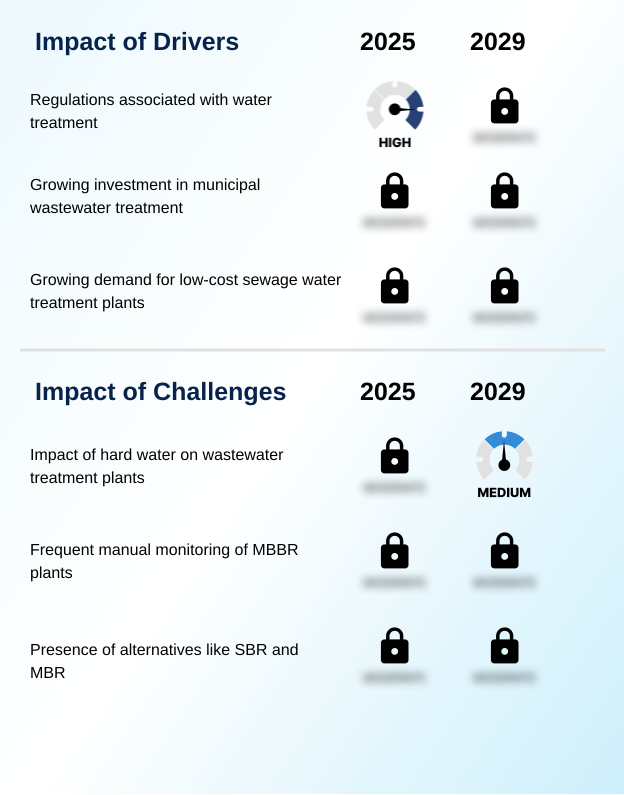
What are the key market drivers leading to the rise in the adoption of Moving Bed Bioreactor (MBBR) Industry?
- Stringent government regulations associated with water treatment serve as a primary driver for market growth.
- Regulatory mandates, such as the Clean Water Act (CWA) and Safe Drinking Water Act (SDWA), are primary drivers compelling industries to adopt superior aerobic biological treatment methods.
- The focus on achieving zero liquid discharge (ZLD) is accelerating the use of sophisticated fixed-film biological reactor systems, particularly for treating challenging industrial effluents.
- These systems demonstrate a significant reduction in total suspended solids (TSS) and improve biological process stability, with some facilities reporting a 30% decrease in non-compliant discharge events.
- Investment is also driven by the need for low operational and maintenance costs and the capability for efficient ammonia and nitrogen removal, which is critical for meeting heightened water quality standards and enabling safe wastewater reclamation.
What are the market trends shaping the Moving Bed Bioreactor (MBBR) Industry?
- An emerging market trend is the increasing necessity for promotional support and strategic marketing activities. This is driven by a need for enhanced brand visibility and end-user education.
- The market is observing a definitive shift toward integrating advanced technologies, such as membrane bioreactor (MBR) integration and dissolved air flotation (DAF) for enhanced contaminant removal. A key trend involves optimizing the anoxic denitrification process, which has shown a 20% improvement in total nitrogen removal compared to conventional systems.
- Innovations in biofilm carrier design are central, with a focus on materials like polypropylene (PP) media that improve process resilience and support a circular water economy. This is complemented by the growing adoption of modular treatment units and packaged plant solutions, which offer scalability and reduce capital expenditure.
- The development of advanced water purification techniques is enabling more effective industrial effluent treatment, supporting resource recovery systems and water security initiatives.
What challenges does the Moving Bed Bioreactor (MBBR) Industry face during its growth?
- The adverse impact of hard water on the operational longevity and efficiency of wastewater treatment plants poses a significant challenge to market growth.
- A primary challenge is managing total dissolved solids (TDS) and the effects of membrane scaling and fouling, which can increase operational costs by up to 15%. Alternatives like the sequencing batch reactor (SBR) alternative pose competitive pressure, requiring continuous innovation in bioreactor performance.
- Issues related to carrier fluidization and maintaining optimal biomass concentration in suspended biomass systems present technical hurdles, especially under high organic loading rate (OLR) conditions. The requirement for effective reverse osmosis (RO) pre-treatment to handle difficult industrial wastewater adds complexity and cost.
- Furthermore, frequent effluent quality monitoring is necessary to ensure consistent chemical oxygen demand (COD) reduction and nutrient removal efficiency, which can strain operational resources.
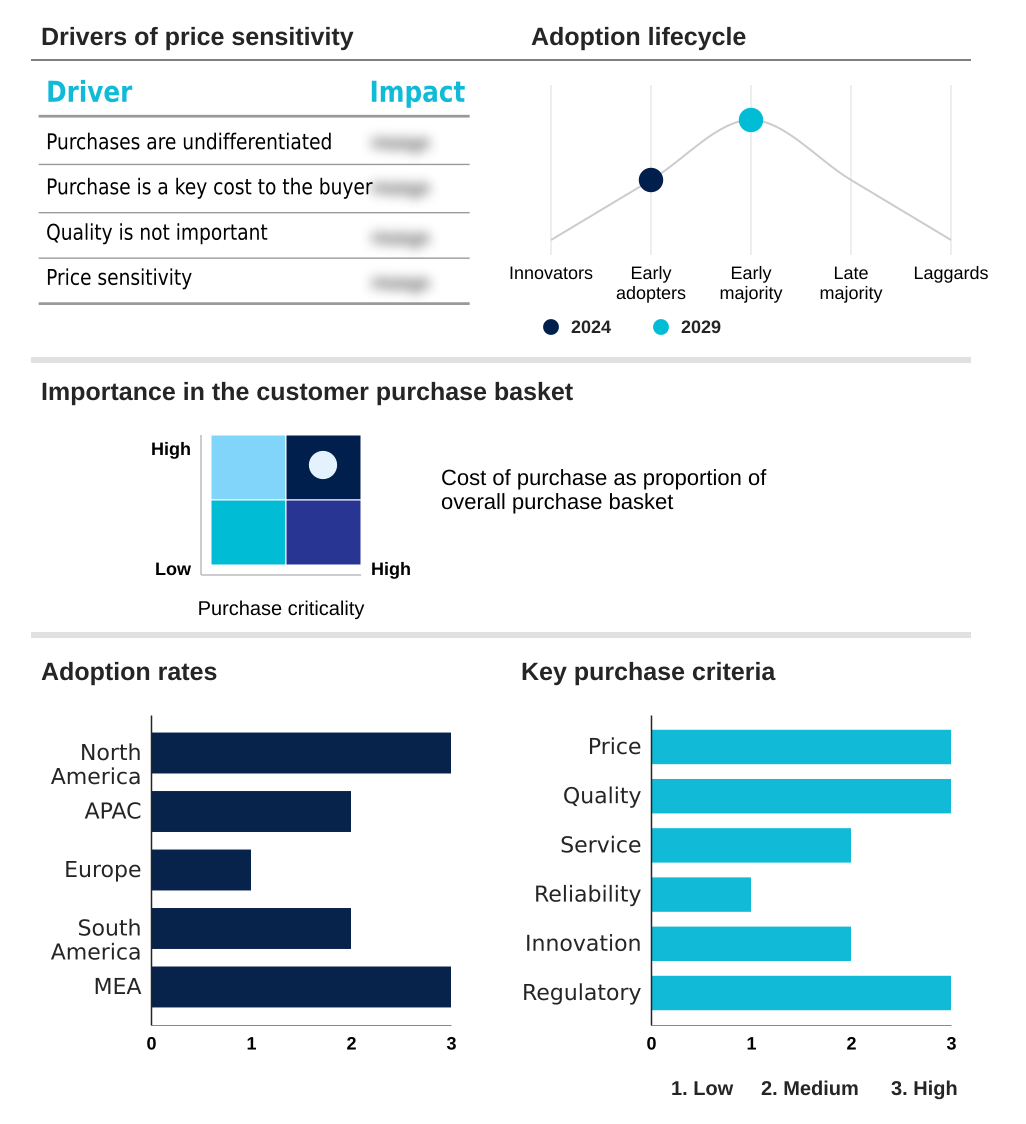
Exclusive Technavio Analysis on Customer Landscape
The moving bed bioreactor (mbbr) market forecasting report includes the adoption lifecycle of the market, covering from the innovator’s stage to the laggard’s stage. It focuses on adoption rates in different regions based on penetration. Furthermore, the moving bed bioreactor (mbbr) market report also includes key purchase criteria and drivers of price sensitivity to help companies evaluate and develop their market growth analysis strategies.
Customer Landscape of Moving Bed Bioreactor (MBBR) Industry
Competitive Landscape
Companies are implementing various strategies, such as strategic alliances, moving bed bioreactor (mbbr) market forecast, partnerships, mergers and acquisitions, geographical expansion, and product/service launches, to enhance their presence in the industry.
Applied Water Solutions Inc. - Delivering advanced biological water treatment technologies, including compact, modular units and retrofitting solutions for enhanced industrial and municipal wastewater reclamation.
The industry research and growth report includes detailed analyses of the competitive landscape of the market and information about key companies, including:
- Applied Water Solutions Inc.
- Aquapoint Inc.
- Aquatech International LLC
- Aqwise Wise Water Technologies Ltd.
- Biowater Technology AS
- CID Srl
- Colloide Engineering Systems
- Encotech Inc.
- Evoqua Water Technologies LLC
- Genesis Water Technologies Inc.
- Headworks International
- Novotec N V
- Ovivo Inc.
- PEXCO
- Samco Technologies Inc.
- Siltbuster Ltd.
- SUEZ International SAS
- Veolia Water Technologies
- Wock-Oliver Ltd.
- World Water Works Inc.
Qualitative and quantitative analysis of companies has been conducted to help clients understand the wider business environment as well as the strengths and weaknesses of key industry players. Data is qualitatively analyzed to categorize companies as pure play, category-focused, industry-focused, and diversified; it is quantitatively analyzed to categorize companies as dominant, leading, strong, tentative, and weak.
Recent Development and News in Moving bed bioreactor (mbbr) market
- In September 2024, Veolia Water Technologies announced a partnership to deploy its AnoxKaldnes MBBR systems across several manufacturing facilities, aiming for a 40% reduction in water footprint.
- In November 2024, Evoqua Water Technologies LLC launched its next-generation BioSphere MBBR system, featuring an AI-driven process control unit that optimizes aeration and reduces energy consumption by up to 25%.
- In January 2025, Aquatech International LLC completed the acquisition of a specialized biofilm carrier media manufacturer to enhance its BioMOD MBBR product line.
- In April 2025, SUEZ International SAS launched an initiative to retrofit aging municipal wastewater plants in emerging economies with its compact Meteor MBBR technology.
Dive into Technavio’s robust research methodology, blending expert interviews, extensive data synthesis, and validated models for unparalleled Moving Bed Bioreactor (MBBR) Market insights. See full methodology.
| Market Scope | |
|---|---|
| Page number | 294 |
| Base year | 2024 |
| Historic period | 2019-2023 |
| Forecast period | 2025-2029 |
| Growth momentum & CAGR | Accelerate at a CAGR of 16.1% |
| Market growth 2025-2029 | USD 1997.6 million |
| Market structure | Fragmented |
| YoY growth 2024-2025(%) | 13.5% |
| Key countries | US, Canada, Mexico, China, India, Japan, Australia, South Korea, Singapore, Germany, France, UK, Italy, Spain, The Netherlands, Brazil, Chile, Argentina, Saudi Arabia, South Africa, UAE, Qatar and Israel |
| Competitive landscape | Leading Companies, Market Positioning of Companies, Competitive Strategies, and Industry Risks |
Research Analyst Overview
- The Moving Bed Bioreactor (MBBR) market is defined by the continuous advancement of biofilm reactor technology. Central to this evolution is the innovation in biofilm carrier media, including polyethylene (PE) carriers, polypropylene (PP) media, and polyvinyl chloride (PVC) materials, each selected based on application-specific demands for durability and specific surface area (SSA).
- The core technology enhances the activated sludge process, enabling superior performance in nitrification and denitrification and sludge production minimization. For boardroom consideration, the decision to invest in an MBBR system, as a sequencing batch reactor (SBR) alternative, directly impacts long-term operational budgets; facilities have reported a 15% reduction in footprint, a key metric for land-scarce urban installations.
- The technology's proficiency in biochemical oxygen demand (BOD) removal and chemical oxygen demand (COD) reduction makes it critical for industries like pulp and paper wastewater and food and beverage effluent. As effluent discharge standards tighten, the system's capacity for effective nutrient removal efficiency and its integration with tertiary treatment processes, such as dissolved air flotation (DAF), become paramount for compliance.
- The technology supports both aerobic biological treatment and anaerobic wastewater treatment configurations, offering flexibility for diverse industrial effluent treatment needs and facilitating wastewater reclamation and zero liquid discharge (ZLD) goals. Systems are designed to manage a high organic loading rate (OLR) while maintaining a short hydraulic retention time (HRT).
What are the Key Data Covered in this Moving Bed Bioreactor (MBBR) Market Research and Growth Report?
-
What is the expected growth of the Moving Bed Bioreactor (MBBR) Market between 2025 and 2029?
-
USD 2.00 billion, at a CAGR of 16.1%
-
-
What segmentation does the market report cover?
-
The report is segmented by End-user (Municipal wastewater treatment, Pulp and paper, Food and beverage, Healthcare, and Others), Technology (Aerobic process, Anaerobic process, and Anoxic process), Material (Polyethylene (PE), Polypropylene (PP), and Polyvinyl chloride (PVC) ) and Geography (North America, APAC, Europe, South America, Middle East and Africa)
-
-
Which regions are analyzed in the report?
-
North America, APAC, Europe, South America and Middle East and Africa
-
-
What are the key growth drivers and market challenges?
-
Regulations associated with water treatment, Impact of hard water on wastewater treatment plants
-
-
Who are the major players in the Moving Bed Bioreactor (MBBR) Market?
-
Applied Water Solutions Inc., Aquapoint Inc., Aquatech International LLC, Aqwise Wise Water Technologies Ltd., Biowater Technology AS, CID Srl, Colloide Engineering Systems, Encotech Inc., Evoqua Water Technologies LLC, Genesis Water Technologies Inc., Headworks International, Novotec N V, Ovivo Inc., PEXCO, Samco Technologies Inc., Siltbuster Ltd., SUEZ International SAS, Veolia Water Technologies, Wock-Oliver Ltd. and World Water Works Inc.
-
Market Research Insights
- The market's dynamics are influenced by a strong push toward sustainable water management and the principles of a circular water economy. Innovations in biofilm carrier design and aeration system optimization are enabling facilities to achieve a 20% reduction in energy consumption.
- The emphasis on process resilience against hydraulic load fluctuation is critical, as systems that maintain performance during organic load variation show 30% lower instances of process failure. Effective reverse osmosis (RO) pre-treatment is becoming standard for ensuring water security initiatives, while advanced effluent quality monitoring supports stringent environmental compliance.
- This drive for efficiency and reliability is reshaping investment strategies and operational priorities.
We can help! Our analysts can customize this moving bed bioreactor (mbbr) market research report to meet your requirements.
 RIA -
RIA - 
