
Multi-sensory AI Market Size 2025-2029
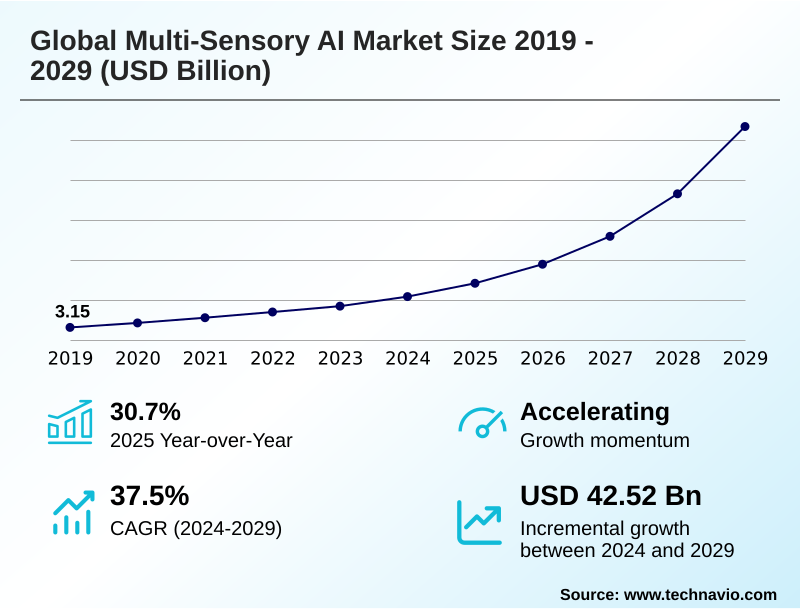
The multi-sensory ai market size is valued to increase by USD 42.52 billion, at a CAGR of 37.5% from 2024 to 2029. Increasing demand for enhanced user experiences will drive the multi-sensory ai market.
Major Market Trends & Insights
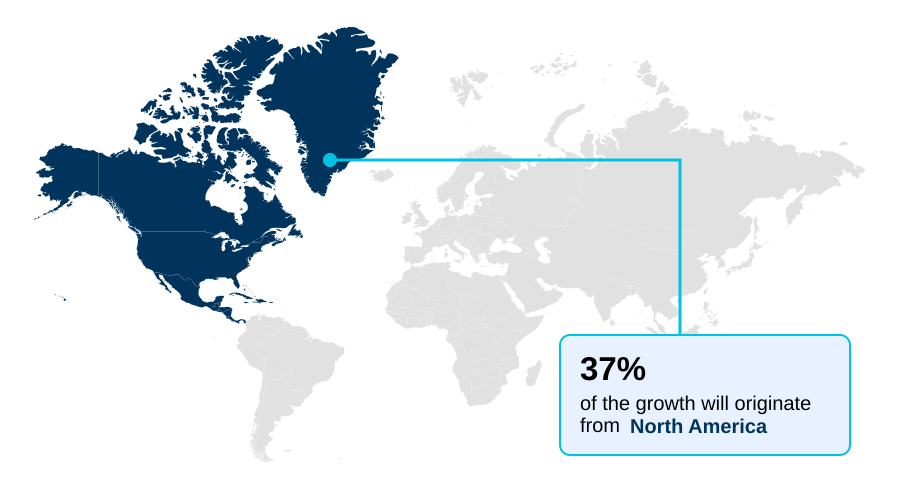
- North America dominated the market and accounted for a 37.2% growth during the forecast period.
- By Type - Vision-based AI segment was valued at USD 3.30 billion in 2023
- By Deployment - Cloud-based segment accounted for the largest market revenue share in 2023
Market Size & Forecast
- Market Opportunities: USD 50.22 billion
- Market Future Opportunities: USD 42.52 billion
- CAGR from 2024 to 2029 : 37.5%
Market Summary
- The multi-sensory AI market is defined by the integration of technologies that allow systems to process and interpret varied data streams, including visual, auditory, and tactile inputs. This multimodal approach fosters a more holistic understanding of complex environments, moving beyond the limitations of single-modality AI. Key drivers include the demand for more intuitive human-computer interaction and sophisticated automation.
- For instance, in warehouse logistics, AI-powered automation combines computer vision pipelines for inventory tracking with spatial audio processing to monitor equipment, improving operational efficiency. Advances in sensor data integration and multimodal fusion algorithms are crucial for developing context-aware AI systems. However, the market faces challenges related to real-time data synchronization and the high computational cost of processing diverse data formats.
- The rise of on-device AI processing and more efficient haptic feedback systems are key trends addressing these hurdles. As AI-driven sensor fusion matures, its application in areas like AI-driven diagnostics and predictive maintenance solutions is set to expand, enabling more nuanced and human-like perception in machines and creating new opportunities for personalized customer engagement and autonomous systems perception.
What will be the Size of the Multi-sensory AI Market during the forecast period?
Get Key Insights on Market Forecast (PDF) Get Free Sample
How is the Multi-sensory AI Market Segmented?
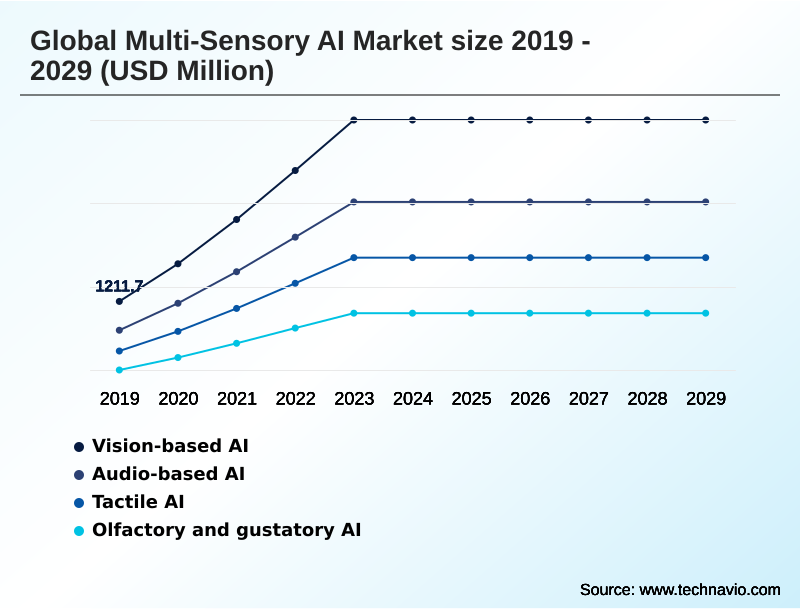
The multi-sensory ai industry research report provides comprehensive data (region-wise segment analysis), with forecasts and estimates in "USD million" for the period 2025-2029, as well as historical data from 2019-2023 for the following segments.
- Type
- Vision-based AI
- Audio-based AI
- Tactile AI
- Olfactory and gustatory AI
- Deployment
- Cloud-based
- On-premises
- Edge and on-device
- End-user
- Healthcare
- Automotive
- Consumer electronics
- Robotics and industrial automation
- Others
- Geography
- North America
- US
- Canada
- Mexico
- APAC
- China
- Japan
- India
- Europe
- Germany
- UK
- France
- South America
- Brazil
- Argentina
- Colombia
- Middle East and Africa
- Saudi Arabia
- UAE
- South Africa
- Rest of World (ROW)
- North America
By Type Insights
The vision-based ai segment is estimated to witness significant growth during the forecast period.
The vision-based AI segment is a cornerstone of the market, driven by advancements in computer vision pipelines and AI-powered automation. These systems mimic human sight to interpret visual information, enabling critical applications in industrial quality control and autonomous systems perception.
The integration of generative AI is enhancing model training through synthetic data augmentation, while a shift toward edge computing facilitates real-time data synchronization. This enables on-device processing for applications requiring immediate, real-time decision-making and enhanced situational awareness.
For instance, new edge platforms have been shown to reduce AI deployment times for enterprises by over 40%. The evolution of context-aware AI systems is further expanding capabilities, paving the way for more sophisticated human-robot collaboration and intelligent analysis.
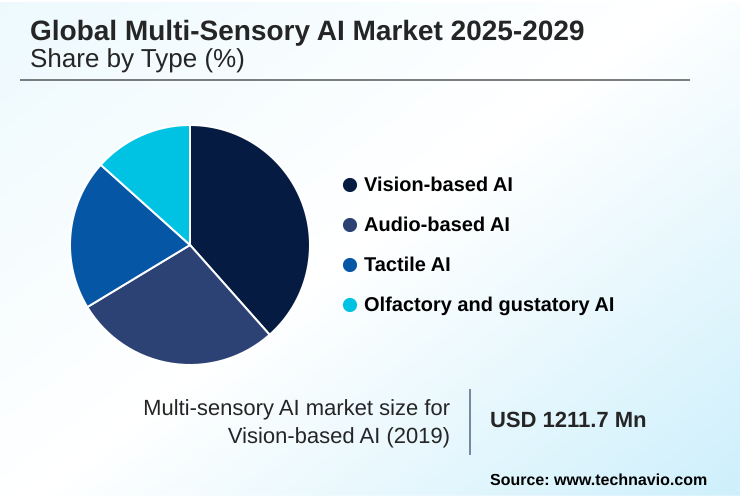
The Vision-based AI segment was valued at USD 3.30 billion in 2023 and showed a gradual increase during the forecast period.
Regional Analysis
North America is estimated to contribute 37.2% to the growth of the global market during the forecast period.Technavio’s analysts have elaborately explained the regional trends and drivers that shape the market during the forecast period.
See How Multi-sensory AI Market Demand is Rising in North America Get Free Sample
The geographic landscape of the market is characterized by varying adoption rates and strategic priorities.
North America leads in enterprise adoption, where the use of generative AI tools surged from 11% to 65% in just over a year, driven by mature cloud infrastructure and heavy R&D investment.
The region's focus is on developing ethical and responsible AI frameworks.
In APAC, rapid digital transformation and strong government support for AI infrastructure are fueling the fastest growth, with a focus on localized solutions like natural language understanding models for regional languages.
Europe's market is shaped by its pioneering regulatory environment, emphasizing transparency and trustworthy multimodal data analytics.
Meanwhile, emerging regions like South America and the Middle East are accelerating their digital agendas, with Brazil reporting that over 40 public and private institutions have launched machine learning projects to apply AI-driven sensor fusion and edge computing for AI to national challenges, including precision agriculture technologies and AI-driven diagnostics, as well as robotic process automation (RPA) and interactive entertainment platforms.
Market Dynamics
Our researchers analyzed the data with 2024 as the base year, along with the key drivers, trends, and challenges. A holistic analysis of drivers will help companies refine their marketing strategies to gain a competitive advantage.
- The multi-sensory AI market is advancing through the complex integration of diverse sensory inputs to create more contextually aware and interactive systems. A core focus is the real-time fusion of lidar and camera data, which is fundamental for improving the safety and reliability of autonomous platforms.
- In healthcare, affective computing for mental health monitoring is gaining traction, leveraging vocal biomarker analysis for early disease detection and providing non-invasive patient insights. Concurrently, haptic feedback integration in consumer electronics is becoming more sophisticated, enhancing user experiences in virtual reality and gaming.
- The development of generative AI for synthetic sensory dataset creation is helping to overcome data scarcity challenges, accelerating the training of more robust models. On-device natural language and vision processing is enabling faster, more secure applications on edge devices. For industrial settings, multimodal AI for predictive industrial maintenance is reducing downtime by analyzing visual, auditory, and vibrational data simultaneously.
- However, ethical considerations in multi-sensory data collection remain a significant hurdle, requiring transparent governance frameworks. The choice between cloud-based platforms for training multimodal models and optimizing multi-sensory AI on edge devices presents a strategic trade-off between computational power and latency.
- Specific applications like tactile AI applications in robotic surgery and spatial audio processing for augmented reality are pushing the boundaries of what is possible. Other key areas include digital olfaction for quality control in the food industry and deploying multi-sensory AI in smart retail environments.
- The core technical challenge remains the synchronization of heterogeneous sensory inputs, but progress in computer vision for automated quality inspection and human-robot collaboration using speech and gesture recognition is demonstrating significant value. This progress extends to new frontiers, including personalized learning platforms and achieving multimodal data fusion for enhanced situational awareness.
- Systems leveraging multimodal data fusion demonstrate a detection accuracy rate twice that of single-sensor systems, a crucial advantage for mission-critical operational planning.
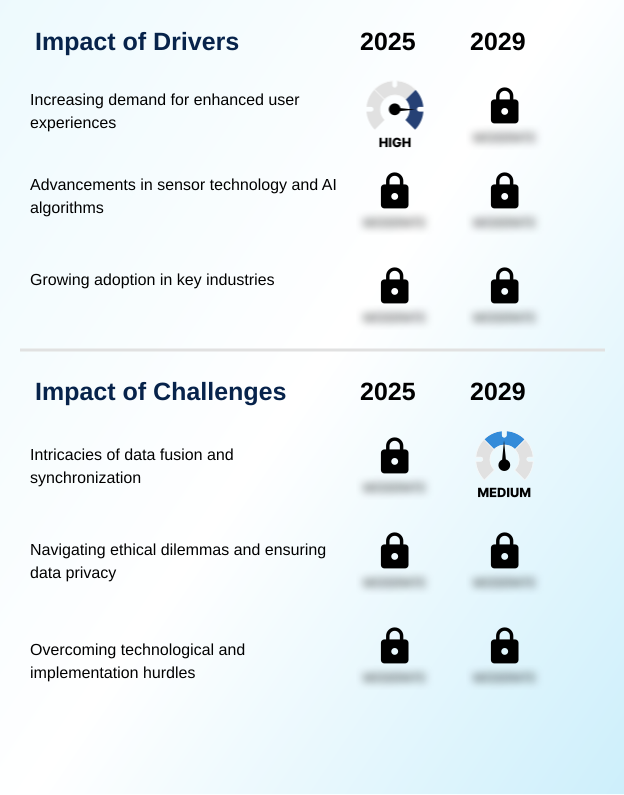
What are the key market drivers leading to the rise in the adoption of Multi-sensory AI Industry?
- The increasing demand for more immersive and enhanced user experiences is a key driver for market growth.
- Market growth is fundamentally driven by advancements in sensor technology and the increasing demand for immersive user experiences.
- Sophisticated multimodal fusion algorithms are enabling more effective sensor data integration from diverse sources, which is critical for applications like advanced driver-assistance systems (ADAS) and predictive maintenance solutions.
- The development of advanced haptic feedback systems and spatial audio processing technologies is creating more realistic and engaging digital interactions.
- In industrial settings, the use of digital twin simulation, powered by real-time sensory data, allows for a 45% improvement in pre-deployment testing accuracy.
- These technological breakthroughs are making multi-sensory AI not just a possibility but a practical tool for enhancing safety, efficiency, and user engagement across a wide range of industries.
What are the market trends shaping the Multi-sensory AI Industry?
- The notable surge in enterprise AI adoption and investment is a key upcoming trend, reshaping industries and creating substantial new growth opportunities.
- Key market trends are centered on the rapid proliferation of generative AI for sensory data and the dual growth of cloud-based ML platforms and on-device AI processing. The enterprise adoption of generative AI has surged, with a nearly sixfold increase in the US in just one year, driving demand for solutions that can create and interpret multimodal content.
- This enables more intuitive human-machine interfaces and deeper personalized customer engagement. The dominance of scalable cloud platforms democratizes access to powerful training tools, while the rise of edge computing is critical for real-time applications where low latency is paramount.
- This dual approach supports a broad range of applications, from vocal biomarker analysis in healthcare to advanced assistive technology development and the expansion of smart city infrastructure.
What challenges does the Multi-sensory AI Industry face during its growth?
- The intricacies of data fusion and synchronization across multiple sensory inputs present a key challenge affecting industry growth.
- A primary market challenge lies in navigating the technical complexities and ethical dilemmas associated with multi-sensory data. The intricacies of integrating novel inputs from tactile sensing technology and digital olfaction sensors create significant data fusion hurdles.
- Furthermore, the deployment of affective computing models, which interpret sensitive human emotional states, raises profound questions that require robust ethical AI frameworks and secure data governance. The lack of standardized protocols has contributed to project delays in over 50% of public-facing smart city initiatives.
- As the industry advances, overcoming these issues is crucial for building public trust and enabling scalable solutions in areas like supply chain optimization and fraud detection systems, where reliable and ethical neuromorphic computing hardware and software are paramount.
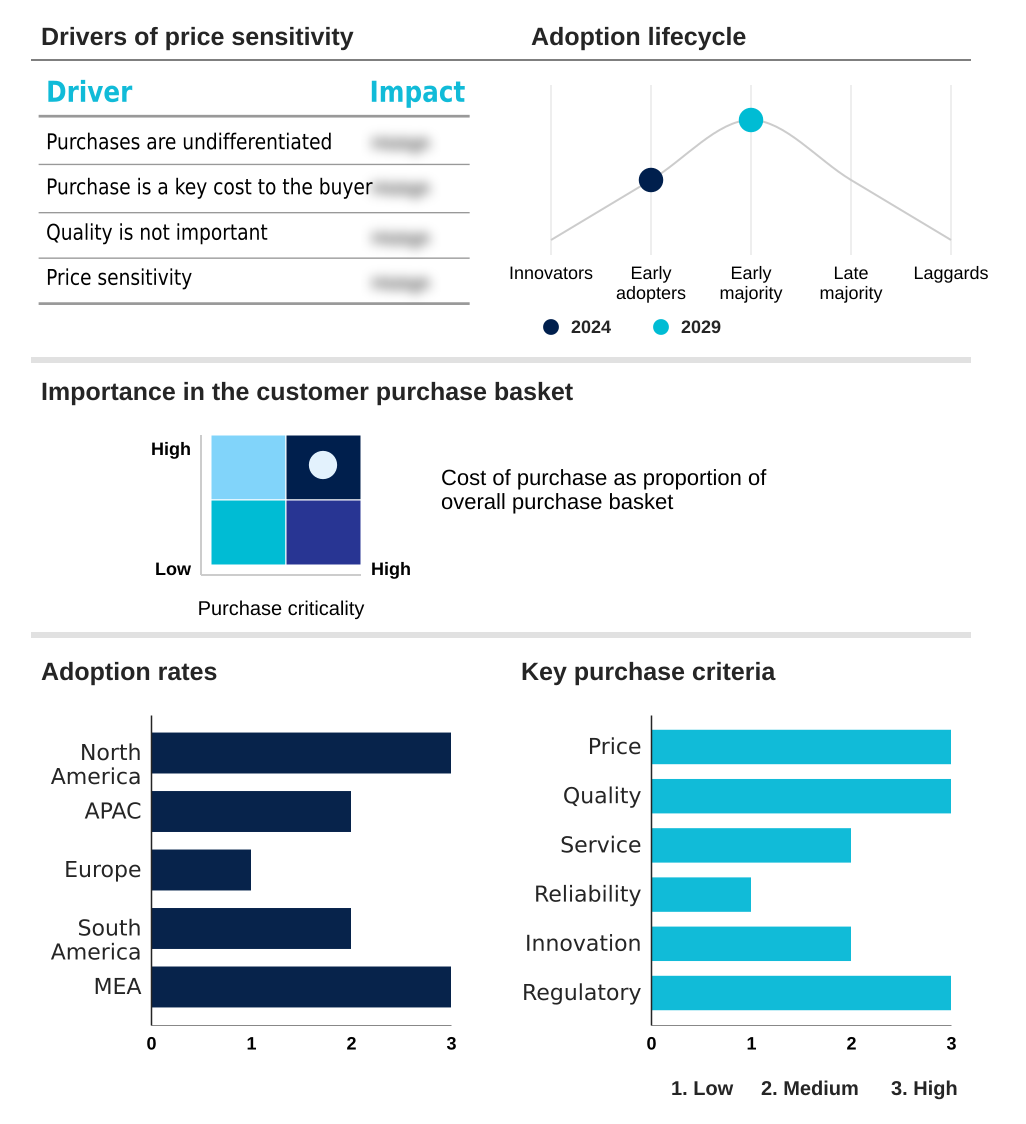
Exclusive Technavio Analysis on Customer Landscape
The multi-sensory ai market forecasting report includes the adoption lifecycle of the market, covering from the innovator’s stage to the laggard’s stage. It focuses on adoption rates in different regions based on penetration. Furthermore, the multi-sensory ai market report also includes key purchase criteria and drivers of price sensitivity to help companies evaluate and develop their market growth analysis strategies.
Customer Landscape of Multi-sensory AI Industry
Competitive Landscape
Companies are implementing various strategies, such as strategic alliances, multi-sensory ai market forecast, partnerships, mergers and acquisitions, geographical expansion, and product/service launches, to enhance their presence in the industry.
Advanced Micro Devices Inc. - GPU-accelerated vision, NLP, and speech models power multimodal AI workloads across data centers and edge devices, enabling advanced intelligent systems.
The industry research and growth report includes detailed analyses of the competitive landscape of the market and information about key companies, including:
- Advanced Micro Devices Inc.
- Amazon Web Services Inc.
- Apple Inc.
- Aryballe Technologies SAS
- Baidu Inc.
- Databricks Inc.
- Google LLC
- H2O.ai Inc.
- Huawei Technologies Co. Ltd.
- Intel Corp.
- IBM Corp.
- Microsoft Corp.
- NVIDIA Corp.
- OpenAI
- Palantir Technologies Inc.
- Qualcomm Inc.
- Robert Bosch GmbH
- SenseTime Group Inc.
- Siemens AG
Qualitative and quantitative analysis of companies has been conducted to help clients understand the wider business environment as well as the strengths and weaknesses of key industry players. Data is qualitatively analyzed to categorize companies as pure play, category-focused, industry-focused, and diversified; it is quantitatively analyzed to categorize companies as dominant, leading, strong, tentative, and weak.
Recent Development and News in Multi-sensory ai market
- In May 2025, NTT Corporation launched its Smart AI Agent Ecosystem, providing industry-specific multi-sensory AI solutions for the healthcare, automotive, and finance sectors.
- In February 2025, Boston Dynamics and the Robotics and AI Institute announced a strategic partnership to accelerate humanoid robot capabilities by developing a shared reinforcement learning training pipeline for the Atlas robot.
- In February 2025, NEOM and DataVolt entered into an agreement to construct a USD 5 billion, 1.5-gigawatt net-zero AI data center project, aiming to support the growing demand for generative AI workloads.
- In May 2025, G42, in partnership with global technology leaders, announced the development of Stargate UAE, a major initiative designed to significantly expand the nation's sovereign AI infrastructure and capabilities.
Dive into Technavio’s robust research methodology, blending expert interviews, extensive data synthesis, and validated models for unparalleled Multi-sensory AI Market insights. See full methodology.
| Market Scope | |
|---|---|
| Page number | 308 |
| Base year | 2024 |
| Historic period | 2019-2023 |
| Forecast period | 2025-2029 |
| Growth momentum & CAGR | Accelerate at a CAGR of 37.5% |
| Market growth 2025-2029 | USD 42523.2 million |
| Market structure | Fragmented |
| YoY growth 2024-2025(%) | 30.7% |
| Key countries | US, Canada, Mexico, China, Japan, India, Australia, South Korea, Indonesia, Germany, UK, France, The Netherlands, Italy, Spain, Brazil, Argentina, Colombia, Saudi Arabia, UAE, South Africa, Israel and Turkey |
| Competitive landscape | Leading Companies, Market Positioning of Companies, Competitive Strategies, and Industry Risks |
Research Analyst Overview
- The multi-sensory AI market is evolving from single-input systems to sophisticated, context-aware AI systems capable of concurrent analysis. This shift is driven by advancements in multimodal fusion algorithms and robust sensor data integration, enabling a more holistic interpretation of the physical world. Technologies such as haptic feedback systems and spatial audio processing are becoming integral to creating immersive digital experiences.
- The rise of generative AI for sensory data is accelerating model development, while breakthroughs in computer vision pipelines and natural language understanding models are refining system accuracy. A key trend is the move toward on-device AI processing, which addresses latency and data privacy concerns, a boardroom-level consideration impacting product strategy and compliance.
- Firms leveraging this approach have reported up to a 60% reduction in data transmission costs. Progress in tactile sensing technology and affective computing models is opening new application frontiers, complemented by developments in digital olfaction sensors and vocal biomarker analysis. The ecosystem is supported by cloud-based ML platforms for heavy computation and specialized neuromorphic computing hardware for efficiency.
- Ultimately, the goal is AI-powered automation through seamless real-time data synchronization and AI-driven sensor fusion, supported by the expansion of edge computing for AI and multimodal data analytics.
What are the Key Data Covered in this Multi-sensory AI Market Research and Growth Report?
-
What is the expected growth of the Multi-sensory AI Market between 2025 and 2029?
-
USD 42.52 billion, at a CAGR of 37.5%
-
-
What segmentation does the market report cover?
-
The report is segmented by Type (Vision-based AI, Audio-based AI, Tactile AI, and Olfactory and gustatory AI), Deployment (Cloud-based, On-premises, and Edge and on-device), End-user (Healthcare, Automotive, Consumer electronics, Robotics and industrial automation, and Others) and Geography (North America, APAC, Europe, South America, Middle East and Africa)
-
-
Which regions are analyzed in the report?
-
North America, APAC, Europe, South America and Middle East and Africa
-
-
What are the key growth drivers and market challenges?
-
Increasing demand for enhanced user experiences, Intricacies of data fusion and synchronization
-
-
Who are the major players in the Multi-sensory AI Market?
-
Advanced Micro Devices Inc., Amazon Web Services Inc., Apple Inc., Aryballe Technologies SAS, Baidu Inc., Databricks Inc., Google LLC, H2O.ai Inc., Huawei Technologies Co. Ltd., Intel Corp., IBM Corp., Microsoft Corp., NVIDIA Corp., OpenAI, Palantir Technologies Inc., Qualcomm Inc., Robert Bosch GmbH, SenseTime Group Inc. and Siemens AG
-
Market Research Insights
- The market's momentum is driven by the increasing integration of AI into core business functions, a trend reflected in tangible performance metrics. For example, financial institutions are leveraging AI to reduce financial crime losses by 19%, showcasing the technology's direct impact on risk management. Across industries, over half of global companies now use AI-powered analytics platforms, demonstrating widespread adoption.
- This shift toward data-driven operations creates a strong demand for intuitive human-machine interfaces and advanced autonomous systems perception. The ability of multi-sensory AI to deliver personalized customer engagement and enable real-time decision-making is a key value proposition for enterprises seeking a competitive edge in a rapidly evolving digital landscape.
We can help! Our analysts can customize this multi-sensory ai market research report to meet your requirements.
 RIA -
RIA - 
