
AI In Electronics And Sensors Market Size 2025-2029
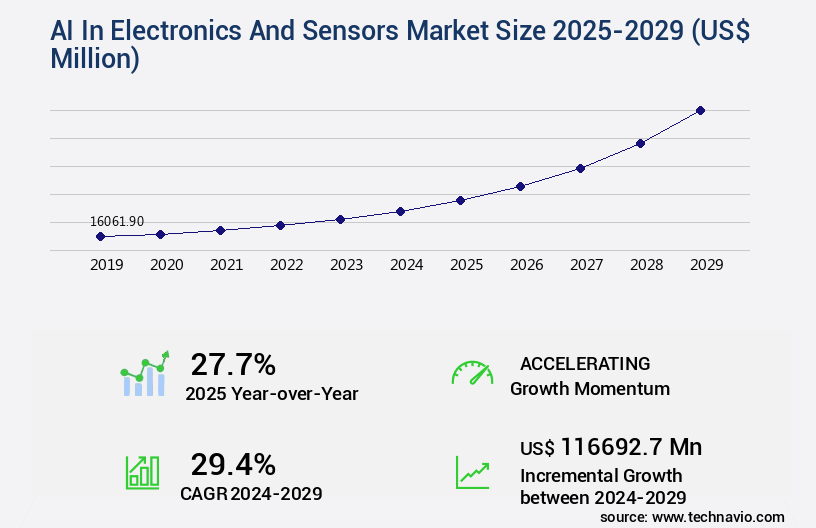
The ai in electronics and sensors market size is valued to increase by USD 116.69 billion, at a CAGR of 29.4% from 2024 to 2029. Proliferation of Internet of Things and imperative for edge computing will drive the ai in electronics and sensors market.
Major Market Trends & Insights
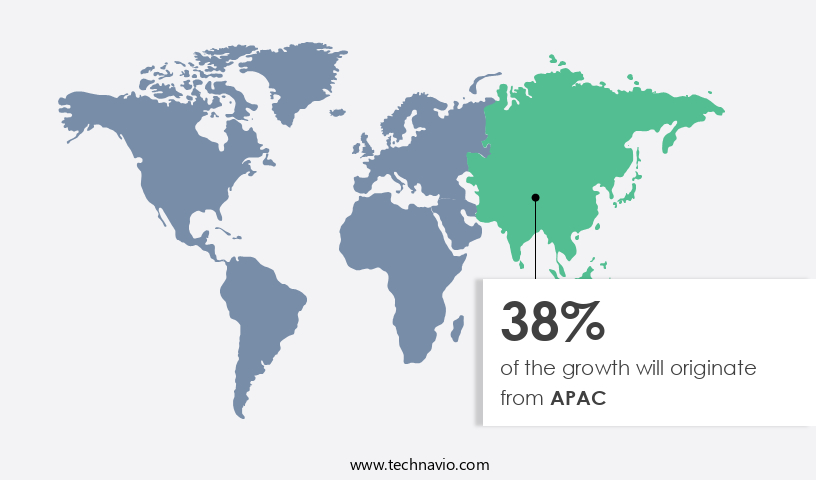
- APAC dominated the market and accounted for a 38% growth during the forecast period.
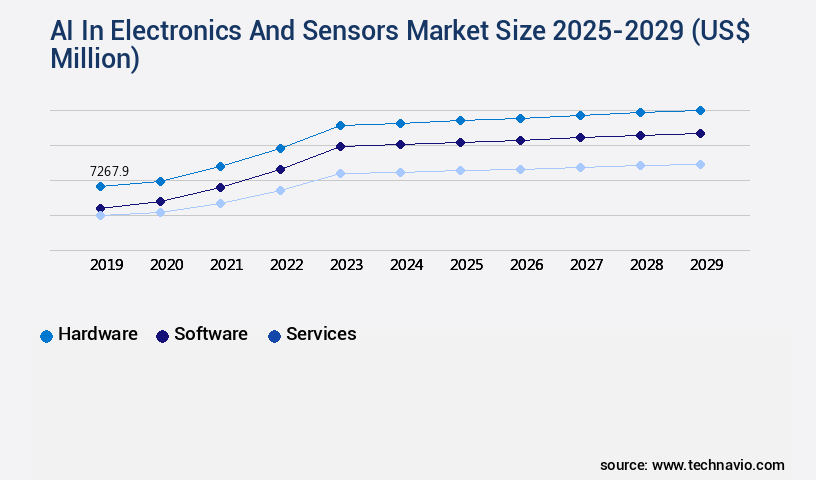
- By Component - Hardware segment was valued at USD 7.27 billion in 2023
- By Technology - Machine learning segment accounted for the largest market revenue share in 2023
Market Size & Forecast
- Market Opportunities: USD 903.34 million
- Market Future Opportunities: USD 116692.70 million
- CAGR from 2024 to 2029 : 29.4%
Market Summary
- The market is experiencing significant growth, driven by the proliferation of Internet of Things (IoT) devices and the imperative for edge computing. On-device generative AI is increasingly being adopted to process real-time data, reducing latency and increasing efficiency. However, extreme technical complexity and stringent power consumption constraints pose significant challenges. According to a recent report, The market is projected to reach USD12.6 billion by 2026, growing at a compound annual growth rate (CAGR) of 31.8% from 2021 to 2026. This growth is fueled by the increasing adoption of AI in various industries, including healthcare, automotive, and manufacturing, to enhance productivity and improve operational efficiency.
- Despite these opportunities, the market faces challenges such as data security concerns, ethical considerations, and the need for standardized frameworks and regulations. As the market continues to evolve, it is essential for businesses to stay informed of the latest trends and developments to remain competitive.
What will be the Size of the AI In Electronics And Sensors Market during the forecast period?
Get Key Insights on Market Forecast (PDF) Request Free Sample
How is the AI In Electronics And Sensors Market Segmented ?
The ai in electronics and sensors industry research report provides comprehensive data (region-wise segment analysis), with forecasts and estimates in "USD million" for the period 2025-2029, as well as historical data from 2019-2023 for the following segments.
- Component
- Hardware
- Software
- Services
- Technology
- Machine learning
- Computer vision
- Edge AI and embedded AI
- Natural language processing
- Others
- End-user
- Consumer electronics
- Automotive
- Industrial and manufacturing
- Healthcare
- Others
- Geography
- North America
- US
- Canada
- Europe
- France
- Germany
- UK
- APAC
- Australia
- China
- India
- Japan
- South Korea
- Rest of World (ROW)
- North America
By Component Insights
The hardware segment is estimated to witness significant growth during the forecast period.
The market is witnessing a continuous evolution, with a significant focus on embedded systems design and process automation systems. This shift is driven by the need for real-time thermal management solutions and advanced sensor calibration methods. Anomaly detection systems, powered by natural language processing and signal processing techniques, are increasingly being integrated to enhance functional safety standards. Computer vision applications, big data management, and system integration testing are also key areas of investment. Power management strategies, sensor network topologies, and data encryption methods are essential components of this market, ensuring cybersecurity protocols and IoT device integration.
Hardware acceleration techniques, such as AI-powered diagnostics and neural network architectures, are revolutionizing electronic circuit design and microcontroller programming. Data visualization dashboards, deep learning models, and human-machine interfaces enable predictive maintenance models and real-time analytics. With the rise of cloud computing services and edge computing platforms, the market is witnessing a surge in demand for specialized processors, including GPUs, NPUs, and ASICs. This shift towards heterogeneous computing architectures is expected to account for over 40% of the total market growth by 2025.
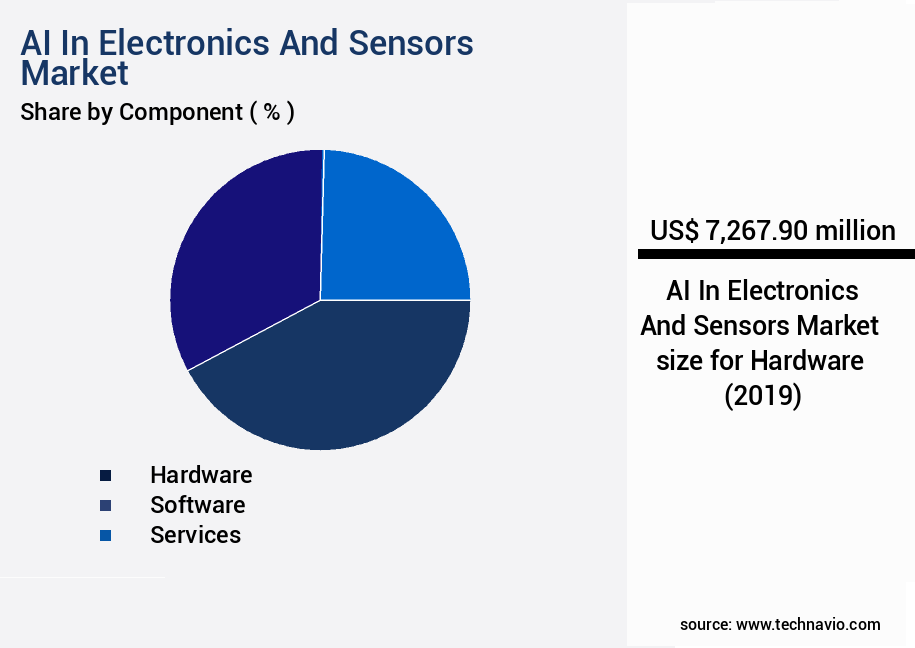
The Hardware segment was valued at USD 7.27 billion in 2019 and showed a gradual increase during the forecast period.
Regional Analysis
APAC is estimated to contribute 38% to the growth of the global market during the forecast period.Technavio's analysts have elaborately explained the regional trends and drivers that shape the market during the forecast period.
See How AI In Electronics And Sensors Market Demand is Rising in APAC Request Free Sample
The global market for AI in electronics and sensors is witnessing significant evolution, with North America leading the charge. This region's dominance is underpinned by a robust ecosystem that fosters foundational research, venture capital investment, semiconductor design, and software development. The United States, specifically, is home to the headquarters of major fabless semiconductor companies like NVIDIA, Qualcomm, AMD, and Intel. These industry pioneers are responsible for the development of specialized processors, such as GPUs, NPUs, and AI accelerators, which power intelligent devices worldwide. Their technological innovations drive advancements in processing power, energy efficiency, and architectural design, enabling the execution of intricate AI workloads at the edge.
Market Dynamics
Our researchers analyzed the data with 2024 as the base year, along with the key drivers, trends, and challenges. A holistic analysis of drivers will help companies refine their marketing strategies to gain a competitive advantage.
The market is experiencing significant growth due to the increasing demand for advanced signal processing, machine learning, and real-time data analytics in various industries. Electronic sensor noise filtering techniques are crucial in enhancing the accuracy of data collected from sensors. Implementing AI in embedded systems is becoming a trend to improve the performance of advanced signal processing for sensors. Machine learning for predictive maintenance is another key application, enabling early detection and prevention of equipment failures. Real-time data analytics using edge computing is essential for AI-driven fault diagnosis in electronics. Sensor data fusion for improved accuracy is also gaining popularity, allowing for more precise measurements and better decision-making. Designing low-power AI-enabled sensors is a significant challenge, but it is necessary to ensure efficient power consumption in AI systems. Secure data transmission in sensor networks is a critical concern, with AI-powered anomaly detection in sensor data being an effective solution. Computer vision applications in industrial automation are driving the adoption of AI in electronics and sensors. Developing robust AI models for electronics is a complex process that requires advanced machine learning algorithms and efficient algorithm implementation. Improving sensor accuracy through calibration is essential for reliable data collection. High-performance computing for AI applications is necessary to handle large amounts of sensor data, while data mining techniques provide valuable insights for optimization and improvement. In conclusion, the market offers numerous opportunities for innovation and growth. From noise filtering and predictive maintenance to computer vision and anomaly detection, AI is transforming the way we collect, process, and analyze sensor data. Efficient algorithm implementation and power optimization are crucial considerations for designing and deploying AI models on embedded platforms. The future of this market lies in continued advancements in AI, machine learning, and sensor technology.
What are the key market drivers leading to the rise in the adoption of AI In Electronics And Sensors Industry?
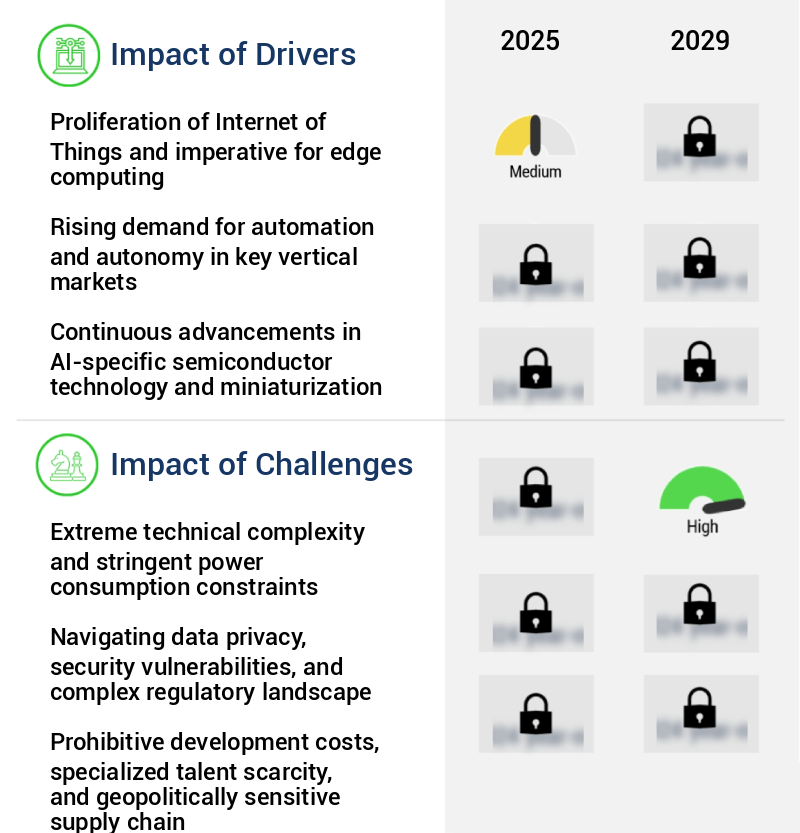
- The increasing prevalence of the Internet of Things (IoT) and the resulting necessity for edge computing are primary market drivers.
- The market is experiencing significant growth due to the burgeoning Internet of Things (IoT) and the resulting transition to edge computing architectures. With the increasing prevalence of connected devices in consumer, commercial, and industrial sectors, the generation of vast amounts of data has become ubiquitous. Transmitting this data deluge to centralized cloud servers for processing presents numerous challenges, including latency, bandwidth limitations, data privacy concerns, and operational costs. Edge computing mitigates these issues by integrating AI processing capabilities directly into endpoint devices, allowing for local data processing. This paradigm shift necessitates the integration of power-efficient AI accelerators and intelligent sensors capable of performing complex inference tasks locally.
What are the market trends shaping the AI In Electronics And Sensors Industry?
- The emergence of on-device generative AI represents a significant market trend in the technology industry. On-device generative AI is becoming increasingly prevalent.
- The market is undergoing a transformative shift, with generative AI capabilities moving from the cloud to edge devices. This trend is driven by the need for real-time performance, data privacy, and functionality in environments with limited connectivity. Semiconductor manufacturers are responding by engineering system-on-chips with more powerful and efficient Neural Processing Units and advanced memory architectures. Simultaneously, software innovations such as model quantization, pruning, and knowledge distillation enable the compression of massive generative models for portable devices. This paradigm shift is significant, as the global AI in Edge Computing market is projected to reach USD61.2 billion by 2026, growing at a compound annual growth rate of 47.3% from 2021.
- The automotive sector, in particular, is expected to dominate the market due to the increasing adoption of advanced driver-assistance systems (ADAS) and autonomous vehicles. Another sector experiencing growth is healthcare, with the use of edge AI in medical devices and telehealth services.
What challenges does the AI In Electronics And Sensors Industry face during its growth?
- The extreme technical complexity and stringent power consumption constraints pose a significant challenge to the growth of the industry, requiring innovative solutions to balance advanced functionality with energy efficiency.
- The market is characterized by its intricate nature, driven by the challenge of implementing advanced AI models on resource-constrained edge devices. This dilemma arises from the increasing computational requirements of contemporary neural networks versus the power, thermal, and size constraints of embedded systems. Executing AI workloads, especially real-time inference, is an energy-consuming process. In devices such as wearables, smartphones, and remote IoT sensors, excessive power usage significantly reduces battery life and negatively impacts user experience.
- To address this issue, developers must adopt a comprehensive engineering strategy that combines hardware-software co-design. Techniques like model quantization, which decreases the accuracy of numerical computations, and pruning, which eliminates redundant neural network connections, are essential for efficient AI deployment.
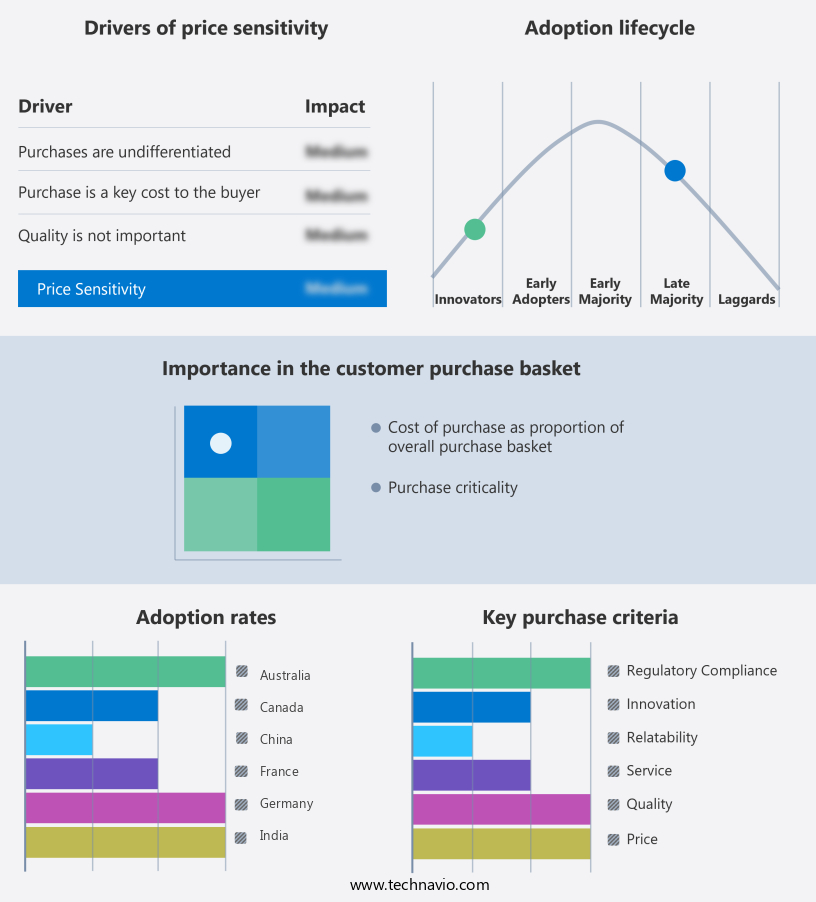
Exclusive Technavio Analysis on Customer Landscape
The ai in electronics and sensors market forecasting report includes the adoption lifecycle of the market, covering from the innovator's stage to the laggard's stage. It focuses on adoption rates in different regions based on penetration. Furthermore, the ai in electronics and sensors market report also includes key purchase criteria and drivers of price sensitivity to help companies evaluate and develop their market growth analysis strategies.
Customer Landscape of AI In Electronics And Sensors Industry
Competitive Landscape
Companies are implementing various strategies, such as strategic alliances, ai in electronics and sensors market forecast, partnerships, mergers and acquisitions, geographical expansion, and product/service launches, to enhance their presence in the industry.
Advanced Micro Devices Inc. - This company specializes in artificial intelligence technology for electronics and sensors, including Versal AI Edge SoCs and Embedded+ architecture. These innovations facilitate real-time sensor fusion and AI inferencing, enhancing the capabilities of various industries.
The industry research and growth report includes detailed analyses of the competitive landscape of the market and information about key companies, including:
- Advanced Micro Devices Inc.
- Baidu Apollo Network Beijing Limited
- Bosch Sensortec GmbH
- Infineon Technologies AG
- Intel Corp.
- Keyence Corp.
- MediaTek Inc.
- NVIDIA Corp.
- NXP Semiconductors NV
- Panasonic Holdings Corp.
- Qualcomm Inc.
- Samsung Electronics Co. Ltd.
- Sensata Technologies Inc.
- Siemens AG
- Sony Semiconductor Solutions Corporation
- STMicroelectronics NV
- Taiwan Semiconductor Manufacturing Co. Ltd.
- TE Connectivity Ltd.
- Texas Instruments Inc.
Qualitative and quantitative analysis of companies has been conducted to help clients understand the wider business environment as well as the strengths and weaknesses of key industry players. Data is qualitatively analyzed to categorize companies as pure play, category-focused, industry-focused, and diversified; it is quantitatively analyzed to categorize companies as dominant, leading, strong, tentative, and weak.
Recent Development and News in AI In Electronics And Sensors Market
- In January 2024, Intel Corporation announced the launch of its new Neural Processing Unit (NPU) for edge devices, the Intel Neural Compute Stick 2. This NPU is designed to accelerate artificial intelligence (AI) workloads in electronics and sensors, enabling real-time object detection and classification (Intel press release).
- In March 2024, IBM and Infineon Technologies AG announced a strategic collaboration to develop AI-powered sensor systems for industrial applications. The partnership aims to integrate IBM's AI and IoT technologies with Infineon's sensor solutions, enhancing predictive maintenance and quality control (IBM press release).
- In May 2024, Tesla, Inc. Raised USD2 billion in a convertible bond sale to fund its expansion in AI and autonomous driving technologies. The funds will be used for research and development, as well as the production of electric vehicles equipped with advanced AI sensors (Tesla SEC filing).
- In April 2025, STMicroelectronics and Google Cloud signed a multi-year agreement to collaborate on AI-at-the-edge solutions for IoT applications. The partnership will integrate Google's AI and machine learning technologies with STMicroelectronics' microcontrollers and sensors, enabling advanced analytics and predictive maintenance (STMicroelectronics press release).
Dive into Technavio's robust research methodology, blending expert interviews, extensive data synthesis, and validated models for unparalleled AI In Electronics And Sensors Market insights. See full methodology.
|
Market Scope |
|
|
Report Coverage |
Details |
|
Page number |
248 |
|
Base year |
2024 |
|
Historic period |
2019-2023 |
|
Forecast period |
2025-2029 |
|
Growth momentum & CAGR |
Accelerate at a CAGR of 29.4% |
|
Market growth 2025-2029 |
USD 116692.7 million |
|
Market structure |
Fragmented |
|
YoY growth 2024-2025(%) |
27.7 |
|
Key countries |
US, China, India, Japan, Germany, Canada, UK, South Korea, Australia, and France |
|
Competitive landscape |
Leading Companies, Market Positioning of Companies, Competitive Strategies, and Industry Risks |
Research Analyst Overview
- The electronics and sensors market continues to evolve, driven by advancements in embedded systems design and process automation. Thermal management solutions and sensor calibration methods are increasingly important as these technologies become more integrated into various sectors. Anomaly detection systems, fueled by natural language processing and signal processing techniques, are revolutionizing industries by enabling real-time identification of unusual patterns. Functional safety standards and computer vision applications are becoming more intertwined, leading to increased demand for big data management and system integration testing. Power management strategies and sensor network topologies are essential for optimizing performance and reducing energy consumption.
- Data encryption methods and AI-powered diagnostics are crucial for securing sensitive information and maintaining system reliability. Neural network architectures and cloud computing services are transforming edge computing platforms, enabling faster and more efficient data processing. Electronic circuit design and cybersecurity protocols are essential for ensuring the security and functionality of these advanced systems. IoT device integration, hardware acceleration techniques, and data visualization dashboards are becoming increasingly important for optimizing operations and enhancing user experiences. Predictive maintenance models and real-time analytics are revolutionizing industries by enabling proactive problem-solving and improving overall efficiency. Machine learning algorithms and software defined radios are enabling more advanced wireless communication protocols, while deep learning models and human-machine interfaces are enhancing user experiences and automating complex tasks.
- For instance, in the manufacturing sector, an AI-powered predictive maintenance model has led to a 30% reduction in downtime and a 20% increase in productivity. According to industry reports, the electronics and sensors market is expected to grow by over 15% annually in the coming years, driven by these continuous advancements and evolving patterns.
What are the Key Data Covered in this AI In Electronics And Sensors Market Research and Growth Report?
-
What is the expected growth of the AI In Electronics And Sensors Market between 2025 and 2029?
-
USD 116.69 billion, at a CAGR of 29.4%
-
-
What segmentation does the market report cover?
-
The report is segmented by Component (Hardware, Software, and Services), Technology (Machine learning, Computer vision, Edge AI and embedded AI, Natural language processing, and Others), End-user (Consumer electronics, Automotive, Industrial and manufacturing, Healthcare, and Others), and Geography (North America, APAC, Europe, Middle East and Africa, and South America)
-
-
Which regions are analyzed in the report?
-
North America, APAC, Europe, Middle East and Africa, and South America
-
-
What are the key growth drivers and market challenges?
-
Proliferation of Internet of Things and imperative for edge computing, Extreme technical complexity and stringent power consumption constraints
-
-
Who are the major players in the AI In Electronics And Sensors Market?
-
Advanced Micro Devices Inc., Baidu Apollo Network Beijing Limited, Bosch Sensortec GmbH, Infineon Technologies AG, Intel Corp., Keyence Corp., MediaTek Inc., NVIDIA Corp., NXP Semiconductors NV, Panasonic Holdings Corp., Qualcomm Inc., Samsung Electronics Co. Ltd., Sensata Technologies Inc., Siemens AG, Sony Semiconductor Solutions Corporation, STMicroelectronics NV, Taiwan Semiconductor Manufacturing Co. Ltd., TE Connectivity Ltd., and Texas Instruments Inc.
-
Market Research Insights
- The market for AI in electronics and sensors is a continually advancing field, with innovations in object detection techniques and real-time operating systems driving progress. AI model training and algorithm performance evaluation are critical components of this market, enabling high-frequency electronics to operate more efficiently. For instance, the implementation of AI in speech recognition systems has led to a significant reduction in error rates, improving user experience.
- According to industry reports, the market for AI in electronics and sensors is expected to grow by over 20% annually in the coming years. Additionally, energy harvesting methods and low-power electronics are gaining traction as key trends, with the potential to significantly reduce power consumption and extend system lifecycle management.
We can help! Our analysts can customize this ai in electronics and sensors market research report to meet your requirements.
 RIA -
RIA - 
