Multiple Myeloma Drugs Market Analysis North America, Europe, Asia, Rest of World (ROW) - US, Germany, China, Canada, UK - Size and Forecast 2024-2028

Multiple Myeloma Drugs Market Analysis North America, Europe, Asia, Rest of World (ROW) - US, Germany, China, Canada, UK - Size and Forecast 2024-2028

Published: Jul 2024 179 Pages SKU: IRTNTR74700

Market Overview at a Glance

$7.94 B
Market Opportunity
6.78%
CAGR
6.23
YoY growth 2023-2024(%)

Multiple Myeloma Drugs Market Size 2024-2028

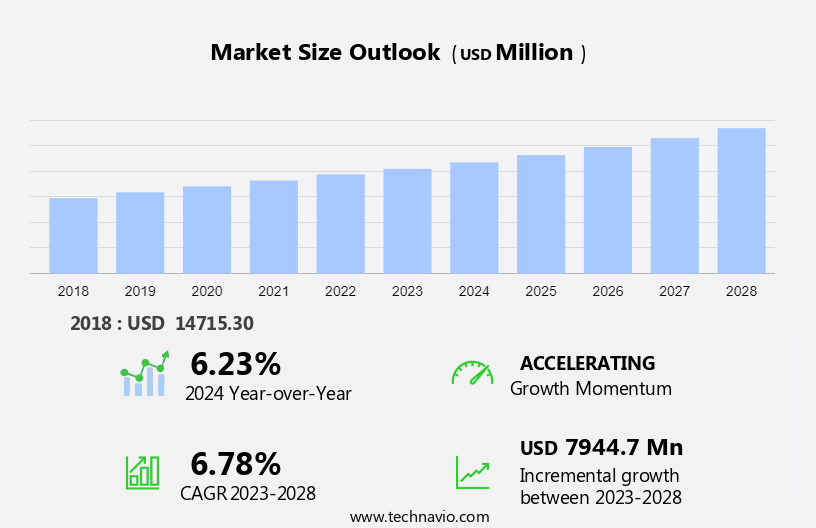
The multiple myeloma drugs market size is forecast to increase by USD 7.94 billion at a CAGR of 6.78% between 2023 and 2028.

  • The market is experiencing significant growth, driven primarily by the increasing incidence of this cancer type worldwide. Multiple myeloma is a malignant plasma cells disorder, and its prevalence is projected to rise due to an aging population and improved diagnostic methods. A key trend In the market is the emergence of nanomedicine platforms, which offer enhanced drug delivery and targeted therapy, thereby improving treatment efficacy and reducing side effects. Another trend is the growing popularity of complementary and alternative medicines, including herbal remedies and dietary supplements, as adjunct therapies for multiple myeloma. However, challenges such as high treatment costs and the limited availability of effective therapies for relapsed or refractory multiple myeloma persist. The market is segmented into immunomodulators, proteasome inhibitors, alkylating agents, and the emerging segment of XPO1 inhibitors. Companies seeking to capitalize on market opportunities and navigate challenges effectively must focus on developing innovative therapies, optimizing drug delivery systems, and exploring partnerships and collaborations to expand their product portfolios. By staying abreast of these market dynamics, stakeholders can make informed strategic decisions and operational plans.

What will be the Size of the Multiple Myeloma Drugs Market during the forecast period?

Multiple Myeloma Drugs Market Size

 Request Free Sample

  • The market encompasses a range of therapeutics designed to address this complex and often challenging blood cancer. Key drivers of market growth include the increasing number of plasma cell-related diagnoses, particularly those involving paraproteins and associated complications such as anemia, infections, and bone marrow damage. Treatment options for multiple myeloma include various modalities, including stem cell transplantation, radiation therapy, chemotherapy, targeted therapy, and biological drugs. Notable classes of multiple myeloma therapeutics include imids (lenalidomide, pomalidomide), Car-T cells, and bispecific antibodies.
  • Additionally, Car-T cells are a type of immunotherapy that uses genetically modified T cells to target and destroy cancer cells. The market is characterized by a pipeline of innovative oncology therapeutics, with numerous clinical trials yielding positive clinical data for new treatments. The market's size and direction reflect the ongoing efforts to improve patient outcomes and address the unmet needs of multiple myeloma patients. Multiple myeloma therapeutics continue to evolve, with a focus on developing more effective, targeted, and patient-friendly treatment options.

How is this Multiple Myeloma Drugs Industry segmented?

The industry research report provides comprehensive data (region-wise segment analysis), with forecasts and estimates in "USD million" for the period 2024-2028, as well as historical data from 2018-2022 for the following segments.
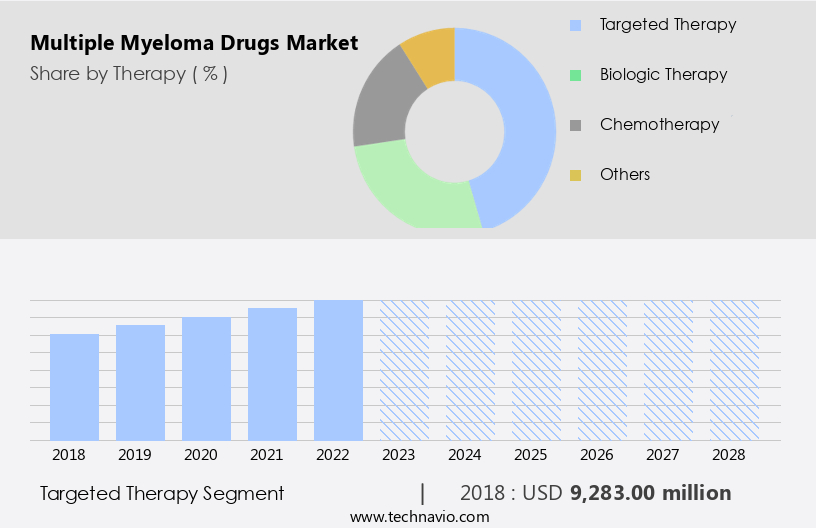
  • Therapy
    • Targeted therapy
    • Biologic therapy
    • Chemotherapy
    • Others
  • Distribution Channel
    • Hospital pharmacy
    • Retail pharmacy
    • E-pharmacy
  • Geography
    • North America
      • US
      • Canada
    • Europe
      • Germany
      • UK
    • Asia
    • Rest of World (ROW)

By Therapy Insights

The targeted therapy segment is estimated to witness significant growth during the forecast period.

Multiple myeloma, a type of blood cancer, affects the production of abnormal plasma cells In the bone marrow, leading to the accumulation of paraproteins and organ dysfunction. Anemia and infections are common complications in active multiple myeloma, while smoldering myeloma is a precursor disorder. Treatment options include chemotherapy, targeted therapy, stem cell transplantation, radiation therapy, and immunotherapy. Proteasome inhibitors, such as VELCADE (bortezomib), and histone deacetylase inhibitors, like FARYDAK (panobinostat), are targeted therapies used in multiple myeloma treatment. VELCADE blocks the action of a substance in myeloma cells that disrupts proteins, helping to kill the cells.

It was initially approved for multiple myeloma treatment following chemotherapy and later for the initial phase in 2008. However, sales have declined due to patent expiry, with an annual sales decrease of approximately 6% in 2021. Immunotherapy, including monoclonal antibodies like Sarclisa (isatuximab-irfc), immunomodulators, and protease inhibitors, is another treatment paradigm. Newer therapies, such as XPO1 inhibitors (Selinexor), CAR-T cell therapies, and bispecific antibodies, are under clinical trials. The healthcare community continues to explore treatment landscapes and paradigms to improve patient prognosis. Multiple myeloma therapeutics are available in hospitals, clinics, and through hospital pharmacies and online pharmacies. Key medications include proteasome inhibitors, immunomodulating agents, histone deacetylase inhibitors, monoclonal antibodies, corticosteroids, and nuclear export inhibitors. Treatment plans depend on the diagnosis, bone pain, hypercalcemia, and treatment failure, among other factors. Treatment resistance and multidrug resistance are ongoing challenges.

Multiple Myeloma Drugs Market Size

Get a glance at the market report of share of various segments Request Free Sample

The targeted therapy segment was valued at USD 9.28 billion in 2018 and showed a gradual increase during the forecast period.

Regional Analysis

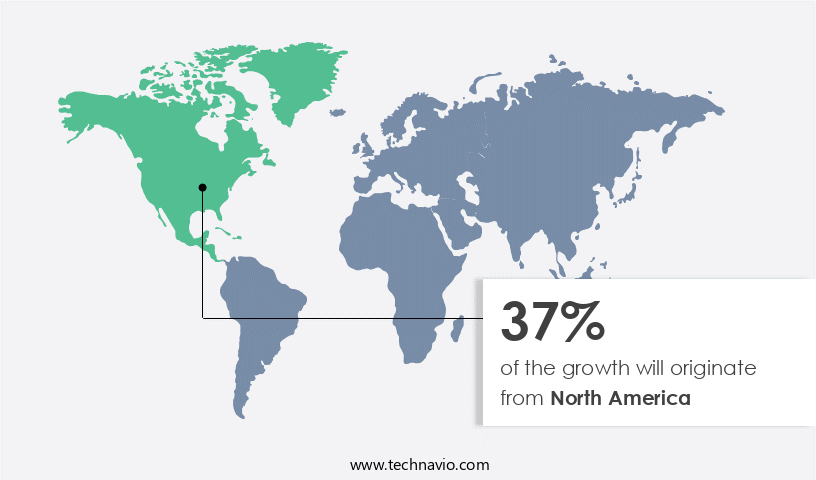
North America is estimated to contribute 37% to the growth of the global market during the forecast period. Technavio's analysts have elaborately explained the regional trends and drivers that shape the market during the forecast period.

Multiple Myeloma Drugs Market Share by Geography

For more insights on the market size of various regions, Request Free Sample

Multiple myeloma, a type of blood cancer, affects the production of healthy plasma cells In the bone marrow, leading to the accumulation of abnormal proteins called M-proteins or paraproteins. This disorder can result in anemia, infections, bone marrow suppression, and organ dysfunction. Multiple myeloma therapeutics include protease inhibitors, monoclonal antibodies, immunomodulators, alkylating agents, histone deacetylase inhibitors, corticosteroids, and nuclear export inhibitors. Key drugs include Sarclisa (isatuximab-irfc), a CD38 monoclonal antibody, and Triumvira Immunologics' medications, which employ immunotherapy. In the US, North America is a significant market, driven by the presence of approved treatments and the patent expiry of blockbuster drugs like VELCADE.

Five companies are developing generic versions of VELCADE, with Fresenius and Allergans generic already registered for multiple myeloma treatment. Other treatments include targeted therapies like XPO1 inhibitors (Selinexor) and CAR-T cell therapies (Zevorcabtagene autoleucel, Venetoclax, Janssen). The treatment landscape is evolving, with clinical trials underway for new drugs like Mezigdomide, Iberdomide, Elranatamab, Talquetamab, Linvoseltamab, and TEVARLIS (teclistamab). Multiple myeloma patients may experience treatment failure, multidrug resistance, and bone pain, necessitating a personalized treatment plan. Hospitals and clinics are the primary distribution channels for these drugs, with hospital pharmacies and online pharmacies also playing a role. The multiple myeloma therapeutics market is expected to grow due to the increasing number of diagnoses and the need for effective treatments, improving prognosis for patients.

Market Dynamics

Our researchers analyzed the data with 2023 as the base year, along with the key drivers, trends, and challenges. A holistic analysis of drivers will help companies refine their marketing strategies to gain a competitive advantage.

What are the key market drivers leading to the rise In the adoption of Multiple Myeloma Drugs Industry?

  • Growing incidence of multiple myeloma is the key driver of the market. The market is driven by the rising incidence of multiple myeloma, which is the most common type of myeloma, affecting over 90% of patients with the condition. Multiple myeloma is a significant target indication for market participants due to the vast potential for growth. Although recent advancements in multiple myeloma treatment, such as the approval of three proteasome inhibitors, have occurred, the market has experienced a rise in new myeloma cases.
  • The increasing incidence rate of this indication can be attributed to the growing risk factors, including age, obesity, and plasma cell disorders like monoclonal gammopathy of undetermined significance and solitary plasmacytoma.

What are the market trends shaping the Multiple Myeloma Drugs Industry?

  • The emergence of nanomedicine platform is the upcoming market trend. The market is experiencing significant advancements, particularly In the field of nanomedicine. This emerging technology is poised to make a positive impact on the industry, as lipid-based nanoparticles and polymer-based approaches for drug delivery gain traction. Current technologies require a large number of cells to detect tumors, but nanotechnology could drastically reduce this requirement, enabling earlier diagnosis or treatment. Nanocarriers enable drugs to be delivered specifically to cancer cells by manipulating cellular events at the nanometer scale.
  • Moreover, nanoparticles offer advantages such as improved bioavailability, intestinal absorption, in vivo stability, solubility, sustained and targeted delivery, and enhanced therapeutic effectiveness of various anticancer agents. Overall, nanotechnology is revolutionizing the market by addressing the limitations of existing technologies and offering more effective treatment options.

What challenges does the Multiple Myeloma Drugs Industry face during its growth?

  • Growing popularity of complementary and alternative medicines is a key challenge affecting the industry growth. The market is experiencing significant shifts due to the increasing preference for Complementary and Alternative Medicine (CAM) therapies. With the side effects of conventional drugs being a concern for many patients, the demand for CAM solutions is on the rise. These therapies encompass mind and body medicines, biology-based practices, energy work, and whole medical systems. Examples include meditation, biofeedback, yoga, massage, ayurvedic medicine, and naturopathic medicine.
  • The high cost of multiple myeloma therapeutics is another driving factor fueling the demand for CAM therapies. Healthcare organizations are responding to this trend by conducting research to validate the efficacy of these therapies in treating the condition. This growing interest in CAM therapies may influence market dynamics during the forecast period.

Exclusive Customer Landscape

The market forecasting report includes the adoption lifecycle of the market, covering from the innovator's stage to the laggard's stage. It focuses on adoption rates in different regions based on penetration. Furthermore, the market report also includes key purchase criteria and drivers of price sensitivity to help companies evaluate and develop their market growth analysis strategies.
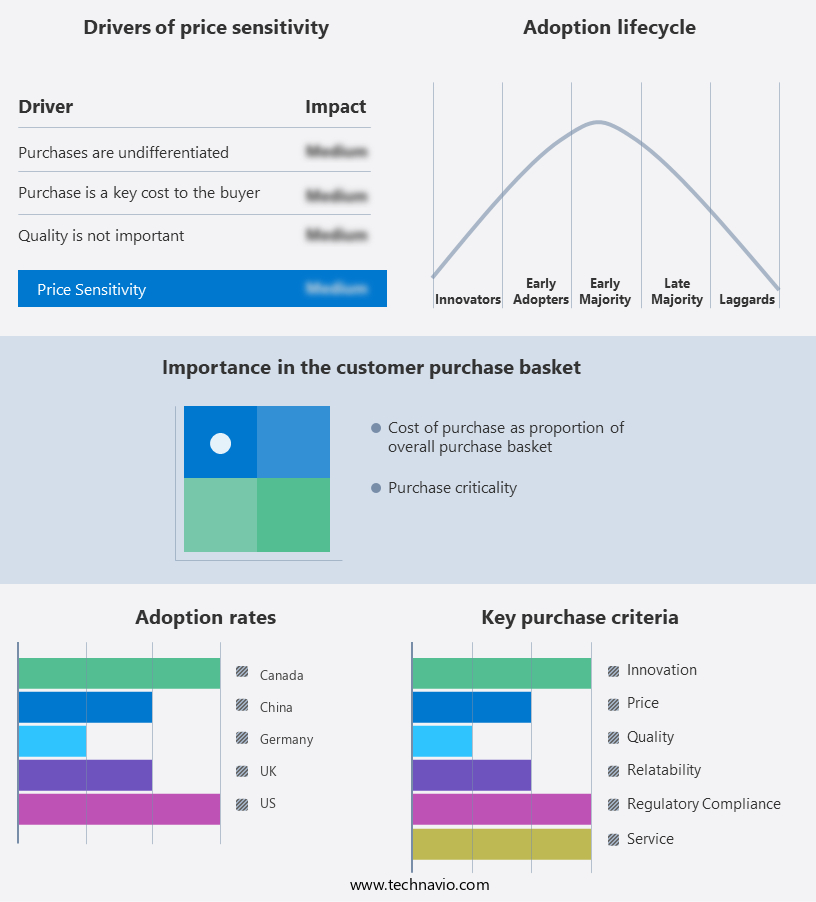
Multiple Myeloma Drugs Market Share by Geography

 Customer Landscape

Key Companies & Market Insights

Companies are implementing various strategies, such as strategic alliances, market forecast, partnerships, mergers and acquisitions, geographical expansion, and product/service launches, to enhance their presence In the industry.

The industry research and growth report includes detailed analyses of the competitive landscape of the market and information about key companies, including:

  • Abbott Laboratories
  • AbbVie Inc.
  • Amgen Inc.
  • AstraZeneca Plc
  • Bristol Myers Squibb Co.
  • Cipla Inc.
  • Daiichi Sankyo Co. Ltd.
  • Eli Lilly and Co.
  • F. Hoffmann La Roche Ltd.
  • Fresenius SE and Co. KGaA
  • GlaxoSmithKline Plc
  • Johnson and Johnson Services Inc.
  • Merck and Co. Inc.
  • Novartis AG
  • Pfizer Inc.
  • PharmaMar SA
  • Sanofi SA
  • Takeda Pharmaceutical Co. Ltd.
  • Teva Pharmaceutical Industries Ltd.

Qualitative and quantitative analysis of companies has been conducted to help clients understand the wider business environment as well as the strengths and weaknesses of key industry players. Data is qualitatively analyzed to categorize companies as pure play, category-focused, industry-focused, and diversified; it is quantitatively analyzed to categorize companies as dominant, leading, strong, tentative, and weak.

Research Analyst Overview

Multiple myeloma is a type of hematological malignancy characterized by the uncontrolled proliferation of monoclonal plasma cells In the bone marrow. These abnormal plasma cells produce excessive amounts of abnormal proteins, known as paraproteins, which can lead to various complications such as anemia, infections, and bone lesions. The disorder can manifest as smoldering multiple myeloma, which is a pre-symptomatic stage, or active multiple myeloma, which is the symptomatic stage. The treatment landscape is continually evolving, with various therapeutic options available. These include traditional modalities such as chemotherapy, radiation therapy, and stem cell transplantation, as well as novel therapies like immunotherapy and targeted therapy.

Immunotherapy, which includes monoclonal antibodies and immunomodulators, has emerged as a promising approach in the treatment. Monoclonal antibodies, which are proteins that target specific antigens, can be used to eliminate cancer cells or modulate the immune response. Proteasome inhibitors, which prevent the degradation of tumor suppressor proteins, are another class of drugs used in multiple myeloma treatment. Immunomodulators, on the other hand, work by modulating the immune system to enhance its ability to fight cancer cells. These drugs have been shown to improve overall survival and quality of life in patients. Targeted therapies, such as CD38 antibodies and BCMA-targeted therapies, are also being explored in the treatment.

CD38 is a transmembrane glycoprotein expressed on the surface of multiple myeloma cells, making it an attractive target for therapy. BCMA, or B-cell maturation antigen, is a protein found on the surface of malignant plasma cells, making it an ideal target for CAR-T (chimeric antigen receptor T-cell) therapies. The use of CAR-T therapies, which involve genetically modifying a patient's T-cells to recognize and attack cancer cells, has shown promising results in the treatment. These therapies have been shown to induce deep and durable responses in some patients. Despite the availability of various treatment options, it remains a complex and challenging disease to manage.

Organ dysfunction, treatment failure, and multidrug resistance are common challenges in the treatment. Additionally, the diagnosis and treatment require a multidisciplinary approach, involving hospitals, clinics, and various healthcare professionals. The use of biological drugs, such as Sarclisa (isatuximab-irfc), in the treatment has also gained significant attention. These drugs work by modulating the immune system to enhance its ability to fight cancer cells. Positive clinical data from ongoing clinical trials suggest that these drugs may offer significant benefits to the patients. In summary, the market is characterized by a diverse range of treatment options, including traditional modalities and novel therapies. The healthcare community continues to explore new treatment paradigms to improve the prognosis for patients. The use of immunotherapy, targeted therapy, and CAR-T therapies is expected to play a significant role in the future of the treatment.

Market Scope

Report Coverage

Details

Page number

179

Base year

2023

Historic period

2018-2022

Forecast period

2024-2028

Growth momentum & CAGR

Accelerate at a CAGR of 6.78%

Market growth 2024-2028

USD 7.94 billion

Market structure

Fragmented

YoY growth 2023-2024(%)

6.23

Key countries

US, Germany, China, Canada, UK,

Competitive landscape

Leading Companies, Market Positioning of Companies, Competitive Strategies, and Industry Risks

Request Free Sample

What are the Key Data Covered in this Market Research and Growth Report?

  • CAGR of the industry during the forecast period
  • Detailed information on factors that will drive the growth and forecasting between 2024 and 2028
  • Precise estimation of the size of the market and its contribution of the industry in focus to the parent market
  • Accurate predictions about upcoming growth and trends and changes in consumer behaviour
  • Growth of the market across North America, Europe, Asia, Rest of World (ROW),
  • Thorough analysis of the market's competitive landscape and detailed information about companies
  • Comprehensive analysis of factors that will challenge the market growth of industry companies

We can help! Our analysts can customize this market research report to meet your requirements.

Get in touch

1 Executive Summary

  • 1.1 Market overview
    • Executive Summary - Chart on Market Overview
    • Executive Summary - Data Table on Market Overview
    • Executive Summary - Chart on Global Market Characteristics
    • Executive Summary - Chart on Market by Geography
    • Executive Summary - Chart on Market Segmentation by Therapy
    • Executive Summary - Chart on Market Segmentation by Distribution Channel
    • Executive Summary - Chart on Incremental Growth
    • Executive Summary - Data Table on Incremental Growth
    • Executive Summary - Chart on Company Market Positioning

2 Market Landscape

  • 2.1 Market ecosystem
    • Parent Market
    • Data Table on - Parent Market
  • 2.2 Market characteristics
    • Market characteristics analysis
  • 2.3 Value chain analysis
    • Value Chain Analysis

3 Market Sizing

  • 3.1 Market definition
    • Offerings of companies included in the market definition
  • 3.2 Market segment analysis
    • Market segments
  • 3.3 Market size 2023
    • 3.4 Market outlook: Forecast for 2023-2028
      • Chart on Global - Market size and forecast 2023-2028 ($ million)
      • Data Table on Global - Market size and forecast 2023-2028 ($ million)
      • Chart on Global Market: Year-over-year growth 2023-2028 (%)
      • Data Table on Global Market: Year-over-year growth 2023-2028 (%)

    4 Historic Market Size

    • 4.1 Global Multiple Myeloma Drugs Market 2018 - 2022
      • Historic Market Size - Data Table on Global Multiple Myeloma Drugs Market 2018 - 2022 ($ million)
    • 4.2 Therapy segment analysis 2018 - 2022
      • Historic Market Size - Therapy Segment 2018 - 2022 ($ million)
    • 4.3 Distribution Channel segment analysis 2018 - 2022
      • Historic Market Size - Distribution Channel Segment 2018 - 2022 ($ million)
    • 4.4 Geography segment analysis 2018 - 2022
      • Historic Market Size - Geography Segment 2018 - 2022 ($ million)
    • 4.5 Country segment analysis 2018 - 2022
      • Historic Market Size - Country Segment 2018 - 2022 ($ million)

    5 Five Forces Analysis

    • 5.1 Five forces summary
      • Five forces analysis - Comparison between 2023 and 2028
    • 5.2 Bargaining power of buyers
      • Bargaining power of buyers - Impact of key factors 2023 and 2028
    • 5.3 Bargaining power of suppliers
      • Bargaining power of suppliers - Impact of key factors in 2023 and 2028
    • 5.4 Threat of new entrants
      • Threat of new entrants - Impact of key factors in 2023 and 2028
    • 5.5 Threat of substitutes
      • Threat of substitutes - Impact of key factors in 2023 and 2028
    • 5.6 Threat of rivalry
      • Threat of rivalry - Impact of key factors in 2023 and 2028
    • 5.7 Market condition
      • Chart on Market condition - Five forces 2023 and 2028

    6 Market Segmentation by Therapy

    • 6.1 Market segments
      • Chart on Therapy - Market share 2023-2028 (%)
      • Data Table on Therapy - Market share 2023-2028 (%)
    • 6.2 Comparison by Therapy
      • Chart on Comparison by Therapy
      • Data Table on Comparison by Therapy
    • 6.3 Targeted therapy - Market size and forecast 2023-2028
      • Chart on Targeted therapy - Market size and forecast 2023-2028 ($ million)
      • Data Table on Targeted therapy - Market size and forecast 2023-2028 ($ million)
      • Chart on Targeted therapy - Year-over-year growth 2023-2028 (%)
      • Data Table on Targeted therapy - Year-over-year growth 2023-2028 (%)
    • 6.4 Biologic therapy - Market size and forecast 2023-2028
      • Chart on Biologic therapy - Market size and forecast 2023-2028 ($ million)
      • Data Table on Biologic therapy - Market size and forecast 2023-2028 ($ million)
      • Chart on Biologic therapy - Year-over-year growth 2023-2028 (%)
      • Data Table on Biologic therapy - Year-over-year growth 2023-2028 (%)
    • 6.5 Chemotherapy - Market size and forecast 2023-2028
      • Chart on Chemotherapy - Market size and forecast 2023-2028 ($ million)
      • Data Table on Chemotherapy - Market size and forecast 2023-2028 ($ million)
      • Chart on Chemotherapy - Year-over-year growth 2023-2028 (%)
      • Data Table on Chemotherapy - Year-over-year growth 2023-2028 (%)
    • 6.6 Others - Market size and forecast 2023-2028
      • Chart on Others - Market size and forecast 2023-2028 ($ million)
      • Data Table on Others - Market size and forecast 2023-2028 ($ million)
      • Chart on Others - Year-over-year growth 2023-2028 (%)
      • Data Table on Others - Year-over-year growth 2023-2028 (%)
    • 6.7 Market opportunity by Therapy
      • Market opportunity by Therapy ($ million)
      • Data Table on Market opportunity by Therapy ($ million)

    7 Market Segmentation by Distribution Channel

    • 7.1 Market segments
      • Chart on Distribution Channel - Market share 2023-2028 (%)
      • Data Table on Distribution Channel - Market share 2023-2028 (%)
    • 7.2 Comparison by Distribution Channel
      • Chart on Comparison by Distribution Channel
      • Data Table on Comparison by Distribution Channel
    • 7.3 Hospital pharmacy - Market size and forecast 2023-2028
      • Chart on Hospital pharmacy - Market size and forecast 2023-2028 ($ million)
      • Data Table on Hospital pharmacy - Market size and forecast 2023-2028 ($ million)
      • Chart on Hospital pharmacy - Year-over-year growth 2023-2028 (%)
      • Data Table on Hospital pharmacy - Year-over-year growth 2023-2028 (%)
    • 7.4 Retail pharmacy - Market size and forecast 2023-2028
      • Chart on Retail pharmacy - Market size and forecast 2023-2028 ($ million)
      • Data Table on Retail pharmacy - Market size and forecast 2023-2028 ($ million)
      • Chart on Retail pharmacy - Year-over-year growth 2023-2028 (%)
      • Data Table on Retail pharmacy - Year-over-year growth 2023-2028 (%)
    • 7.5 E-pharmacy - Market size and forecast 2023-2028
      • Chart on E-pharmacy - Market size and forecast 2023-2028 ($ million)
      • Data Table on E-pharmacy - Market size and forecast 2023-2028 ($ million)
      • Chart on E-pharmacy - Year-over-year growth 2023-2028 (%)
      • Data Table on E-pharmacy - Year-over-year growth 2023-2028 (%)
    • 7.6 Market opportunity by Distribution Channel
      • Market opportunity by Distribution Channel ($ million)
      • Data Table on Market opportunity by Distribution Channel ($ million)

    8 Customer Landscape

    • 8.1 Customer landscape overview
      • Analysis of price sensitivity, lifecycle, customer purchase basket, adoption rates, and purchase criteria

    9 Geographic Landscape

    • 9.1 Geographic segmentation
      • Chart on Market share by geography 2023-2028 (%)
      • Data Table on Market share by geography 2023-2028 (%)
    • 9.2 Geographic comparison
      • Chart on Geographic comparison
      • Data Table on Geographic comparison
    • 9.3 North America - Market size and forecast 2023-2028
      • Chart on North America - Market size and forecast 2023-2028 ($ million)
      • Data Table on North America - Market size and forecast 2023-2028 ($ million)
      • Chart on North America - Year-over-year growth 2023-2028 (%)
      • Data Table on North America - Year-over-year growth 2023-2028 (%)
    • 9.4 Europe - Market size and forecast 2023-2028
      • Chart on Europe - Market size and forecast 2023-2028 ($ million)
      • Data Table on Europe - Market size and forecast 2023-2028 ($ million)
      • Chart on Europe - Year-over-year growth 2023-2028 (%)
      • Data Table on Europe - Year-over-year growth 2023-2028 (%)
    • 9.5 Asia - Market size and forecast 2023-2028
      • Chart on Asia - Market size and forecast 2023-2028 ($ million)
      • Data Table on Asia - Market size and forecast 2023-2028 ($ million)
      • Chart on Asia - Year-over-year growth 2023-2028 (%)
      • Data Table on Asia - Year-over-year growth 2023-2028 (%)
    • 9.6 Rest of World (ROW) - Market size and forecast 2023-2028
      • Chart on Rest of World (ROW) - Market size and forecast 2023-2028 ($ million)
      • Data Table on Rest of World (ROW) - Market size and forecast 2023-2028 ($ million)
      • Chart on Rest of World (ROW) - Year-over-year growth 2023-2028 (%)
      • Data Table on Rest of World (ROW) - Year-over-year growth 2023-2028 (%)
    • 9.7 US - Market size and forecast 2023-2028
      • Chart on US - Market size and forecast 2023-2028 ($ million)
      • Data Table on US - Market size and forecast 2023-2028 ($ million)
      • Chart on US - Year-over-year growth 2023-2028 (%)
      • Data Table on US - Year-over-year growth 2023-2028 (%)
    • 9.8 Germany - Market size and forecast 2023-2028
      • Chart on Germany - Market size and forecast 2023-2028 ($ million)
      • Data Table on Germany - Market size and forecast 2023-2028 ($ million)
      • Chart on Germany - Year-over-year growth 2023-2028 (%)
      • Data Table on Germany - Year-over-year growth 2023-2028 (%)
    • 9.9 China - Market size and forecast 2023-2028
      • Chart on China - Market size and forecast 2023-2028 ($ million)
      • Data Table on China - Market size and forecast 2023-2028 ($ million)
      • Chart on China - Year-over-year growth 2023-2028 (%)
      • Data Table on China - Year-over-year growth 2023-2028 (%)
    • 9.10 Canada - Market size and forecast 2023-2028
      • Chart on Canada - Market size and forecast 2023-2028 ($ million)
      • Data Table on Canada - Market size and forecast 2023-2028 ($ million)
      • Chart on Canada - Year-over-year growth 2023-2028 (%)
      • Data Table on Canada - Year-over-year growth 2023-2028 (%)
    • 9.11 UK - Market size and forecast 2023-2028
      • Chart on UK - Market size and forecast 2023-2028 ($ million)
      • Data Table on UK - Market size and forecast 2023-2028 ($ million)
      • Chart on UK - Year-over-year growth 2023-2028 (%)
      • Data Table on UK - Year-over-year growth 2023-2028 (%)
    • 9.12 Market opportunity by geography
      • Market opportunity by geography ($ million)
      • Data Tables on Market opportunity by geography ($ million)

    10 Drivers, Challenges, and Opportunity/Restraints

    • 10.1 Market drivers
      • 10.2 Market challenges
        • 10.3 Impact of drivers and challenges
          • Impact of drivers and challenges in 2023 and 2028
        • 10.4 Market opportunities/restraints

          11 Competitive Landscape

          • 11.1 Overview
            • 11.2 Competitive Landscape
              • Overview on criticality of inputs and factors of differentiation
            • 11.3 Landscape disruption
              • Overview on factors of disruption
            • 11.4 Industry risks
              • Impact of key risks on business

            12 Competitive Analysis

            • 12.1 Companies profiled
              • Companies covered
            • 12.2 Market positioning of companies
              • Matrix on companies position and classification
            • 12.3 Abbott Laboratories
              • Abbott Laboratories - Overview
              • Abbott Laboratories - Business segments
              • Abbott Laboratories - Key news
              • Abbott Laboratories - Key offerings
              • Abbott Laboratories - Segment focus
            • 12.4 AbbVie Inc.
              • AbbVie Inc. - Overview
              • AbbVie Inc. - Product / Service
              • AbbVie Inc. - Key news
              • AbbVie Inc. - Key offerings
            • 12.5 Amgen Inc.
              • Amgen Inc. - Overview
              • Amgen Inc. - Product / Service
              • Amgen Inc. - Key news
              • Amgen Inc. - Key offerings
            • 12.6 Bristol Myers Squibb Co.
              • Bristol Myers Squibb Co. - Overview
              • Bristol Myers Squibb Co. - Product / Service
              • Bristol Myers Squibb Co. - Key news
              • Bristol Myers Squibb Co. - Key offerings
            • 12.7 Daiichi Sankyo Co. Ltd.
              • Daiichi Sankyo Co. Ltd. - Overview
              • Daiichi Sankyo Co. Ltd. - Product / Service
              • Daiichi Sankyo Co. Ltd. - Key news
              • Daiichi Sankyo Co. Ltd. - Key offerings
            • 12.8 F. Hoffmann La Roche Ltd.
              • F. Hoffmann La Roche Ltd. - Overview
              • F. Hoffmann La Roche Ltd. - Business segments
              • F. Hoffmann La Roche Ltd. - Key news
              • F. Hoffmann La Roche Ltd. - Key offerings
              • F. Hoffmann La Roche Ltd. - Segment focus
            • 12.9 GlaxoSmithKline Plc
              • GlaxoSmithKline Plc - Overview
              • GlaxoSmithKline Plc - Business segments
              • GlaxoSmithKline Plc - Key news
              • GlaxoSmithKline Plc - Key offerings
              • GlaxoSmithKline Plc - Segment focus
            • 12.10 Johnson and Johnson Services Inc.
              • Johnson and Johnson Services Inc. - Overview
              • Johnson and Johnson Services Inc. - Business segments
              • Johnson and Johnson Services Inc. - Key news
              • Johnson and Johnson Services Inc. - Key offerings
              • Johnson and Johnson Services Inc. - Segment focus
            • 12.11 Merck and Co. Inc.
              • Merck and Co. Inc. - Overview
              • Merck and Co. Inc. - Business segments
              • Merck and Co. Inc. - Key news
              • Merck and Co. Inc. - Key offerings
              • Merck and Co. Inc. - Segment focus
            • 12.12 Novartis AG
              • Novartis AG - Overview
              • Novartis AG - Business segments
              • Novartis AG - Key news
              • Novartis AG - Key offerings
              • Novartis AG - Segment focus
            • 12.13 Pfizer Inc.
              • Pfizer Inc. - Overview
              • Pfizer Inc. - Product / Service
              • Pfizer Inc. - Key news
              • Pfizer Inc. - Key offerings
            • 12.14 PharmaMar SA
              • PharmaMar SA - Overview
              • PharmaMar SA - Business segments
              • PharmaMar SA - Key offerings
              • PharmaMar SA - Segment focus
            • 12.15 Sanofi SA
              • Sanofi SA - Overview
              • Sanofi SA - Business segments
              • Sanofi SA - Key news
              • Sanofi SA - Key offerings
              • Sanofi SA - Segment focus
            • 12.16 Takeda Pharmaceutical Co. Ltd.
              • Takeda Pharmaceutical Co. Ltd. - Overview
              • Takeda Pharmaceutical Co. Ltd. - Product / Service
              • Takeda Pharmaceutical Co. Ltd. - Key news
              • Takeda Pharmaceutical Co. Ltd. - Key offerings
            • 12.17 Teva Pharmaceutical Industries Ltd.
              • Teva Pharmaceutical Industries Ltd. - Overview
              • Teva Pharmaceutical Industries Ltd. - Business segments
              • Teva Pharmaceutical Industries Ltd. - Key news
              • Teva Pharmaceutical Industries Ltd. - Key offerings
              • Teva Pharmaceutical Industries Ltd. - Segment focus

            13 Appendix

            • 13.1 Scope of the report
              • 13.2 Inclusions and exclusions checklist
                • Inclusions checklist
                • Exclusions checklist
              • 13.3 Currency conversion rates for US$
                • Currency conversion rates for US$
              • 13.4 Research methodology
                • Research methodology
              • 13.5 Data procurement
                • Information sources
              • 13.6 Data validation
                • Data validation
              • 13.7 Validation techniques employed for market sizing
                • Validation techniques employed for market sizing
              • 13.8 Data synthesis
                • Data synthesis
              • 13.9 360 degree market analysis
                • 360 degree market analysis
              • 13.10 List of abbreviations
                • List of abbreviations

              Research Methodology

              Technavio presents a detailed picture of the market by way of study, synthesis, and summation of data from multiple sources. The analysts have presented the various facets of the market with a particular focus on identifying the key industry influencers. The data thus presented is comprehensive, reliable, and the result of extensive research, both primary and secondary.

              INFORMATION SOURCES

              Primary sources

              • Manufacturers and suppliers
              • Channel partners
              • Industry experts
              • Strategic decision makers

              Secondary sources

              • Industry journals and periodicals
              • Government data
              • Financial reports of key industry players
              • Historical data
              • Press releases

              DATA ANALYSIS

              Data Synthesis

              • Collation of data
              • Estimation of key figures
              • Analysis of derived insights

              Data Validation

              • Triangulation with data models
              • Reference against proprietary databases
              • Corroboration with industry experts

              REPORT WRITING

              Qualitative

              • Market drivers
              • Market challenges
              • Market trends
              • Five forces analysis

              Quantitative

              • Market size and forecast
              • Market segmentation
              • Geographical insights
              • Competitive landscape

              Interested in this report?

              Get your sample now to see our research methodology and insights!

              Download Now

              Frequently Asked Questions

              Multiple Myeloma Drugs market growth will increase by $ 7944.7 mn during 2024-2028.

              The Multiple Myeloma Drugs market is expected to grow at a CAGR of 6.78% during 2024-2028.

              Multiple Myeloma Drugs market is segmented by Therapy( Targeted therapy, Biologic therapy, Chemotherapy, Others) Distribution Channel( Hospital pharmacy, Retail pharmacy, E-pharmacy)

              Abbott Laboratories, AbbVie Inc., Amgen Inc., AstraZeneca Plc, Bristol Myers Squibb Co., Cipla Inc., Daiichi Sankyo Co. Ltd., Eli Lilly and Co., F. Hoffmann La Roche Ltd., Fresenius SE and Co. KGaA, GlaxoSmithKline Plc, Johnson and Johnson Services Inc., Merck and Co. Inc., Novartis AG, Pfizer Inc., PharmaMar SA, Sanofi SA, Takeda Pharmaceutical Co. Ltd., Teva Pharmaceutical Industries Ltd. are a few of the key vendors in the Multiple Myeloma Drugs market.

              North America will register the highest growth rate of 37% among the other regions. Therefore, the Multiple Myeloma Drugs market in North America is expected to garner significant business opportunities for the vendors during the forecast period.

              US, Germany, China, Canada, UK

              • Growing incidence of multiple myelomaOne of the major drivers of the global multiple myeloma drugs market is the increasing incidence of multiple myeloma globally. Multiple myeloma is the most common type of myeloma is the driving factor this market.
              • with more than 90% of patients with myeloma having multiple myeloma. Multiple myeloma is the prime target indication for the vendors in the market is the driving factor this market.
              • as there is a huge opportunity for the vendors. Despite the recent advances in the treatment landscape for multiple myeloma is the driving factor this market.
              • including the approval of three proteasome inhibitors is the driving factor this market.
              • the market has witnessed an increase in the number of new cases of myeloma. The incidence rate of the indication has been increasing at a significant rate owing to the rising risk factors such as age is the driving factor this market.
              • obesity is the driving factor this market.
              • and plasma cell indications is the driving factor this market.
              • including monoclonal gammopathy of undetermined significance and solitary plasmacytoma. To overcome this is the driving factor this market.
              • various organizations are conducting campaigns to increase awareness of the indication and its severity. For instance is the driving factor this market.
              • organizations such as the CrowdCare Foundation is the driving factor this market.
              • Moffitt Cancer Center is the driving factor this market.
              • the American Association for Cancer Research is the driving factor this market.
              • and the International Myeloma Foundation are conducting awareness campaigns that focus on increasing the early diagnosis of the indication and educating the people about the available treatment options. These initiatives lead to the early diagnosis of the indication and the increasing adoption of therapeutics as a treatment option. These awareness campaigns will also help in decreasing the mortality rate of patients with multiple myeloma. . For instance is the driving factor this market.
              • a study by the American Cancer Society predicts a rise in multiple myeloma cases in the US in 2024. An estimated 35 is the driving factor this market.
              • 780 new diagnoses are expected (19 is the driving factor this market.
              • 520 in men and 16 is the driving factor this market.
              • 260 in women).  Tragically is the driving factor this market.
              • around 12 is the driving factor this market.
              • 540 deaths from this disease are anticipated (7 is the driving factor this market.
              • 020 in men and 5 is the driving factor this market.
              • 520 in women).  This rise in cases is expected to lead to significant growth in the global market for multiple myeloma drugs during the forecast period. is the driving factor this market.

              The Multiple Myeloma Drugs market vendors should focus on grabbing business opportunities from the Targeted therapy segment as it accounted for the largest market share in the base year.