
Proteasome Inhibitors Market Size 2025-2029
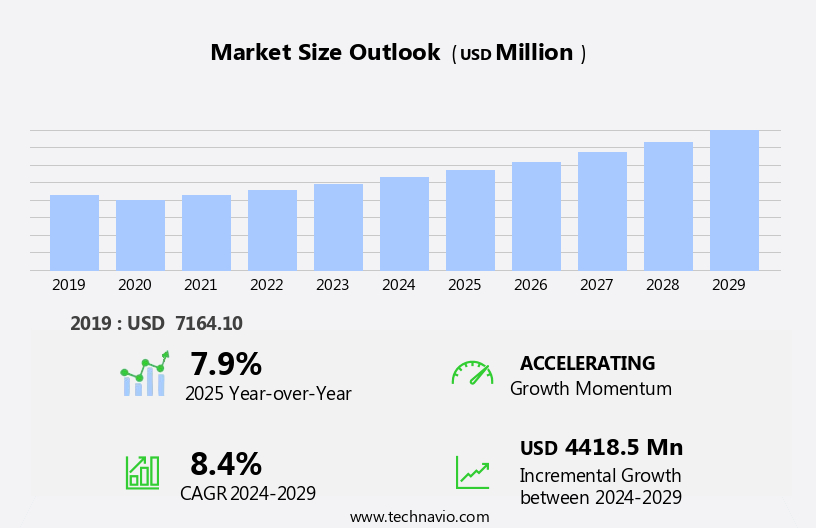
The proteasome inhibitors market size is forecast to increase by USD 4.42 billion at a CAGR of 8.4% between 2024 and 2029.
- The market is experiencing significant growth, driven primarily by the rising incidence of hematologic cancers, which represents a substantial patient population in need of effective treatment options. This trend is further fueled by advancements in drug development, leading to the emergence of novel proteasome inhibitors with improved efficacy and reduced side effects. However, the market faces challenges due to high development and manufacturing costs associated with these complex biologics. Proteasome inhibition is a promising therapeutic approach for treating multiple myeloma. Regulatory hurdles also impact adoption, as stringent regulatory requirements necessitate extensive clinical trials and lengthy approval processes.
- Navigating these challenges will require strategic partnerships, innovative manufacturing solutions, and a robust regulatory strategy. Companies that successfully address these challenges will be well-positioned to capitalize on the significant market potential and meet the unmet needs of cancer patients. However, despite the decrease in the number of new cases of non-Hodgkin lymphoma, the overall prevalence of the indication in the region is still very high
What will be the Size of the Proteasome Inhibitors Market during the forecast period?
- Proteasome inhibitors, a class of drugs targeting the proteasome complex, have emerged as promising anti-cancer agents. The proteasome, responsible for protein turnover, is a critical regulator of cellular processes, including ubiquitin-mediated protein degradation and cell cycle progression. Clinical trial design for proteasome inhibitors involves various phases, from phase I to III, with phase III trials focusing on patient outcomes and regulatory approval. Peptide inhibitors and small molecule inhibitors are two primary types of proteasome inhibitors. High-throughput screening and chemical biology have accelerated the discovery of novel inhibitors. Proteasome dysregulation, a common feature in various diseases, has led to drug repositioning efforts, expanding the potential applications of proteasome inhibitors. Multiple myeloma is a malignant plasma cells disorder, and its prevalence is projected to rise due to an aging population and improved diagnostic methods.
- Checkpoint inhibitors and car T-cell therapy are among the therapeutic areas benefiting from proteasome inhibition. The mechanism of proteasome inhibitors involves blocking proteasome activity, leading to ubiquitin-proteasome system dysfunction and subsequent cell death. Market access and healthcare economics play crucial roles in the adoption of proteasome inhibitors. Understanding the molecular target and proteasome function is essential for optimizing therapeutic outcomes and patient access. Synthetic lethality, a concept in drug development, has shown potential in enhancing the efficacy of proteasome inhibitors. The proteasome structure and degradation pathway continue to be areas of active research, with potential implications for drug design and development.
- Proteasome regulation and its role in various diseases, such as neurodegenerative disorders and cancer, remain an area of interest for researchers and pharmaceutical companies.
How is this Proteasome Inhibitors Industry segmented?
The proteasome inhibitors industry research report provides comprehensive data (region-wise segment analysis), with forecasts and estimates in "USD million" for the period 2025-2029, as well as historical data from 2019-2023 for the following segments.
- Product
- VELCADE
- KYPROLIS
- NINLARO
- Others
- Route Of Administration
- Oral
- Intravenous
- End-user
- Hospitals
- Cancer treatment centers
- Specialty clinics
- Research institutes
- Distribution Channel
- Hospital pharmacies
- Retail pharmacies
- Online pharmacies
- Geography
- North America
- US
- Canada
- Mexico
- Europe
- France
- Germany
- Italy
- UK
- APAC
- China
- India
- Japan
- Rest of World (ROW)
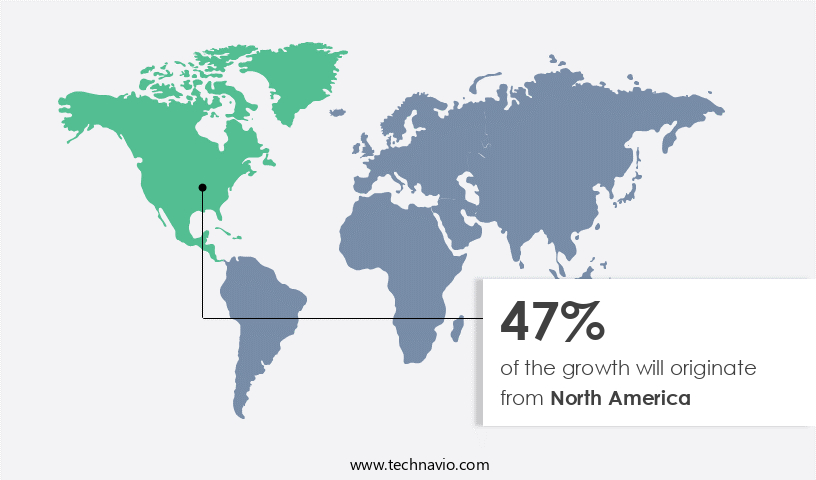
- North America
By Product Insights
The velcade segment is estimated to witness significant growth during the forecast period. Proteasome inhibitors, such as VELCADE (bortezomib), developed by Millennium Pharmaceuticals, a subsidiary of Takeda Pharmaceutical Co. Ltd, have revolutionized cancer therapy by targeting protein degradation through inhibition of the 26S proteasome. This mechanism disrupts cancer cell proliferation, particularly in multiple myeloma and mantle cell lymphoma. The approval of VELCADE marked a significant milestone in oncology, offering a novel approach to treating these diseases. The market is segmented into immunomodulators, proteasome inhibitors, alkylating agents, and the emerging segment of XPO1 inhibitors. Its administration, typically via intravenous or subcutaneous injections, is suitable for hospital and clinical settings where close monitoring is feasible. The drug's efficacy, demonstrated in both newly diagnosed and relapsed patients, has solidified its role in combination regimens, often used alongside agents like dexamethasone and lenalidomide.
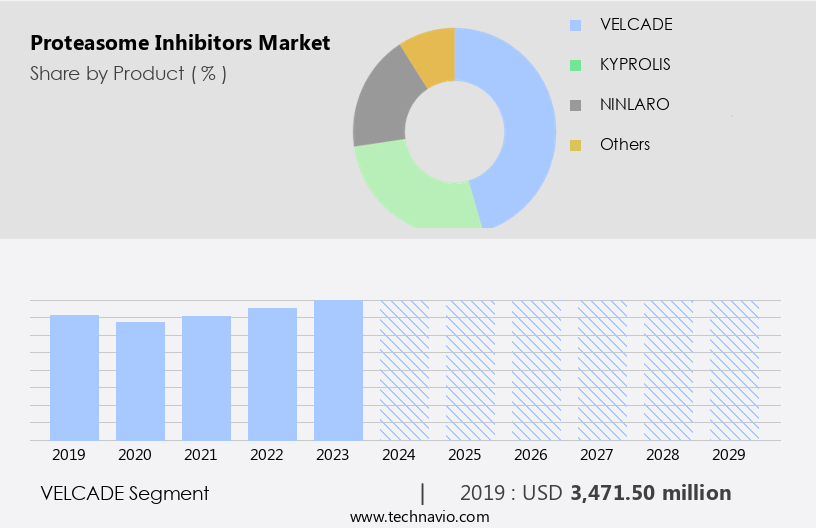
The VELCADE segment was valued at USD 3.47 billion in 2019 and showed a gradual increase during the forecast period. Additionally, Car-T cells are a type of immunotherapy that uses genetically modified T cells to target and destroy cancer cells. In the realm of precision medicine, proteasome inhibitors like VELCADE have shown promise in various molecular pathways, including lung cancer, breast cancer, and pancreatic cancer. Clinical trials have highlighted their potential in improving overall survival and response rates. However, careful dosage and administration are crucial to ensure quality of life and manage potential adverse effects. Proteasome inhibitors have also shown effectiveness in solid tumors, such as colorectal cancer, and hematological malignancies, like non-Hodgkin lymphoma and chronic lymphocytic leukemia. In combination therapy, they have synergistic effects with targeted therapies and other chemotherapeutic agents, extending progression-free survival. The market encompasses a range of therapeutics designed to address this complex and often challenging blood cancer. Despite their benefits, proteasome inhibitors face challenges, including drug resistance and potential drug interactions. Continuous research and drug discovery efforts aim to address these challenges, ensuring the ongoing development of effective and safe proteasome inhibitors for cancer therapy.
Regional Analysis
North America is estimated to contribute 47% to the growth of the global market during the forecast period. Technavio's analysts have elaborately explained the regional trends and drivers that shape the market during the forecast period.
Proteasome inhibitors play a crucial role in cancer therapy by targeting protein degradation, a key process in cell cycle regulation and the tumor microenvironment. In the field of precision medicine, proteasome inhibition is being explored for various indications, including lung cancer, mantle cell lymphoma, multiple myeloma, and non-Hodgkin lymphoma. Clinical trials are ongoing to evaluate the safety profile and clinical efficacy of these drugs in solid tumors and hematological malignancies. Proteasome inhibitors have shown promise in targeting molecular pathways involved in cancer cell proliferation and drug resistance. For instance, bortezomib, a proteasome inhibitor, has been approved for the treatment of multiple myeloma and mantle cell lymphoma.
In the US, three branded proteasome inhibitors and one generic proteasome inhibitor are currently approved for various indications. The patent expiry of a blockbuster drug, VELCADE, has led to the development of generic versions by several large and mid-sized pharmaceutical companies. These companies are registering the generic versions for the treatment of multiple myeloma, with large players such as Fresenius already operating in the market. Clinical trials are underway to assess the response rate and progression-free survival of these generic versions. In addition, proteasome inhibitors are being explored in combination therapy and targeted therapy for various indications.
For example, in breast cancer, proteasome inhibitors are being combined with other targeted therapies to improve overall survival. Waldenstrom macroglobulinemia, chronic lymphocytic leukemia, colorectal cancer, and pancreatic cancer are some of the other indications where proteasome inhibitors are being investigated. Drug interactions and adverse effects are being closely monitored during drug development to ensure patient safety and quality of life. The ongoing research in this area is expected to lead to new indications and combinations, further expanding the market for proteasome inhibitors.
Market Dynamics
Our researchers analyzed the data with 2024 as the base year, along with the key drivers, trends, and challenges. A holistic analysis of drivers will help companies refine their marketing strategies to gain a competitive advantage.
What are the Proteasome Inhibitors market drivers leading to the rise in the adoption of Industry?
- The increasing prevalence of hematologic cancers serves as the primary catalyst for market growth in this sector. Hematologic malignancies, including multiple myeloma, leukemia, and lymphoma, are on the rise due to factors such as an aging population and improved diagnostic capabilities. Among these, multiple myeloma is a significant contributor to market demand, accounting for approximately 10% of all hematological malignancies and 1% of all cancers worldwide. The incidence and mortality rates of multiple myeloma are projected to increase by 71% and 79%, respectively, between 2021 and 2025. This highlights the urgent need for effective treatment options. Proteasome inhibitors, such as Bortezomib, Carfilzomib, and Ixazomib, have emerged as crucial therapies in the treatment of multiple myeloma and other hematologic cancers.
- These drugs function by inhibiting the proteasome, a complex responsible for breaking down proteins, thereby disrupting molecular pathways that promote cancer cell growth and survival. Clinical trials have demonstrated the efficacy of proteasome inhibitors in improving progression-free survival and overall response rates in multiple myeloma patients. Furthermore, their use in combination therapy with other targeted therapies has shown promising results. Proteasome inhibitors have also shown potential in the treatment of Waldenstrom macroglobulinemia, a rare form of lymphoma. Despite their benefits, proteasome inhibitors carry a safety profile that includes potential side effects such as peripheral neuropathy and thrombocytopenia. However, ongoing research aims to mitigate these side effects and enhance their therapeutic potential. The demand for proteasome inhibitors in drug development for hematologic malignancies is expected to continue due to their proven efficacy and potential for improving patient outcomes.
What are the Proteasome Inhibitors market trends shaping the Industry?
- Continuous advancements in drug discovery is the new trend shaping growth. This sector is witnessing significant progress in research and innovation. Proteasome inhibitors have emerged as a significant class of drugs in oncology, demonstrating clinical efficacy against various types of cancer, including colorectal, multiple myeloma, prostate, breast, and non-Hodgkin lymphoma. The pharmaceutical industry is witnessing an increase in research and development activities to enhance the therapeutic potential of proteasome inhibitors. These efforts are focused on improving pharmacokinetics, reducing toxicity, and exploring personalized medicine approaches. For instance, the FDA approved Abecma (idecabtagene vicleucel), a CAR-T cell therapy from Bristol Myers Squibb and 2seventy bio, for relapsed or refractory multiple myeloma in April 2024. This approval marks a significant milestone in integrating advanced therapies with existing treatment regimens.
- Moreover, drug discovery companies are investing in next-generation proteasome inhibitors to address the limitations of current treatments. These new inhibitors aim to provide better therapeutic outcomes with fewer side effects. The integration of proteasome inhibitors into personalized medicine strategies is also gaining momentum, offering the potential for more effective and targeted cancer treatments. Advancements in drug development, regulatory approvals, and the integration of proteasome inhibitors into personalized medicine strategies are driving the growth of this market and expanding its therapeutic applications.
How does Proteasome Inhibitors market faces challenges during its growth?
- The high development and manufacturing costs of proteasome inhibitors pose a significant challenge to the industry's growth trajectory. Proteasome inhibitors, a crucial class of drugs used in cancer treatment, require substantial resources and investment to bring them to market. This financial burden hampers the industry's ability to expand and innovate, making it essential to address this challenge through strategic cost reduction measures or alternative production methods. Proteasome inhibitors, a crucial class of drugs used in cancer therapy, are known for their effectiveness against various solid tumors, particularly in cases of drug resistance. However, their production comes with significant challenges due to the complex synthesis processes and stringent regulatory compliance required. The cost of manufacturing proteasome inhibitors, such as Bortezomib, Carfilzomib, and Ixazomib, can range from USD 500 to USD 1,000 per gram, primarily due to the need for high-purity reagents, multi-step synthesis, and purification processes. Moreover, the formulation and packaging of these drugs for intravenous or oral administration further increase production expenses. Despite these challenges, the market continues to grow, driven by their ability to inhibit cancer cell proliferation in various types of cancer, including pancreatic cancer and chronic lymphocytic leukemia.
- However, potential adverse effects and drug interactions are crucial concerns that need to be addressed to ensure the safe and effective use of these drugs. The market faces significant challenges due to the high production costs and potential adverse effects. Nevertheless, the drugs' efficacy against various solid tumors, especially in cases of drug resistance, makes them a valuable addition to cancer therapy. Continued research and advancements in biotechnology and regulatory compliance are essential to mitigate production costs and ensure the safe and effective use of proteasome inhibitors.
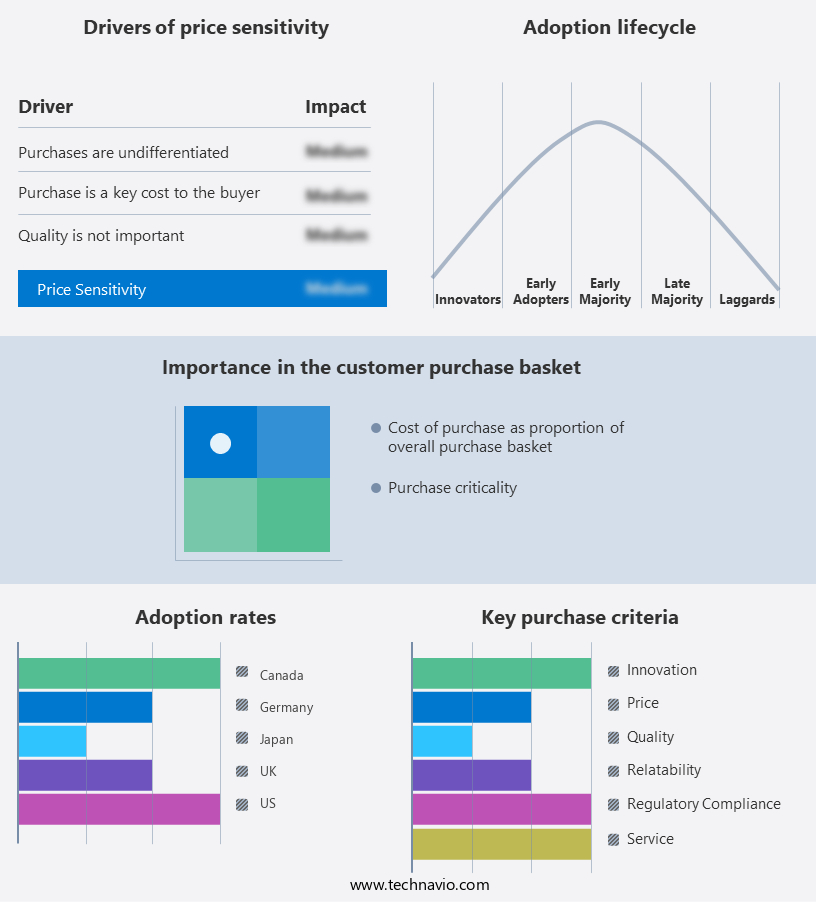
Exclusive Customer Landscape
The proteasome inhibitors market forecasting report includes the adoption lifecycle of the market, covering from the innovator's stage to the laggard's stage. It focuses on adoption rates in different regions based on penetration. Furthermore, the proteasome inhibitors market report also includes key purchase criteria and drivers of price sensitivity to help companies evaluate and develop their market growth analysis strategies.
Customer Landscape
Key Companies & Market Insights
Companies are implementing various strategies, such as strategic alliances, proteasome inhibitors market forecast, partnerships, mergers and acquisitions, geographical expansion, and product/service launches, to enhance their presence in the industry.
Amgen Inc. - The company offers the proteasome inhibitor KYPROLIS, derived from the Phase 3 ASPIRE trial, a valuable treatment option for patients seeking to minimize the risk of mortality compared to lenalidomide and dexamethasone.
The industry research and growth report includes detailed analyses of the competitive landscape of the market and information about key companies, including:
- Amgen Inc.
- Baxter International Inc.
- Bristol Myers Squibb Co.
- Fresenius SE and Co. KGaA
- GlaxoSmithKline Plc
- Johnson and Johnson
- Kezar Life Sciences Inc.
- LifeSensors Inc.
- Merck and Co. Inc.
- Novartis AG
- Pfizer Inc.
- QLi5 Therapeutics
- Takeda Pharmaceutical Co. Ltd.
- TG Therapeutics Inc.
- Thermo Fisher Scientific Inc.
- Tocris Bioscience
Qualitative and quantitative analysis of companies has been conducted to help clients understand the wider business environment as well as the strengths and weaknesses of key industry players. Data is qualitatively analyzed to categorize companies as pure play, category-focused, industry-focused, and diversified; it is quantitatively analyzed to categorize companies as dominant, leading, strong, tentative, and weak.
Recent Development and News in Proteasome Inhibitors Market
- In February 2024, Pfizer Inc. announced the U.S. Food and Drug Administration (FDA) approval of IBRANCE (palbociclib), in combination with letrozole, for the treatment of postmenopausal women with hormone receptor-positive, HER2-negative advanced or metastatic breast cancer. This approval expanded the use of proteasome inhibitors in oncology, marking a significant strategic advancement for Pfizer in the cancer therapeutics market (Pfizer Press Release, 2024)
- In December 2024, the FDA granted accelerated approval to Oncopeptides AB's investigational proteasome inhibitor, Melflufen, in combination with dexamethasone, for the treatment of relapsed or refractory multiple myeloma. This approval marked a milestone for Oncopeptides, making Melflufen the first peptide-conjugated alkylator to receive FDA approval (Oncopeptides AB Press Release, 2024).
- In March 2025, Celgene Corporation, a Bristol Myers Squibb company, reported positive top-line results from the Phase 3 ENDEAVOR study evaluating the combination of ixazomib, lenalidomide, and dexamethasone for the treatment of relapsed or refractory multiple myeloma. These results demonstrated a significant improvement in progression-free survival, further solidifying the role of proteasome inhibitors in the treatment of multiple myeloma (Celgene Corporation Press Release, 2025).
Research Analyst Overview
The market continues to evolve as research advances in cell cycle regulation and protein degradation pathways. These inhibitors play a crucial role in cancer therapy by targeting the tumor microenvironment and disrupting molecular pathways associated with cancer cell proliferation. Proteasome inhibitors have demonstrated clinical efficacy in various sectors, including colorectal cancer, multiple myeloma, prostate cancer, non-Hodgkin lymphoma, and breast cancer. Clinical trials are ongoing to evaluate the safety profile and progression-free survival of proteasome inhibitors in mantle cell lymphoma and Waldenstrom macroglobulinemia. Precision medicine approaches are being explored to optimize dosage and administration based on individual patient characteristics. Multiple myeloma, a type of blood cancer, affects the production of healthy plasma cells in the bone marrow, leading to the accumulation of abnormal proteins called M-proteins or paraproteins
Proteasome inhibitors have shown promise in cancer therapy by targeting the tumor microenvironment and disrupting molecular pathways associated with cancer cell proliferation. The market for these inhibitors is expected to remain complex and dynamic, with continual advancements in drug development and evolving patterns in cancer therapy. The integration of precision medicine approaches and targeted therapy strategies is expected to further enhance the clinical utility of proteasome inhibitors. Ongoing research and development efforts are focused on optimizing dosage and administration, improving response rates, and addressing drug resistance. The potential applications of proteasome inhibitors in cancer therapy reflect the ongoing unfolding of market activities and the evolving nature of cancer therapy.
Dive into Technavio's strong research methodology, blending expert interviews, extensive data synthesis, and validated models for unparalleled Proteasome Inhibitors Market insights. See full methodology.
|
Market Scope |
|
|
Report Coverage |
Details |
|
Page number |
243 |
|
Base year |
2024 |
|
Historic period |
2019-2023 |
|
Forecast period |
2025-2029 |
|
Growth momentum & CAGR |
Accelerate at a CAGR of 8.4% |
|
Market growth 2025-2029 |
USD 4.42 billion |
|
Market structure |
Fragmented |
|
YoY growth 2024-2025(%) |
7.9 |
|
Key countries |
US, China, Germany, Canada, UK, Japan, France, India, Italy, and Mexico |
|
Competitive landscape |
Leading Companies, Market Positioning of Companies, Competitive Strategies, and Industry Risks |
What are the Key Data Covered in this Proteasome Inhibitors Market Research and Growth Report?
- CAGR of the Proteasome Inhibitors industry during the forecast period
- Detailed information on factors that will drive the growth and forecasting between 2025 and 2029
- Precise estimation of the size of the market and its contribution of the industry in focus to the parent market
- Accurate predictions about upcoming growth and trends and changes in consumer behaviour
- Growth of the market across North America, Europe, Asia, and Rest of World (ROW)
- Thorough analysis of the market's competitive landscape and detailed information about companies
- Comprehensive analysis of factors that will challenge the proteasome inhibitors market growth of industry companies
We can help! Our analysts can customize this proteasome inhibitors market research report to meet your requirements.
 RIA -
RIA - 
