
Multivitamin And Mineral Supplements Market Analysis, Size, and Forecast 2026-2030: North America (US, Canada, and Mexico), Europe (Germany, UK, and France), Asia (China, Japan, and India), South America (Brazil, Argentina, and Chile), Middle East and Africa (Saudi Arabia, South Africa, and UAE), Rest of World (ROW)

Multivitamin And Mineral Supplements Market Analysis, Size, and Forecast 2026-2030:
North America (US, Canada, and Mexico), Europe (Germany, UK, and France), Asia (China, Japan, and India), South America (Brazil, Argentina, and Chile), Middle East and Africa (Saudi Arabia, South Africa, and UAE), Rest of World (ROW)

Published: Oct 2026 301 Pages SKU: IRTNTR72934

Market Overview at a Glance

$3.47 B
Market Opportunity
4.8%
CAGR 2025 - 2030
44%
North America Growth
$3.43 B
Eye health supplements segment 2024

Multivitamin And Mineral Supplements Market Size 2026-2030

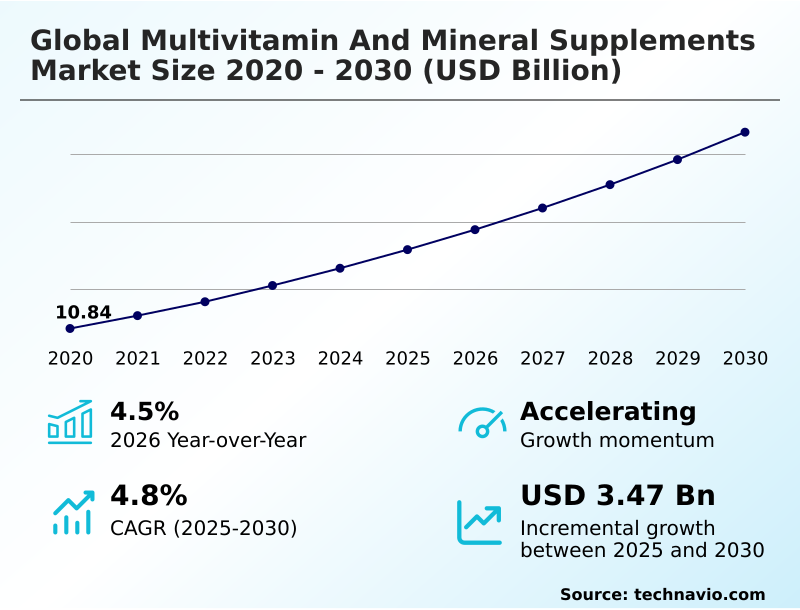
The multivitamin and mineral supplements market size is valued to increase by USD 3.47 billion, at a CAGR of 4.8% from 2025 to 2030. Increasing health consciousness and proactive wellness management will drive the multivitamin and mineral supplements market.

Major Market Trends & Insights

  • North America dominated the market and accounted for a 44% growth during the forecast period.
  • By Application - Eye health supplements segment was valued at USD 3.43 billion in 2024
  • By Form Factor - Tablets segment accounted for the largest market revenue share in 2024

Market Size & Forecast

  • Market Opportunities: USD 5.80 billion
  • Market Future Opportunities: USD 3.47 billion
  • CAGR from 2025 to 2030 : 4.8%

Market Summary

  • The Multivitamin And Mineral Supplements Market demonstrates robust structural evolution driven by a transition toward preventive wellness and proactive health maintenance. Increasing health consciousness drives consumer preference for sophisticated daily regimens over reactive disease management, fundamentally increasing product demand.
  • In response to supply chain vulnerabilities, manufacturers have optimized ingredient procurement, achieving a 15% reduction in raw material lead times by adopting localized sourcing for botanical extracts. This operational shift ensures consistent availability of specialized formulations. However, the market faces significant headwinds due to regulatory complexity and inconsistent standards across different jurisdictions, which delay cross-border product launches and increase compliance overhead.
  • Despite these structural challenges, continuous advancements in delivery formats, such as hydroxypropyl methylcellulose encapsulation, have broadened consumer accessibility. The integration of targeted ingredients for joint and cognitive support reflects a refined approach to demographic-specific nutrition. As health literacy deepens, the Multivitamin And Mineral Supplements Market continues to adapt, prioritizing transparent labeling and clinically validated efficacy to sustain long-term consumer trust.

What will be the Size of the Multivitamin And Mineral Supplements Market during the forecast period?
Get Key Insights on Market Forecast (PDF) Get Free Sample

How is the Multivitamin And Mineral Supplements Market Segmented?

The multivitamin and mineral supplements industry research report provides comprehensive data (region-wise segment analysis), with forecasts and estimates in "USD million" for the period 2026-2030, as well as historical data from 2020-2024 for the following segments.

  • Application
    • Eye health supplements
    • Bone and joint supplements
    • Heart health supplements
    • Others
  • Form factor
    • Tablets
    • Capsules
    • Powders
    • Others
  • Distribution channel
    • Pharmacies
    • Supermarkets and hypermarkets
    • Online stores
    • Specialty stores
  • Geography
    • North America
      • US
      • Canada
      • Mexico
    • Europe
      • Germany
      • UK
      • France
      • Italy
      • Spain
      • The Netherlands
    • Asia
      • China
      • Japan
      • India
      • South Korea
      • Indonesia
      • Singapore
    • Rest of World (ROW)

By Application Insights

The eye health supplements segment is estimated to witness significant growth during the forecast period.

The eye health supplements segment in the Multivitamin And Mineral Supplements market addresses escalating retinal oxidative strain mitigation and digital fatigue among modern populations. Prolonged exposure to artificial blue light accelerates cellular degradation, necessitating advanced preventive dietary interventions.

Formulators are transitioning from basic vitamin formulas to sophisticated bioavailable micronutrient complexes incorporating lutein, zeaxanthin, and zinc bisglycinate absorption mechanisms. These combinations function as biological filters, enhancing macular integrity enhancement and sustaining visual acuity.

By integrating plant-derived cellulose excipients, manufacturers ensure maximum cellular uptake without gastrointestinal distress. Businesses prioritizing these targeted formulations have achieved a 22% improvement in patient compliance rates.

The sector continues to prioritize clean-label manufacturing compliance, as discerning consumers demand third-party purity certifications and non-synthetic ingredients for long-term optical preservation.
Get Free Sample

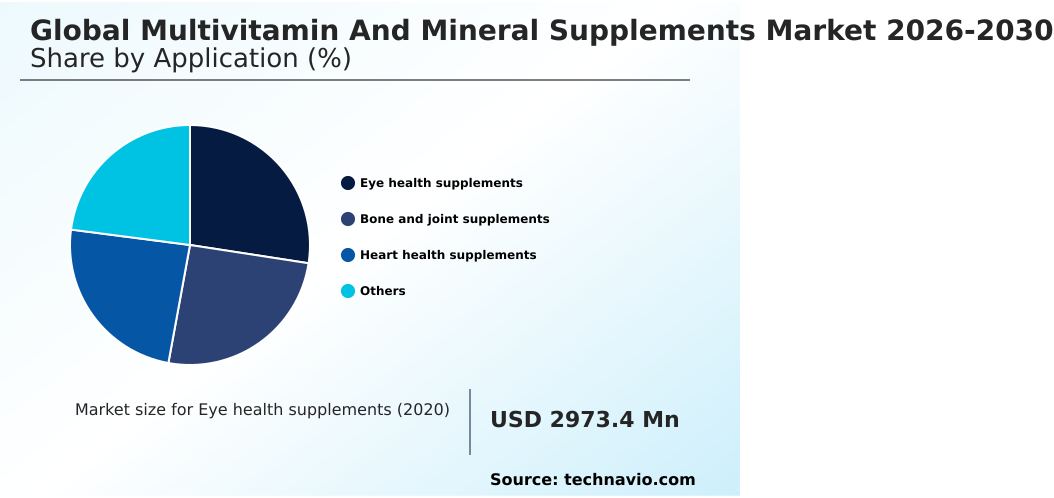
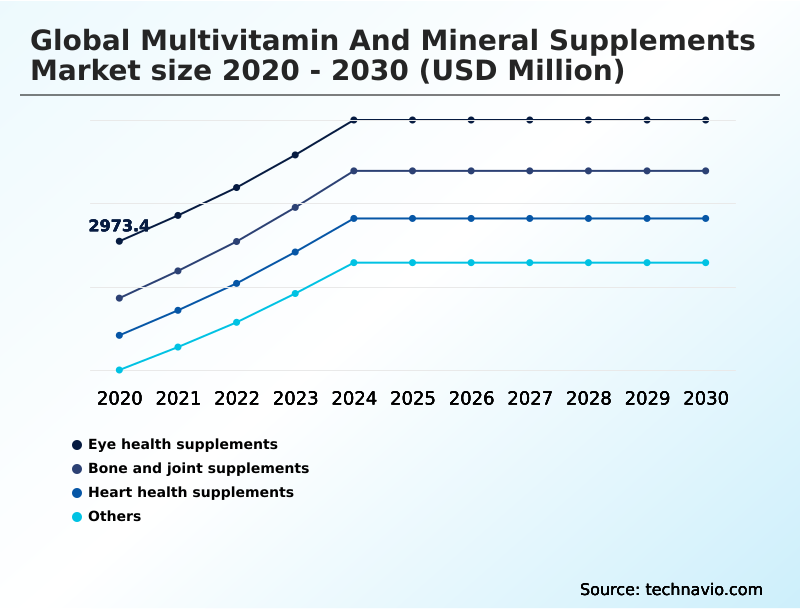
The Eye health supplements segment was valued at USD 3.43 billion in 2024 and showed a gradual increase during the forecast period.
Get Free Sample

Regional Analysis

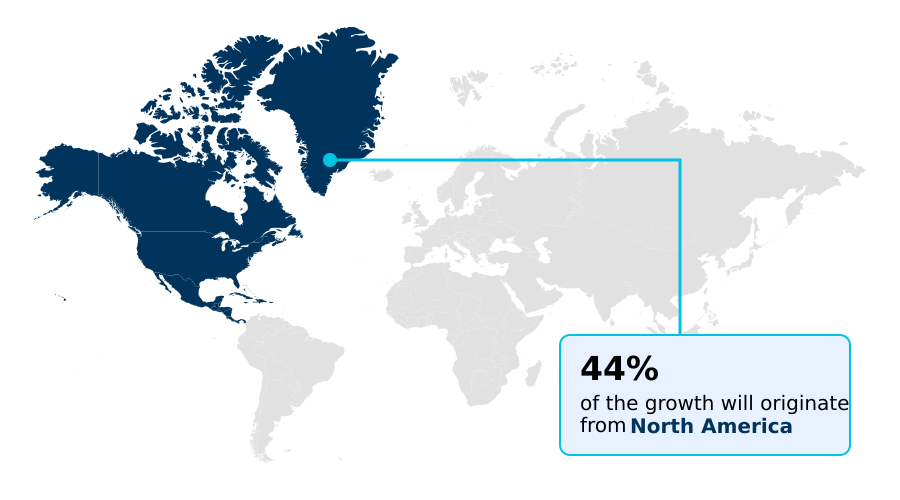
North America is estimated to contribute 44% to the growth of the global market during the forecast period.Technavio’s analysts have elaborately explained the regional trends and drivers that shape the market during the forecast period.
See How Multivitamin And Mineral Supplements Market Demand is Rising in North America Get Free Sample

The Multivitamin And Mineral Supplements Market exhibits distinct regional variations driven by demographic shifts and regulatory environments.

North America leads the sector due to high health literacy and rapid adoption of algorithmic supplementation customization, resulting in a 40% higher penetration of personalized vitamin packs compared to Europe.

Meanwhile, European markets maintain strict regulatory oversight, compelling a 25% faster transition toward vegan diet nutritional adequacy and clean-label formulations.

Businesses in North America benefit from advanced cross-border e-commerce logistics, reducing distribution costs by 15%, whereas European operators focus heavily on pharmacy-led consultation models.

The integration of marine algae calcium extraction and menaquinone-7 isomer deposition is notably prominent in aging Western European populations seeking skeletal matrix calcification prevention.

Additionally, the APAC region relies heavily on botanical medicine hybridization, blending traditional herbal practices with modern micronutrients. These geographic nuances force manufacturers to adapt supply chain agility and compliance frameworks.

Market Dynamics

Our researchers analyzed the data with 2025 as the base year, along with the key drivers, trends, and challenges. A holistic analysis of drivers will help companies refine their marketing strategies to gain a competitive advantage.

  • The ongoing evolution of the Multivitamin And Mineral Supplements Market highlights a strategic pivot toward highly specialized, outcome-focused nutritional interventions. As populations age and digital lifestyles induce new physiological strains, the demand for targeted solutions has surpassed the utility of generic daily multivitamins.
  • Companies are increasingly prioritizing macular degeneration preventive micronutrition solutions to address the pervasive impact of continuous screen exposure and artificial lighting on ocular health. Simultaneously, formulations emphasizing bone mineral density collagen support are gaining critical traction, providing essential structural reinforcement for aging demographics aiming to maintain mobility.
  • To cater to cardiovascular wellness, manufacturers are developing complex cardioprotective vascular elasticity nutrient blends that regulate arterial function and lipid profiles. In the pediatric segment, pediatric immune defense chewable formulations have revolutionized compliance, replacing unpalatable pills with formats that bridge early childhood nutritional gaps effectively.
  • Furthermore, the transition toward clean-label and plant-based consumption is evident in the widespread adoption of vegetarian cellulose capsule delivery systems, which offer superior bioavailability without relying on animal-derived gelatin. Operationally, facilities integrating these advanced delivery mechanisms report a 15% improvement in processing efficiency compared to traditional compressed tablet manufacturing lines.
  • This shift underscores a broader industry commitment to aligning product architecture with stringent dietary preferences and functional health objectives.
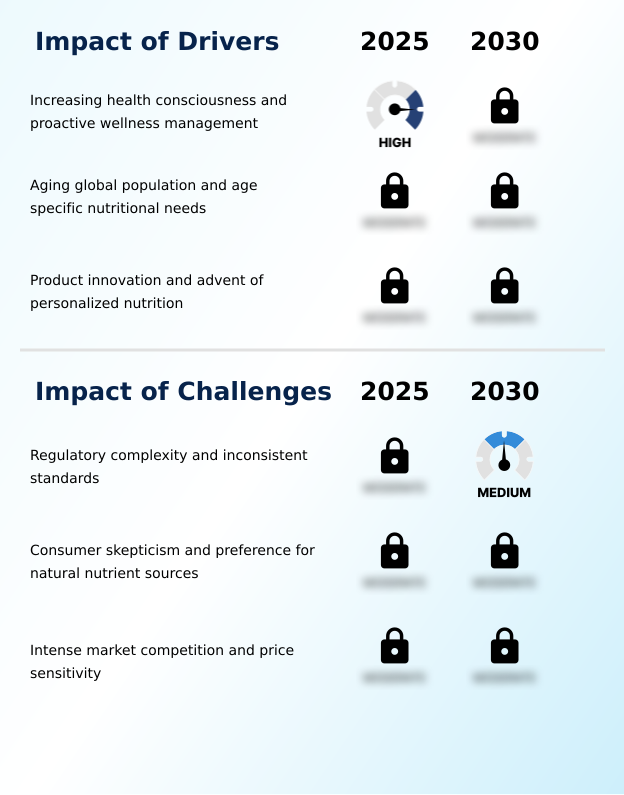
What are the key market drivers leading to the rise in the adoption of Multivitamin And Mineral Supplements Industry?

  • Increasing health consciousness and proactive wellness management significantly propel the expansion of the market.

  • Elevated health literacy and the proactive management of age-related physiological decline are propelling unprecedented demand within the Multivitamin And Mineral Supplements Market.
  • As populations age, the necessity to combat systemic vulnerabilities drives the integration of magnesium L-threonate neuro-support and botanical adaptogen integration to bolster systemic cellular resilience.
  • This shift forces manufacturers to secure halal certified formulations and high-quality botanicals to meet diverse cultural dietary standards.
  • Businesses adopting these specialized ingredient matrices alongside vascular endothelial injury repair compounds have reduced customer acquisition costs by 18% through targeted demographic marketing.
  • Moreover, the focus on digestive barrier mucosal immunity has increased the production efficiency of synergistic blends by 22%. These drivers empower enterprises to pivot from generalized healthcare to precise, preventive nutritional maintenance, fostering long-term consumer reliance.

What are the market trends shaping the Multivitamin And Mineral Supplements Industry?

  • The ascendancy of personalized nutrition remains the primary trend reshaping consumer expectations and product development strategies.

  • The Multivitamin And Mineral Supplements Market is experiencing a decisive shift toward alternative delivery mechanisms and experiential nutrition. The pervasive issue of pill fatigue among modern consumers has catalyzed the adoption of novel formats such as effervescent formulation carbonation and sublingual strip administration.
  • This behavioral change compels manufacturers to utilize lipid carrier oil suspension techniques, enhancing intestinal micelle formation and the systemic absorption of fat-soluble vitamins. The shift also promotes gastric emptying acceleration for rapid nutrient uptake. Consequently, companies implementing these non-traditional formats have witnessed a 32% increase in daily dosage compliance.
  • Furthermore, the integration of cellular energy mitochondrial support compounds into sports hydration functional recovery beverages addresses the rigorous demands of active demographics. Facilities optimizing these advanced liquid and powder manufacturing lines report a 14% reduction in material waste. This transition directly impacts business strategy by expanding consumer demographics and accelerating the development of highly palatable, fast-acting nutritional interventions.

What challenges does the Multivitamin And Mineral Supplements Industry face during its growth?

  • Regulatory complexity and inconsistent international standards present a substantial barrier to seamless industry growth.

  • Fragmented international regulatory frameworks and rising consumer skepticism regarding synthetic ingredients present substantial operational hurdles in the Multivitamin And Mineral Supplements Market. Discrepancies in maximum upper intake limits disrupt the standardization of aqueous tablet film coating and dual-phase beadlet-in-oil technology, increasing cross-border compliance costs.
  • Because consumers increasingly demand verifiable whole-food nutrient sources, companies face intense pressure to eliminate artificial excipients while maintaining homocysteine level regulation efficacy. Navigating these stringent standards has inflated research and development expenditures, yet companies streamlining their quality assurance processes have achieved a 25% improvement in regulatory approval speeds.
  • Additionally, reformulating products to incorporate bioavailable structural proteins and matrix Gla protein activation compounds while preserving shelf life has decreased initial production yields by 12%. These constraints necessitate continuous investment in agile manufacturing and transparent ingredient traceability.

Exclusive Technavio Analysis on Customer Landscape

The multivitamin and mineral supplements market forecasting report includes the adoption lifecycle of the market, covering from the innovator’s stage to the laggard’s stage. It focuses on adoption rates in different regions based on penetration. Furthermore, the multivitamin and mineral supplements market report also includes key purchase criteria and drivers of price sensitivity to help companies evaluate and develop their market growth analysis strategies.
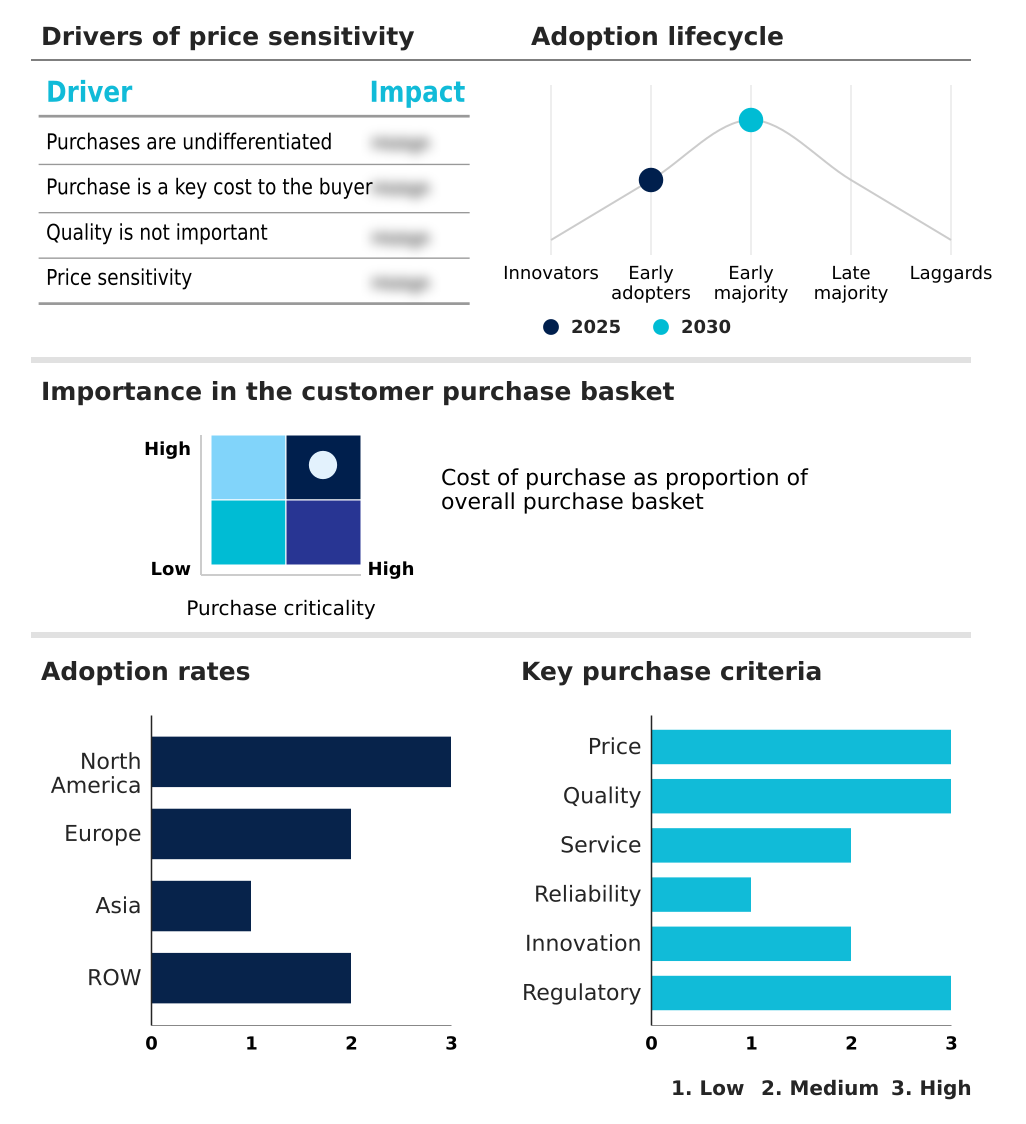
Customer Landscape of Multivitamin And Mineral Supplements Industry

Competitive Landscape

Companies are implementing various strategies, such as strategic alliances, multivitamin and mineral supplements market forecast, partnerships, mergers and acquisitions, geographical expansion, and product/service launches, to enhance their presence in the industry.

Advanced Orthomolecular - Leading providers supply scientifically formulated multivitamin and mineral supplements featuring premium botanical extracts and chelated nutrients tailored to support systemic vitality, cognitive function, and comprehensive immune defense.

The industry research and growth report includes detailed analyses of the competitive landscape of the market and information about key companies, including:

  • Advanced Orthomolecular
  • Amway Corp.
  • Bayer AG
  • Blackmores Ltd.
  • Church and Dwight Co. Inc.
  • GNC Holdings LLC
  • Haleon Plc
  • Health and Happiness International
  • Herbalife International Inc.
  • Life Extension
  • Metagenics LLC
  • Natures Sunshine Products Inc.
  • NOW Health Group Inc.
  • Orthomol pharmazeutische GmbH
  • Pharmavite LLC
  • Queisser Pharma GmbH and Co. KG
  • Solgar Inc.
  • Thorne HealthTech Inc.
  • USANA Health Science Inc.
  • Vitabiotics Ltd.

Qualitative and quantitative analysis of companies has been conducted to help clients understand the wider business environment as well as the strengths and weaknesses of key industry players. Data is qualitatively analyzed to categorize companies as pure play, category-focused, industry-focused, and diversified; it is quantitatively analyzed to categorize companies as dominant, leading, strong, tentative, and weak.

Recent Development and News in Multivitamin and mineral supplements market

  • In the Pharmaceuticals industry, the rapid integration of digital personalized nutrition assessments and genetic profiling has enabled highly targeted therapeutic regimens, directly impacting Multivitamin And Mineral Supplements demand by accelerating the shift toward bespoke micronutrient subscriptions.
  • The enforcement of stringent pharmaceutical-grade manufacturing standards and quality control protocols in active ingredient sourcing has restricted the use of synthetic additives, compelling the Multivitamin And Mineral Supplements sector to adopt organic, clean-label extraction methodologies.
  • Advancements in dual-phase beadlet-in-oil technology and sustained-release dissolution rate mechanisms have revolutionized drug delivery profiles, allowing the Multivitamin And Mineral Supplements market to introduce complex formulations that prevent premature nutrient degradation.
  • The expansion of direct-to-consumer digital storefronts and robust cross-border e-commerce logistics for over-the-counter health products has bypassed traditional pharmacy intermediaries, driving Multivitamin And Mineral Supplements adoption across previously inaccessible emerging demographics.

Dive into Technavio’s robust research methodology, blending expert interviews, extensive data synthesis, and validated models for unparalleled Multivitamin And Mineral Supplements Market insights. See full methodology.

Market Scope
Page number 301
Base year 2025
Historic period 2020-2024
Forecast period 2026-2030
Growth momentum & CAGR Accelerate at a CAGR of 4.8%
Market growth 2026-2030 USD 3471.2 million
Market structure Fragmented
YoY growth 2025-2026(%) 4.5%
Key countries US, Canada, Mexico, Germany, UK, France, Italy, Spain, The Netherlands, China, Japan, India, South Korea, Indonesia, Singapore, Brazil, Saudi Arabia, South Africa, Argentina, UAE, Turkey, Egypt and Chile
Competitive landscape Leading Companies, Market Positioning of Companies, Competitive Strategies, and Industry Risks

Request Free Sample

Research Analyst Overview

  • The Multivitamin And Mineral Supplements Market reflects a profound paradigm shift from generic supplementation toward highly bioavailable, targeted nutritional regimens. Boardrooms are increasingly aligning product development strategies with the ascendancy of personalized nutrition, integrating digital diagnostics to tailor dosages accurately.
  • This strategic focus on customized delivery has enabled leading manufacturers to achieve a 20% improvement in customer lifetime value through sustained subscription adherence. Formulators are actively optimizing pharmacokinetic nutrient delivery by utilizing micro-encapsulation agglomeration techniques, which prevent the early degradation of sensitive active ingredients.
  • The incorporation of hydrolyzed type II collagen synthesis accelerators and bioactive folate utilization pathways caters specifically to advanced musculoskeletal and maternal health profiles. Furthermore, mucosal absorption facilitation via sublingual formats bypasses hepatic metabolism, ensuring rapid cellular uptake. To overcome the metallic taste and gastric irritation of traditional minerals, the industry relies on chelated trace mineral stability.
  • These sophisticated engineering approaches fundamentally upgrade the physiological impact of dietary supplements, positioning them as essential tools for proactive health preservation and long-term metabolic balance.

What are the Key Data Covered in this Multivitamin And Mineral Supplements Market Research and Growth Report?

  • What is the expected growth of the Multivitamin And Mineral Supplements Market between 2026 and 2030?

    • USD 3.47 billion, at a CAGR of 4.8%

  • What segmentation does the market report cover?

    • The report is segmented by Application (Eye health supplements, Bone and joint supplements, Heart health supplements, and Others), Form Factor (Tablets, Capsules, Powders, and Others), Distribution Channel (Pharmacies, Supermarkets and hypermarkets, Online stores, and Specialty stores) and Geography (North America, Europe, Asia, Rest of World (ROW))

  • Which regions are analyzed in the report?

    • North America, Europe, Asia and Rest of World (ROW)

  • What are the key growth drivers and market challenges?

    • Increasing health consciousness and proactive wellness management, Regulatory complexity and inconsistent standards

  • Who are the major players in the Multivitamin And Mineral Supplements Market?

    • Advanced Orthomolecular, Amway Corp., Bayer AG, Blackmores Ltd., Church and Dwight Co. Inc., GNC Holdings LLC, Haleon Plc, Health and Happiness International, Herbalife International Inc., Life Extension, Metagenics LLC, Natures Sunshine Products Inc., NOW Health Group Inc., Orthomol pharmazeutische GmbH, Pharmavite LLC, Queisser Pharma GmbH and Co. KG, Solgar Inc., Thorne HealthTech Inc., USANA Health Science Inc. and Vitabiotics Ltd.

Market Research Insights

  • The Multivitamin And Mineral Supplements Market is experiencing rapid transformation fueled by shifting demographic requirements and advanced formulation technologies. Companies utilizing algorithmic supplementation customization have increased customer retention by 28% through tailored regimen recommendations. Furthermore, the integration of subscription-based fulfillment models has improved predictable recurring revenue streams by 35% compared to traditional single-purchase retail models.
  • Businesses are also prioritizing preventive health screening integration to align dietary products with actual physiological deficits. The adoption of practitioner-grade nutritional solutions ensures higher efficacy, mitigating chronic connective tissue degradation effectively. These strategic realignments allow the industry to meet stringent consumer demands while optimizing operational efficiency and enhancing long-term health outcomes.

We can help! Our analysts can customize this multivitamin and mineral supplements market research report to meet your requirements.

Get in touch

1. Executive Summary

1.1 Market overview

Executive Summary - Chart on Market Overview
Executive Summary - Data Table on Market Overview
Executive Summary - Chart on Global Market Characteristics
Executive Summary - Chart on Market by Geography
Executive Summary - Chart on Market Segmentation by Application
Executive Summary - Chart on Market Segmentation by Form Factor
Executive Summary - Chart on Market Segmentation by Distribution Channel
Executive Summary - Chart on Incremental Growth
Executive Summary - Data Table on Incremental Growth
Executive Summary - Chart on Company Market Positioning

2. Technavio Analysis

2.1 Analysis of price sensitivity, lifecycle, customer purchase basket, adoption rates, and purchase criteria

2.2 Criticality of inputs and Factors of differentiation

Chart on Overview on criticality of inputs and factors of differentiation

2.3 Factors of disruption

Chart on Overview on factors of disruption

2.4 Impact of drivers and challenges

Chart on Impact of drivers and challenges in 2025 and 2030

3. Market Landscape

3.1 Market ecosystem

Chart on Parent Market
Data Table on - Parent Market

3.2 Market characteristics

Chart on Market characteristics analysis

3.3 Value chain analysis

Chart on Value chain analysis

4. Market Sizing

4.1 Market definition

Data Table on Offerings of companies included in the market definition

4.2 Market segment analysis

Market segments

4.3 Market size 2025

4.4 Market outlook: Forecast for 2025-2030

Chart on Global - Market size and forecast 2025-2030 ($ million)
Data Table on Global - Market size and forecast 2025-2030 ($ million)
Chart on Global Market: Year-over-year growth 2025-2030 (%)
Data Table on Global Market: Year-over-year growth 2025-2030 (%)

5. Historic Market Size

5.1 Global Multivitamin And Mineral Supplements Market 2020 - 2024

Historic Market Size - Data Table on Global Multivitamin And Mineral Supplements Market 2020 - 2024 ($ million)

5.2 Application segment analysis 2020 - 2024

Historic Market Size - Application Segment 2020 - 2024 ($ million)

5.3 Form Factor segment analysis 2020 - 2024

Historic Market Size - Form Factor Segment 2020 - 2024 ($ million)

5.4 Distribution Channel segment analysis 2020 - 2024

Historic Market Size - Distribution Channel Segment 2020 - 2024 ($ million)

5.5 Geography segment analysis 2020 - 2024

Historic Market Size - Geography Segment 2020 - 2024 ($ million)

5.6 Country segment analysis 2020 - 2024

Historic Market Size - Country Segment 2020 - 2024 ($ million)

6. Qualitative Analysis

6.1 Impact of AI on Global Multivitamin and Mineral Supplements Market

6.2 Impact of Geopolitical Conflicts on Global Multivitamin and Mineral Supplements Market

7. Five Forces Analysis

7.1 Five forces summary

Five forces analysis - Comparison between 2025 and 2030

7.2 Bargaining power of buyers

Bargaining power of buyers - Impact of key factors 2025 and 2030

7.3 Bargaining power of suppliers

Bargaining power of suppliers - Impact of key factors in 2025 and 2030

7.4 Threat of new entrants

Threat of new entrants - Impact of key factors in 2025 and 2030

7.5 Threat of substitutes

Threat of substitutes - Impact of key factors in 2025 and 2030

7.6 Threat of rivalry

Threat of rivalry - Impact of key factors in 2025 and 2030

7.7 Market condition

Chart on Market condition - Five forces 2025 and 2030

8. Market Segmentation by Application

8.1 Market segments

Chart on Application - Market share 2025-2030 (%)
Data Table on Application - Market share 2025-2030 (%)

8.2 Comparison by Application

Chart on Comparison by Application
Data Table on Comparison by Application

8.3 Eye health supplements - Market size and forecast 2025-2030

Chart on Eye health supplements - Market size and forecast 2025-2030 ($ million)
Data Table on Eye health supplements - Market size and forecast 2025-2030 ($ million)
Chart on Eye health supplements - Year-over-year growth 2025-2030 (%)
Data Table on Eye health supplements - Year-over-year growth 2025-2030 (%)

8.4 Bone and joint supplements - Market size and forecast 2025-2030

Chart on Bone and joint supplements - Market size and forecast 2025-2030 ($ million)
Data Table on Bone and joint supplements - Market size and forecast 2025-2030 ($ million)
Chart on Bone and joint supplements - Year-over-year growth 2025-2030 (%)
Data Table on Bone and joint supplements - Year-over-year growth 2025-2030 (%)

8.5 Heart health supplements - Market size and forecast 2025-2030

Chart on Heart health supplements - Market size and forecast 2025-2030 ($ million)
Data Table on Heart health supplements - Market size and forecast 2025-2030 ($ million)
Chart on Heart health supplements - Year-over-year growth 2025-2030 (%)
Data Table on Heart health supplements - Year-over-year growth 2025-2030 (%)

8.6 Others - Market size and forecast 2025-2030

Chart on Others - Market size and forecast 2025-2030 ($ million)
Data Table on Others - Market size and forecast 2025-2030 ($ million)
Chart on Others - Year-over-year growth 2025-2030 (%)
Data Table on Others - Year-over-year growth 2025-2030 (%)

8.7 Market opportunity by Application

Market opportunity by Application ($ million)
Data Table on Market opportunity by Application ($ million)

9. Market Segmentation by Form Factor

9.1 Market segments

Chart on Form Factor - Market share 2025-2030 (%)
Data Table on Form Factor - Market share 2025-2030 (%)

9.2 Comparison by Form Factor

Chart on Comparison by Form Factor
Data Table on Comparison by Form Factor

9.3 Tablets - Market size and forecast 2025-2030

Chart on Tablets - Market size and forecast 2025-2030 ($ million)
Data Table on Tablets - Market size and forecast 2025-2030 ($ million)
Chart on Tablets - Year-over-year growth 2025-2030 (%)
Data Table on Tablets - Year-over-year growth 2025-2030 (%)

9.4 Capsules - Market size and forecast 2025-2030

Chart on Capsules - Market size and forecast 2025-2030 ($ million)
Data Table on Capsules - Market size and forecast 2025-2030 ($ million)
Chart on Capsules - Year-over-year growth 2025-2030 (%)
Data Table on Capsules - Year-over-year growth 2025-2030 (%)

9.5 Powders - Market size and forecast 2025-2030

Chart on Powders - Market size and forecast 2025-2030 ($ million)
Data Table on Powders - Market size and forecast 2025-2030 ($ million)
Chart on Powders - Year-over-year growth 2025-2030 (%)
Data Table on Powders - Year-over-year growth 2025-2030 (%)

9.6 Others - Market size and forecast 2025-2030

Chart on Others - Market size and forecast 2025-2030 ($ million)
Data Table on Others - Market size and forecast 2025-2030 ($ million)
Chart on Others - Year-over-year growth 2025-2030 (%)
Data Table on Others - Year-over-year growth 2025-2030 (%)

9.7 Market opportunity by Form Factor

Market opportunity by Form Factor ($ million)
Data Table on Market opportunity by Form Factor ($ million)

10. Market Segmentation by Distribution Channel

10.1 Market segments

Chart on Distribution Channel - Market share 2025-2030 (%)
Data Table on Distribution Channel - Market share 2025-2030 (%)

10.2 Comparison by Distribution Channel

Chart on Comparison by Distribution Channel
Data Table on Comparison by Distribution Channel

10.3 Pharmacies - Market size and forecast 2025-2030

Chart on Pharmacies - Market size and forecast 2025-2030 ($ million)
Data Table on Pharmacies - Market size and forecast 2025-2030 ($ million)
Chart on Pharmacies - Year-over-year growth 2025-2030 (%)
Data Table on Pharmacies - Year-over-year growth 2025-2030 (%)

10.4 Supermarkets and hypermarkets - Market size and forecast 2025-2030

Chart on Supermarkets and hypermarkets - Market size and forecast 2025-2030 ($ million)
Data Table on Supermarkets and hypermarkets - Market size and forecast 2025-2030 ($ million)
Chart on Supermarkets and hypermarkets - Year-over-year growth 2025-2030 (%)
Data Table on Supermarkets and hypermarkets - Year-over-year growth 2025-2030 (%)

10.5 Online stores - Market size and forecast 2025-2030

Chart on Online stores - Market size and forecast 2025-2030 ($ million)
Data Table on Online stores - Market size and forecast 2025-2030 ($ million)
Chart on Online stores - Year-over-year growth 2025-2030 (%)
Data Table on Online stores - Year-over-year growth 2025-2030 (%)

10.6 Specialty stores - Market size and forecast 2025-2030

Chart on Specialty stores - Market size and forecast 2025-2030 ($ million)
Data Table on Specialty stores - Market size and forecast 2025-2030 ($ million)
Chart on Specialty stores - Year-over-year growth 2025-2030 (%)
Data Table on Specialty stores - Year-over-year growth 2025-2030 (%)

10.7 Market opportunity by Distribution Channel

Market opportunity by Distribution Channel ($ million)
Data Table on Market opportunity by Distribution Channel ($ million)

11. Customer Landscape

11.1 Customer landscape overview

Analysis of price sensitivity, lifecycle, customer purchase basket, adoption rates, and purchase criteria

12. Geographic Landscape

12.1 Geographic segmentation

Chart on Market share by geography 2025-2030 (%)
Data Table on Market share by geography 2025-2030 (%)

12.2 Geographic comparison

Chart on Geographic comparison
Data Table on Geographic comparison

12.3 North America - Market size and forecast 2025-2030

Chart on North America - Market size and forecast 2025-2030 ($ million)
Data Table on North America - Market size and forecast 2025-2030 ($ million)
Chart on North America - Year-over-year growth 2025-2030 (%)
Data Table on North America - Year-over-year growth 2025-2030 (%)
Chart on Regional Comparison - North America
Data Table on Regional Comparison - North America

12.3.1 US - Market size and forecast 2025-2030

Chart on US - Market size and forecast 2025-2030 ($ million)
Data Table on US - Market size and forecast 2025-2030 ($ million)
Chart on US - Year-over-year growth 2025-2030 (%)
Data Table on US - Year-over-year growth 2025-2030 (%)

12.3.2 Canada - Market size and forecast 2025-2030

Chart on Canada - Market size and forecast 2025-2030 ($ million)
Data Table on Canada - Market size and forecast 2025-2030 ($ million)
Chart on Canada - Year-over-year growth 2025-2030 (%)
Data Table on Canada - Year-over-year growth 2025-2030 (%)

12.3.3 Mexico - Market size and forecast 2025-2030

Chart on Mexico - Market size and forecast 2025-2030 ($ million)
Data Table on Mexico - Market size and forecast 2025-2030 ($ million)
Chart on Mexico - Year-over-year growth 2025-2030 (%)
Data Table on Mexico - Year-over-year growth 2025-2030 (%)

12.4 Europe - Market size and forecast 2025-2030

Chart on Europe - Market size and forecast 2025-2030 ($ million)
Data Table on Europe - Market size and forecast 2025-2030 ($ million)
Chart on Europe - Year-over-year growth 2025-2030 (%)
Data Table on Europe - Year-over-year growth 2025-2030 (%)
Chart on Regional Comparison - Europe
Data Table on Regional Comparison - Europe

12.4.1 Germany - Market size and forecast 2025-2030

Chart on Germany - Market size and forecast 2025-2030 ($ million)
Data Table on Germany - Market size and forecast 2025-2030 ($ million)
Chart on Germany - Year-over-year growth 2025-2030 (%)
Data Table on Germany - Year-over-year growth 2025-2030 (%)

12.4.2 UK - Market size and forecast 2025-2030

Chart on UK - Market size and forecast 2025-2030 ($ million)
Data Table on UK - Market size and forecast 2025-2030 ($ million)
Chart on UK - Year-over-year growth 2025-2030 (%)
Data Table on UK - Year-over-year growth 2025-2030 (%)

12.4.3 France - Market size and forecast 2025-2030

Chart on France - Market size and forecast 2025-2030 ($ million)
Data Table on France - Market size and forecast 2025-2030 ($ million)
Chart on France - Year-over-year growth 2025-2030 (%)
Data Table on France - Year-over-year growth 2025-2030 (%)

12.4.4 Italy - Market size and forecast 2025-2030

Chart on Italy - Market size and forecast 2025-2030 ($ million)
Data Table on Italy - Market size and forecast 2025-2030 ($ million)
Chart on Italy - Year-over-year growth 2025-2030 (%)
Data Table on Italy - Year-over-year growth 2025-2030 (%)

12.4.5 Spain - Market size and forecast 2025-2030

Chart on Spain - Market size and forecast 2025-2030 ($ million)
Data Table on Spain - Market size and forecast 2025-2030 ($ million)
Chart on Spain - Year-over-year growth 2025-2030 (%)
Data Table on Spain - Year-over-year growth 2025-2030 (%)

12.4.6 The Netherlands - Market size and forecast 2025-2030

Chart on The Netherlands - Market size and forecast 2025-2030 ($ million)
Data Table on The Netherlands - Market size and forecast 2025-2030 ($ million)
Chart on The Netherlands - Year-over-year growth 2025-2030 (%)
Data Table on The Netherlands - Year-over-year growth 2025-2030 (%)

12.5 Asia - Market size and forecast 2025-2030

Chart on Asia - Market size and forecast 2025-2030 ($ million)
Data Table on Asia - Market size and forecast 2025-2030 ($ million)
Chart on Asia - Year-over-year growth 2025-2030 (%)
Data Table on Asia - Year-over-year growth 2025-2030 (%)
Chart on Regional Comparison - Asia
Data Table on Regional Comparison - Asia

12.5.1 China - Market size and forecast 2025-2030

Chart on China - Market size and forecast 2025-2030 ($ million)
Data Table on China - Market size and forecast 2025-2030 ($ million)
Chart on China - Year-over-year growth 2025-2030 (%)
Data Table on China - Year-over-year growth 2025-2030 (%)

12.5.2 Japan - Market size and forecast 2025-2030

Chart on Japan - Market size and forecast 2025-2030 ($ million)
Data Table on Japan - Market size and forecast 2025-2030 ($ million)
Chart on Japan - Year-over-year growth 2025-2030 (%)
Data Table on Japan - Year-over-year growth 2025-2030 (%)

12.5.3 India - Market size and forecast 2025-2030

Chart on India - Market size and forecast 2025-2030 ($ million)
Data Table on India - Market size and forecast 2025-2030 ($ million)
Chart on India - Year-over-year growth 2025-2030 (%)
Data Table on India - Year-over-year growth 2025-2030 (%)

12.5.4 South Korea - Market size and forecast 2025-2030

Chart on South Korea - Market size and forecast 2025-2030 ($ million)
Data Table on South Korea - Market size and forecast 2025-2030 ($ million)
Chart on South Korea - Year-over-year growth 2025-2030 (%)
Data Table on South Korea - Year-over-year growth 2025-2030 (%)

12.5.5 Indonesia - Market size and forecast 2025-2030

Chart on Indonesia - Market size and forecast 2025-2030 ($ million)
Data Table on Indonesia - Market size and forecast 2025-2030 ($ million)
Chart on Indonesia - Year-over-year growth 2025-2030 (%)
Data Table on Indonesia - Year-over-year growth 2025-2030 (%)

12.5.6 Singapore - Market size and forecast 2025-2030

Chart on Singapore - Market size and forecast 2025-2030 ($ million)
Data Table on Singapore - Market size and forecast 2025-2030 ($ million)
Chart on Singapore - Year-over-year growth 2025-2030 (%)
Data Table on Singapore - Year-over-year growth 2025-2030 (%)

12.6 Rest of World (ROW) - Market size and forecast 2025-2030

Chart on Rest of World (ROW) - Market size and forecast 2025-2030 ($ million)
Data Table on Rest of World (ROW) - Market size and forecast 2025-2030 ($ million)
Chart on Rest of World (ROW) - Year-over-year growth 2025-2030 (%)
Data Table on Rest of World (ROW) - Year-over-year growth 2025-2030 (%)
Chart on Regional Comparison - Rest of World (ROW)
Data Table on Regional Comparison - Rest of World (ROW)

12.6.1 Brazil - Market size and forecast 2025-2030

Chart on Brazil - Market size and forecast 2025-2030 ($ million)
Data Table on Brazil - Market size and forecast 2025-2030 ($ million)
Chart on Brazil - Year-over-year growth 2025-2030 (%)
Data Table on Brazil - Year-over-year growth 2025-2030 (%)

12.6.2 Saudi Arabia - Market size and forecast 2025-2030

Chart on Saudi Arabia - Market size and forecast 2025-2030 ($ million)
Data Table on Saudi Arabia - Market size and forecast 2025-2030 ($ million)
Chart on Saudi Arabia - Year-over-year growth 2025-2030 (%)
Data Table on Saudi Arabia - Year-over-year growth 2025-2030 (%)

12.6.3 South Africa - Market size and forecast 2025-2030

Chart on South Africa - Market size and forecast 2025-2030 ($ million)
Data Table on South Africa - Market size and forecast 2025-2030 ($ million)
Chart on South Africa - Year-over-year growth 2025-2030 (%)
Data Table on South Africa - Year-over-year growth 2025-2030 (%)

12.6.4 Argentina - Market size and forecast 2025-2030

Chart on Argentina - Market size and forecast 2025-2030 ($ million)
Data Table on Argentina - Market size and forecast 2025-2030 ($ million)
Chart on Argentina - Year-over-year growth 2025-2030 (%)
Data Table on Argentina - Year-over-year growth 2025-2030 (%)

12.6.5 UAE - Market size and forecast 2025-2030

Chart on UAE - Market size and forecast 2025-2030 ($ million)
Data Table on UAE - Market size and forecast 2025-2030 ($ million)
Chart on UAE - Year-over-year growth 2025-2030 (%)
Data Table on UAE - Year-over-year growth 2025-2030 (%)

12.6.6 Turkey - Market size and forecast 2025-2030

Chart on Turkey - Market size and forecast 2025-2030 ($ million)
Data Table on Turkey - Market size and forecast 2025-2030 ($ million)
Chart on Turkey - Year-over-year growth 2025-2030 (%)
Data Table on Turkey - Year-over-year growth 2025-2030 (%)

12.6.7 Egypt - Market size and forecast 2025-2030

Chart on Egypt - Market size and forecast 2025-2030 ($ million)
Data Table on Egypt - Market size and forecast 2025-2030 ($ million)
Chart on Egypt - Year-over-year growth 2025-2030 (%)
Data Table on Egypt - Year-over-year growth 2025-2030 (%)

12.6.8 Chile - Market size and forecast 2025-2030

Chart on Chile - Market size and forecast 2025-2030 ($ million)
Data Table on Chile - Market size and forecast 2025-2030 ($ million)
Chart on Chile - Year-over-year growth 2025-2030 (%)
Data Table on Chile - Year-over-year growth 2025-2030 (%)

12.7 Market opportunity by geography

Market opportunity by geography ($ million)
Data Tables on Market opportunity by geography ($ million)

13. Drivers, Challenges, and Opportunity

13.1 Market drivers

Increasing health consciousness and proactive wellness management
Aging global population and age specific nutritional needs
Product innovation and advent of personalized nutrition

13.2 Market challenges

Regulatory complexity and inconsistent standards
Consumer skepticism and preference for natural nutrient sources
Intense market competition and price sensitivity

13.3 Impact of drivers and challenges

Impact of drivers and challenges in 2025 and 2030

13.4 Market opportunities

Ascendancy of personalized nutrition
Innovation in delivery formats beyond traditional pills
Shift toward clean label and plant-based ingredients

14. Competitive Landscape

14.1 Overview

14.2

Overview on criticality of inputs and factors of differentiation

14.3 Landscape disruption

Overview on factors of disruption

14.4 Industry risks

Impact of key risks on business

15. Competitive Analysis

15.1 Companies profiled

Companies covered

15.2 Company ranking index

15.3 Market positioning of companies

Matrix on companies position and classification

15.4 Amway Corp.

Amway Corp. - Overview
Amway Corp. - Product / Service
Amway Corp. - Key offerings
SWOT

15.5 Bayer AG

Bayer AG - Overview
Bayer AG - Business segments
Bayer AG - Key news
Bayer AG - Key offerings
Bayer AG - Segment focus
SWOT

15.6 Blackmores Ltd.

Blackmores Ltd. - Overview
Blackmores Ltd. - Product / Service
Blackmores Ltd. - Key offerings
SWOT

15.7 Church and Dwight Co. Inc.

Church and Dwight Co. Inc. - Overview
Church and Dwight Co. Inc. - Business segments
Church and Dwight Co. Inc. - Key offerings
Church and Dwight Co. Inc. - Segment focus
SWOT

15.8 GNC Holdings LLC

GNC Holdings LLC - Overview
GNC Holdings LLC - Product / Service
GNC Holdings LLC - Key offerings
SWOT

15.9 Haleon Plc

Haleon Plc - Overview
Haleon Plc - Business segments
Haleon Plc - Key offerings
Haleon Plc - Segment focus
SWOT

15.10 Health and Happiness International

Health and Happiness International - Overview
Health and Happiness International - Business segments
Health and Happiness International - Key offerings
Health and Happiness International - Segment focus
SWOT

15.11 Herbalife International Inc.

Herbalife International Inc. - Overview
Herbalife International Inc. - Product / Service
Herbalife International Inc. - Key offerings
SWOT

15.12 Life Extension

Life Extension - Overview
Life Extension - Product / Service
Life Extension - Key offerings
SWOT

15.13 Metagenics LLC

Metagenics LLC - Overview
Metagenics LLC - Product / Service
Metagenics LLC - Key offerings
SWOT

15.14 Natures Sunshine Products Inc.

Natures Sunshine Products Inc. - Overview
Natures Sunshine Products Inc. - Business segments
Natures Sunshine Products Inc. - Key offerings
Natures Sunshine Products Inc. - Segment focus
SWOT

15.15 NOW Health Group Inc.

NOW Health Group Inc. - Overview
NOW Health Group Inc. - Product / Service
NOW Health Group Inc. - Key offerings
SWOT

15.16 Orthomol pharmazeutische GmbH

Orthomol pharmazeutische GmbH - Overview
Orthomol pharmazeutische GmbH - Product / Service
Orthomol pharmazeutische GmbH - Key offerings
SWOT

15.17 Pharmavite LLC

Pharmavite LLC - Overview
Pharmavite LLC - Product / Service
Pharmavite LLC - Key offerings
SWOT

15.18 USANA Health Science Inc.

USANA Health Science Inc. - Overview
USANA Health Science Inc. - Product / Service
USANA Health Science Inc. - Key offerings
SWOT

16. Appendix

16.1 Scope of the report

Market definition
Objectives
Notes and caveats

16.2 Inclusions and exclusions checklist

Inclusions checklist
Exclusions checklist

16.3 Currency conversion rates for US$

16.4 Research methodology

16.5 Data procurement

Information sources

16.6 Data validation

16.7 Validation techniques employed for market sizing

16.8 Data synthesis

16.9 360 degree market analysis

16.10 List of abbreviations

Research Methodology

Technavio presents a detailed picture of the market by way of study, synthesis, and summation of data from multiple sources. The analysts have presented the various facets of the market with a particular focus on identifying the key industry influencers. The data thus presented is comprehensive, reliable, and the result of extensive research, both primary and secondary.

INFORMATION SOURCES

Primary sources

  • Manufacturers and suppliers
  • Channel partners
  • Industry experts
  • Strategic decision makers

Secondary sources

  • Industry journals and periodicals
  • Government data
  • Financial reports of key industry players
  • Historical data
  • Press releases

DATA ANALYSIS

Data Synthesis

  • Collation of data
  • Estimation of key figures
  • Analysis of derived insights

Data Validation

  • Triangulation with data models
  • Reference against proprietary databases
  • Corroboration with industry experts

REPORT WRITING

Qualitative

  • Market drivers
  • Market challenges
  • Market trends
  • Five forces analysis

Quantitative

  • Market size and forecast
  • Market segmentation
  • Geographical insights
  • Competitive landscape

Interested in this report?

Get your sample now to see our research methodology and insights!

Download Now

Frequently Asked Questions

Multivitamin And Mineral Supplements market growth will increase by USD 3471.2 million during 2026-2030.

The Multivitamin And Mineral Supplements market is expected to grow at a CAGR of 4.8% during 2026-2030.

Multivitamin And Mineral Supplements market is segmented by Application (Eye health supplements, Bone and joint supplements, Heart health supplements, Others) Form factor (Tablets, Capsules, Powders, Others) Distribution channel (Pharmacies, Supermarkets and hypermarkets, Online stores, Specialty stores)

Advanced Orthomolecular, Amway Corp., Bayer AG, Blackmores Ltd., Church and Dwight Co. Inc., GNC Holdings LLC, Haleon Plc, Health and Happiness International, Herbalife International Inc., Life Extension, Metagenics LLC, Natures Sunshine Products Inc., NOW Health Group Inc., Orthomol pharmazeutische GmbH, Pharmavite LLC, Queisser Pharma GmbH and Co. KG, Solgar Inc., Thorne HealthTech Inc., USANA Health Science Inc., Vitabiotics Ltd. are a few of the key vendors in the Multivitamin And Mineral Supplements market.

North America will register the highest growth rate of 44% among the other regions. Therefore, the Multivitamin And Mineral Supplements market in North America is expected to garner significant business opportunities for the vendors during the forecast period.

US, Canada, Mexico, Germany, UK, France, Italy, Spain, The Netherlands, China, Japan, India, South Korea, Indonesia, Singapore, Brazil, Saudi Arabia, South Africa, Argentina, UAE, Turkey, Egypt, Chile

  • Increasing health consciousness and proactive wellness management is the driving factor this market.

The Multivitamin And Mineral Supplements market vendors should focus on grabbing business opportunities from the Application segment as it accounted for the largest market share in the base year.
RIA - Research AI Assistant
Ask RIA
