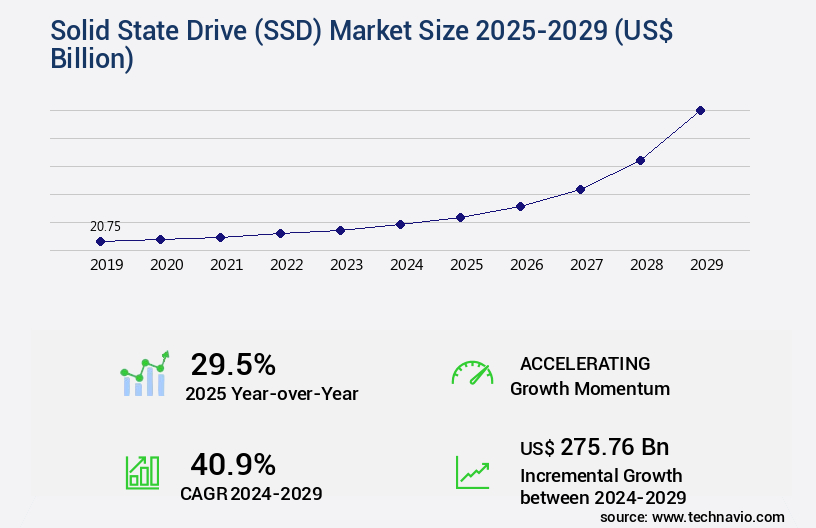
Solid State Drive (SSD) Market Size 2025-2029
The solid state drive (ssd) market size is valued to increase USD 275.76 billion, at a CAGR of 40.9% from 2024 to 2029. Enhanced performance and durability will drive the solid state drive (ssd) market.
Major Market Trends & Insights
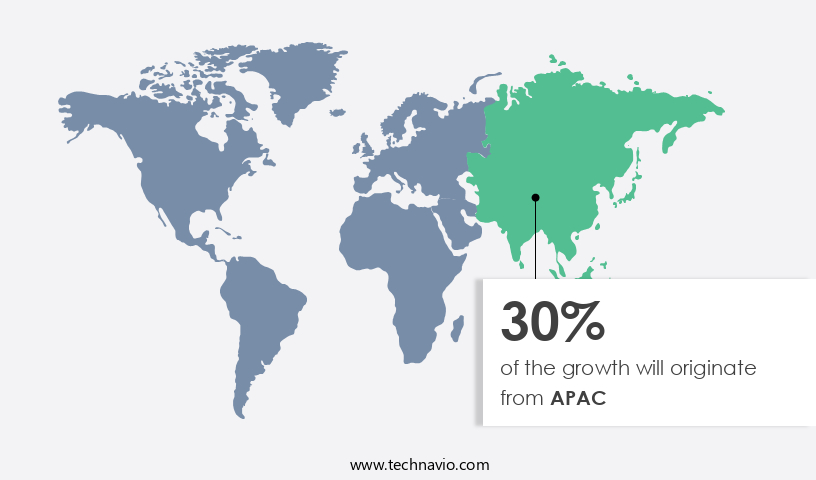
- APAC dominated the market and accounted for a 30% growth during the forecast period.
- By Type - TLC segment was valued at USD 7.93 billion in 2023
- By End-user - Laptops segment accounted for the largest market revenue share in 2023
Market Size & Forecast
- Market Opportunities: USD 1.00 billion
- Market Future Opportunities: USD 275.76 billion
- CAGR from 2024 to 2029 : 40.9%
Market Summary
- The market represents a dynamic and evolving sector in the technology industry, driven by advancements in core technologies and applications. SSDs, which offer enhanced performance and durability compared to traditional Hard Disk Drives (HDDs), have gained significant market traction. According to recent reports, SSDs accounted for over 30% of the total global hard drive market share in 2020, with this figure projected to grow further. Key drivers for the SSD Market include the emergence of portable SSDs, which cater to the increasing demand for data storage solutions that are compact, lightweight, and offer fast data transfer rates.
- Additionally, the poor latency and endurance of HDDs have made SSDs an attractive alternative for businesses and consumers alike. However, challenges such as high production costs and limited production capacity pose obstacles to market growth. Despite these challenges, opportunities abound, particularly in the data center and enterprise sectors, where the need for high-performance storage solutions is paramount.
What will be the Size of the Solid State Drive (SSD) Market during the forecast period?

Get Key Insights on Market Forecast (PDF) Request Free Sample
How is the Solid State Drive (SSD) Market Segmented ?
The solid state drive (ssd) industry research report provides comprehensive data (region-wise segment analysis), with forecasts and estimates in "USD billion" for the period 2025-2029, as well as historical data from 2019-2023 for the following segments.
- Type
- End-user
- Form Factor
- 2.5 Inch
- M.2
- U.2
- AIC (Add-in Card)
- Storage Capacity
- Under 250 GB
- 250 GB - 500 GB
- 500 GB - 1 TB
- 1 TB - 2 TB
- Above 2 TB
- Geography
- North America
- Europe
- Middle East and Africa
- APAC
- South America
- Rest of World (ROW)
By Type Insights
The tlc segment is estimated to witness significant growth during the forecast period.
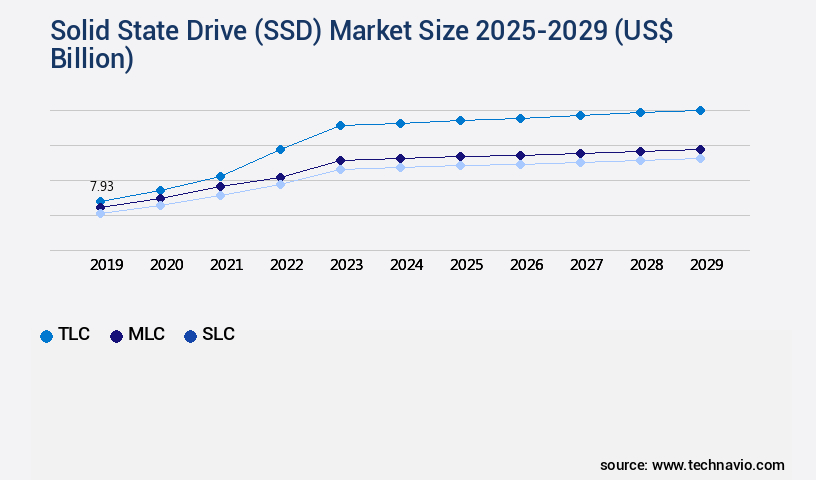
The market continues to evolve, with ongoing advancements in technology driving improvements in performance and capacity. TLC NAND flash, the most affordable form of NAND, is an emerging segment with high potential due to its high storage density and low cost. However, it only stores three bits per cell, requiring more error correction codes and resulting in shorter read/write life cycles compared to SLC and MLC. This makes TLC ideal for consumer applications with lower write requirements, such as memory cards. SSDs come in various form factors, including 2.5-inch and M.2, and interface standards like SATA, NVMe, and PCIe.
Firmware updates and power management features, such as read amplification and garbage collection, help optimize performance and extend SSD lifespan. With advancements in cell technology, SSDs offer increased storage capacity, faster latency performance, and higher data transfer rates. Despite these advancements, power consumption and thermal throttling remain considerations, as does data encryption and data integrity. Overall, SSDs offer significant benefits over traditional hard drives, including faster read/write speeds, improved power efficiency, and enhanced reliability.

Request Free Sample
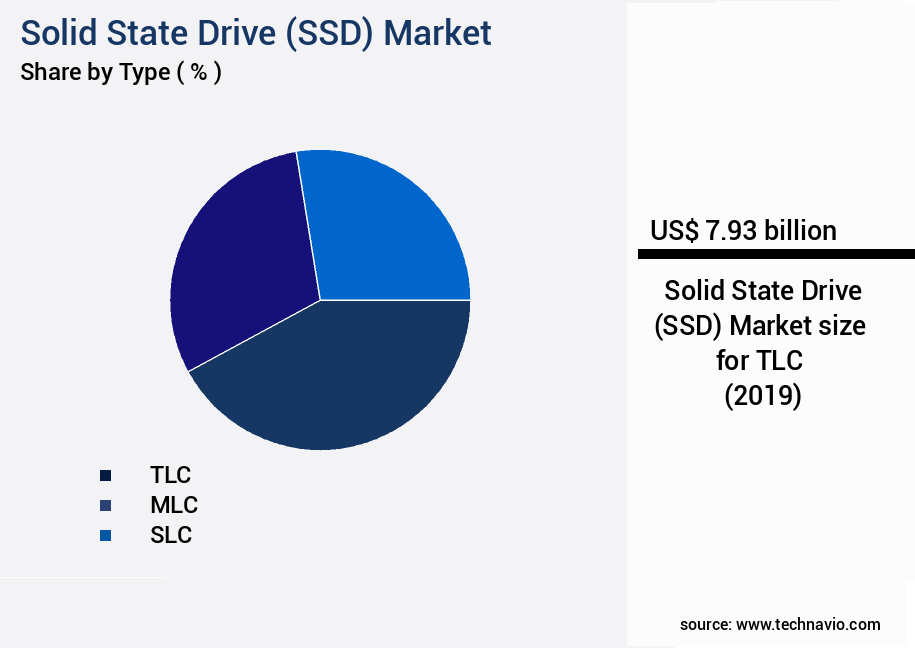
The TLC segment was valued at USD 7.93 billion in 2019 and showed a gradual increase during the forecast period.

Request Free Sample
Regional Analysis
APAC is estimated to contribute 30% to the growth of the global market during the forecast period.Technavio’s analysts have elaborately explained the regional trends and drivers that shape the market during the forecast period.

See How Solid State Drive (SSD) Market Demand is Rising in APAC Request Free Sample
The market in APAC is experiencing significant growth, driven by the expanding use of SSDs in data centers and enterprises. South Korea and Japan are leading contributors to this burgeoning market. During the forecast period, Taiwan, China, and India are anticipated to emerge as substantial contributors to the SSD market in APAC. Government initiatives, such as the National Policy on Electronics (NPE 2019) in India, aim to expand the electronic industry, creating clusters for the entire value chain and employing over 10 million people, contributing to the industry's growth.
The APAC SSD market's expansion is a testament to the region's commitment to technological advancement and digital transformation.
Market Dynamics
Our researchers analyzed the data with 2024 as the base year, along with the key drivers, trends, and challenges. A holistic analysis of drivers will help companies refine their marketing strategies to gain a competitive advantage.
The market is witnessing significant growth due to the increasing demand for high-performance storage solutions in various industries. NAND flash memory, the primary technology behind SSDs, is available in multiple cell types, including Multi-Level Cell (MLC), Triple-Level Cell (TLC), and Quad-Level Cell (QLC), each offering different performance and cost trade-offs. SSDs come with various interfaces, such as Serial Advanced Technology Attachment (SATA) and Non-Volatile Memory Express (NVMe), with NVMe offering faster data transfer rates and lower latency. SSD controller architecture designs play a crucial role in determining the overall performance of these drives. Write amplification, a common issue in SSDs, significantly impacts their lifespan.
Data encryption techniques, such as AES and XOR, are increasingly being adopted to enhance data security in SSDs. Trim and other optimizations help improve SSD performance by managing unused space and reducing write amplification. Managing thermal throttling and power consumption are essential considerations for SSDs, with thermal throttling limiting performance when temperatures exceed safe levels. SSDs employ wear leveling techniques, firmware updates, and data recovery methods to ensure data integrity and reliability. High-performance SSD configurations, such as RAID and JBOD, are popular choices for systems requiring large storage capacities and high data transfer rates. Choosing the right SSD for specific system needs involves considering factors like interface compatibility, capacity, performance, and cost.
SSD failure prediction and prevention techniques, including self-monitoring, analysis, and reporting technology (SMART), are gaining importance to minimize downtime and data loss. M.2 and 2.5-inch SSDs cater to different form factor requirements, with M.2 offering smaller dimensions and 2.5-inch drives providing larger capacities. Advanced SSD data compression methods, such as lossless and lossless-compressible data compression, help optimize storage capacity and improve overall system performance. Understanding SSD garbage collection and over-provisioning strategies is crucial for maximizing the lifespan and efficiency of these drives. Despite the growing competition, a few players dominate the high-end SSD market, accounting for over 40% of the market share.
Market information suggests that the industrial sector is adopting SSDs at a significantly faster pace than the academic sector, with adoption rates nearly doubling in the former.

What are the key market drivers leading to the rise in the adoption of Solid State Drive (SSD) Industry?
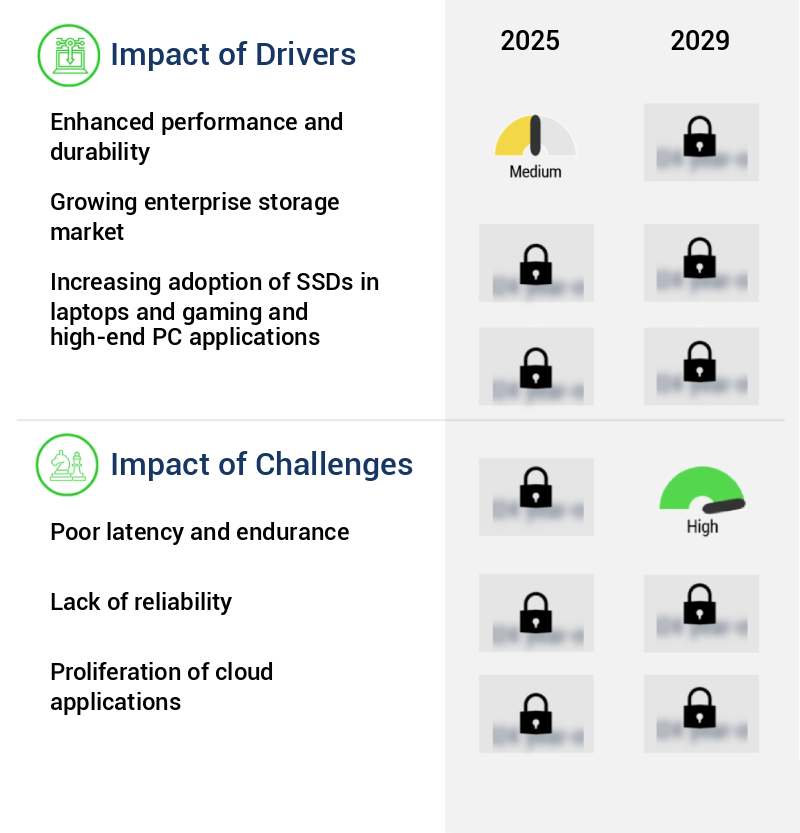
- The market's growth is driven primarily by enhanced performance and durability, making it a compelling choice for consumers seeking reliable and efficient solutions.
- Solid-state drives (SSDs) and hard disk drives (HDDs) are two primary storage technologies that cater to varying data access requirements. SSDs, devoid of moving parts, ensure data stability even in turbulent conditions. In contrast, HDDs rely on physical scanning for reads and writes, making them susceptible to performance issues in high-intensity environments. SSDs' architecture, without physical tracks or sectors, grants swift access to memory addresses.
- This attribute is particularly advantageous in Tier 0 and Tier 1 databases and caching technologies. The absence of mechanical components in SSDs significantly expedites input/output (I/O) requests, providing a notable edge over HDDs. By eliminating the need for physical seek limits, SSDs cater to the increasing demand for high-speed data access in modern businesses.
What are the market trends shaping the Solid State Drive (SSD) Industry?
- Portable solid-state drives (SSDs) represent the latest market trend, gaining increasing popularity due to their compact size and high-speed data transfer capabilities.
- Portable Solid State Drives (SSDs) have significantly transformed the data storage landscape, providing a multitude of advantages over conventional Hard Disk Drives (HDDs). One of the most notable benefits is their enhanced speed. SSDs process data much quicker than HDDs, resulting in reduced time for file transfers and system initialization. This is primarily due to the absence of moving parts in SSDs, which eliminates the latency associated with HDDs. Moreover, the durability of portable SSDs is another significant advantage. Their solid-state design renders them less susceptible to physical damage from drops or shocks, ensuring data security. Furthermore, their compact size and lightweight construction make them highly portable, enabling users to transport large volumes of data effortlessly.
- Recent innovations in portable SSD technology include the Samsung T9, released in October 2023, which boasts a USB 3.2 Gen 2 interface, offering impressive data transfer speeds. These advancements underscore the continuous evolution of portable SSDs and their expanding applications across various sectors.
What challenges does the Solid State Drive (SSD) Industry face during its growth?
- The issue of poor latency and endurance poses a significant challenge to the industry's growth, as these factors negatively impact performance and efficiency.
- The inconsistent performance of Input/Output (I/O) operations in storage systems remains a significant challenge for businesses. While write latency can be masked with write-back caching, read latency cannot be hidden. SSD latencies typically range from a few hundred microseconds to several milliseconds, but can exceed seconds when access is disrupted by internal tasks. The unpredictability of IO performance is further compounded by the lack of coordination across an array of devices. Endurance is another hurdle, as SSDs have fewer write cycles than hard disks. These challenges necessitate ongoing research and innovation to improve I/O performance and reliability.
- For instance, advancements in flash memory technology, such as 3D NAND and QLC, aim to enhance endurance and reduce latency. Additionally, the integration of AI and machine learning algorithms in storage systems is expected to optimize I/O operations and improve overall system performance. These evolving trends underscore the importance of addressing I/O challenges in an increasingly data-driven business landscape.
Exclusive Technavio Analysis on Customer Landscape
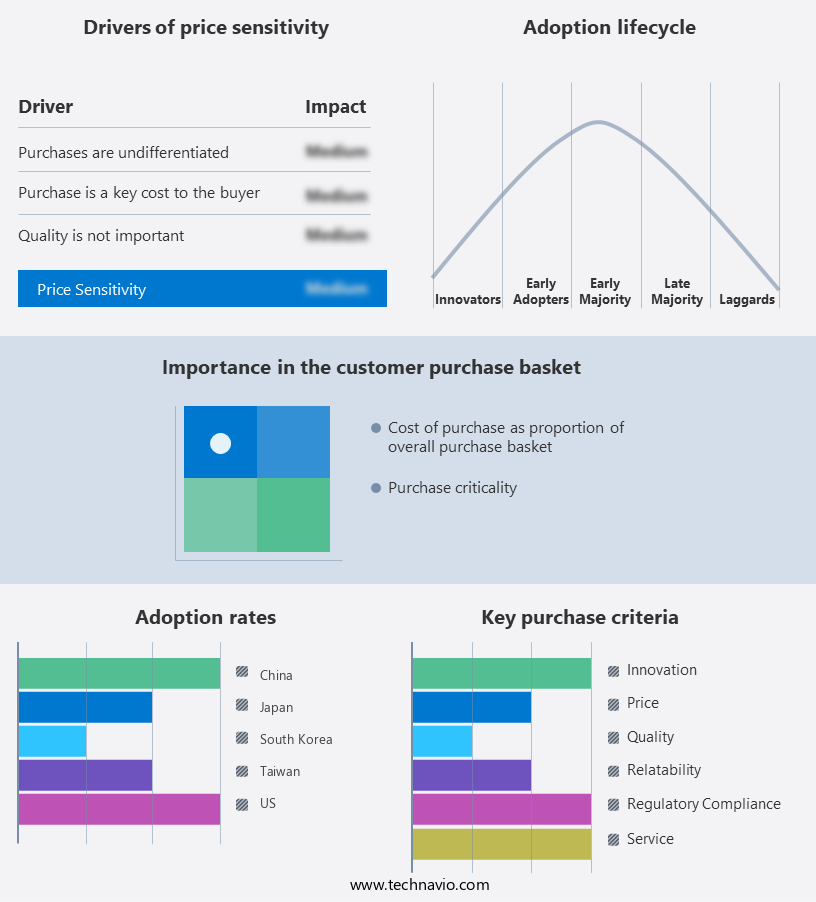
The solid state drive (ssd) market forecasting report includes the adoption lifecycle of the market, covering from the innovator’s stage to the laggard’s stage. It focuses on adoption rates in different regions based on penetration. Furthermore, the solid state drive (ssd) market report also includes key purchase criteria and drivers of price sensitivity to help companies evaluate and develop their market growth analysis strategies.

Customer Landscape of Solid State Drive (SSD) Industry
Competitive Landscape
Companies are implementing various strategies, such as strategic alliances, solid state drive (ssd) market forecast, partnerships, mergers and acquisitions, geographical expansion, and product/service launches, to enhance their presence in the industry.
ADATA Technology Co. Ltd. - The company specializes in manufacturing solid state drives, including the Legend 800 gold, Legend 700 gold, and Legend 850 Lite models. These drives offer reliable storage solutions with advanced technology and high performance, making them a top choice for consumers seeking efficient data management.
The industry research and growth report includes detailed analyses of the competitive landscape of the market and information about key companies, including:
- ADATA Technology Co. Ltd.
- Corsair Gaming Inc.
- DataDirect Networks Inc.
- International Business Machines Corp.
- Kingston Technology Co. Inc.
- Kioxia Corp.
- LITE ON Technology Corp.
- Maxta Inc.
- Micron Technology Inc.
- NetApp Inc.
- Pure Storage Inc.
- Samsung Electronics Co. Ltd.
- Sandisk Corp.
- Seagate Technology LLC
- Simms International plc
- SK hynix Co. Ltd.
- Solidigm
- Sony Group Corp.
- Toshiba Corp.
- Transcend Information Inc.
Qualitative and quantitative analysis of companies has been conducted to help clients understand the wider business environment as well as the strengths and weaknesses of key industry players. Data is qualitatively analyzed to categorize companies as pure play, category-focused, industry-focused, and diversified; it is quantitatively analyzed to categorize companies as dominant, leading, strong, tentative, and weak.
Recent Development and News in Solid State Drive (SSD) Market
- In January 2024, Intel Corporation announced the launch of its new 700p Series SSD, featuring PCIe 4.0 technology and up to 1TB capacity (Intel press release). This release marked Intel's entry into the high-performance SSD market, intensifying competition with industry leaders like Samsung and Micron.
- In March 2024, Western Digital Corporation and Kioxia Corporation, two major SSD manufacturers, announced a strategic partnership to co-develop next-generation SSD solutions (Western Digital press release). This collaboration aimed to combine Western Digital's expertise in HDDs and Kioxia's strength in flash memory technology, potentially leading to innovative SSD products and improved market competitiveness.
- In April 2025, Seagate Technology completed the acquisition of Samsung's SSD business for approximately USD1.37 billion (Bloomberg). This acquisition significantly expanded Seagate's SSD portfolio and market share, making it a formidable competitor in the SSD market.
- In May 2025, Samsung Electronics unveiled its 16TB SSD, the world's largest capacity SSD for data centers (Samsung press release). This technological advancement demonstrated Samsung's commitment to pushing the boundaries of SSD capacity, potentially revolutionizing data center storage solutions.
Dive into Technavio’s robust research methodology, blending expert interviews, extensive data synthesis, and validated models for unparalleled Solid State Drive (SSD) Market insights. See full methodology.
Market Scope
|
Report Coverage
|
Details
|
Page number
|
199
|
Base year
|
2024
|
Historic period
|
2019-2023 |
Forecast period
|
2025-2029
|
Growth momentum & CAGR
|
Accelerate at a CAGR of 40.9%
|
Market growth 2025-2029
|
USD 275.76 billion
|
Market structure
|
Fragmented
|
YoY growth 2024-2025(%)
|
29.5
|
Key countries
|
US, Canada, Germany, UK, Italy, France, China, India, Japan, Brazil, Egypt, UAE, Oman, Argentina, KSA, UAE, Brazil, and Rest of World (ROW)
|
Competitive landscape
|
Leading Companies, Market Positioning of Companies, Competitive Strategies, and Industry Risks
|
Request Free Sample
Research Analyst Overview
- The market continues to evolve, with key trends shaping its dynamics. One significant development is the increasing focus on drive endurance, as manufacturers strive to enhance read/write speeds and extend SSD lifespan. Host interfaces, such as M.2 and NVMe, are gaining popularity due to their faster data transfer rates. Firmware updates play a crucial role in optimizing SSD performance, with improvements in read amplification and power management contributing to enhanced controller performance. The 2.5-inch form factor remains common, but the M.2 form factor's compact size and NVMe interface's high bandwidth are driving adoption. Power consumption is another critical factor, with SSDs increasingly offering energy efficiency.
- Data encryption is also a priority, with interface standards like PCIe and SATA supporting encryption to ensure data integrity. SSDs employ various technologies, including NAND flash memory, error correction codes, and wear leveling, to improve latency performance and data transfer rates. Thermal throttling and data retention are ongoing challenges, with manufacturers addressing these issues through advanced cooling systems and improved firmware. The SSD market's continuous evolution is driven by the pursuit of higher storage capacity, improved cell technology, and advanced interface standards. As the market adapts to these trends, SSDs are becoming an essential component of modern computing systems, offering significant performance advantages over traditional hard disk drives.
What are the Key Data Covered in this Solid State Drive (SSD) Market Research and Growth Report?
-
What is the expected growth of the Solid State Drive (SSD) Market between 2025 and 2029?
-
What segmentation does the market report cover?
-
The report is segmented by Type (TLC, MLC, and SLC), End-user (Laptops and PCs), Geography (APAC, North America, Europe, South America, and Middle East and Africa), Form Factor (2.5 Inch, M.2, U.2, and AIC (Add-in Card)), and Storage Capacity (Under 250 GB, 250 GB - 500 GB, 500 GB - 1 TB, 1 TB - 2 TB, and Above 2 TB)
-
Which regions are analyzed in the report?
-
APAC, North America, Europe, South America, and Middle East and Africa
-
What are the key growth drivers and market challenges?
-
Who are the major players in the Solid State Drive (SSD) Market?
-
ADATA Technology Co. Ltd., Corsair Gaming Inc., DataDirect Networks Inc., International Business Machines Corp., Kingston Technology Co. Inc., Kioxia Corp., LITE ON Technology Corp., Maxta Inc., Micron Technology Inc., NetApp Inc., Pure Storage Inc., Samsung Electronics Co. Ltd., Sandisk Corp., Seagate Technology LLC, Simms International plc, SK hynix Co. Ltd., Solidigm, Sony Group Corp., Toshiba Corp., and Transcend Information Inc.
Market Research Insights
- The market continues to evolve, with advancements in technology driving increased adoption. SSDs utilize memory chips instead of traditional spinning disks, resulting in faster read and write speeds and improved power efficiency. According to industry estimates, the global SSD market size is projected to reach USD126.8 billion by 2027, growing at a CAGR of 21.3% from 2020. One key factor contributing to this growth is the ongoing development of wear-leveling algorithms, which enhance SSD endurance and extend drive reliability. For instance, SSDs with advanced error correction and data security features, such as those using NVMe protocol, offer superior performance and data protection compared to their SATA counterparts.
- Additionally, the emergence of form factors like PCIe and M.2, along with RAID configurations and data migration tools, provide flexible storage solutions for businesses and consumers alike. Despite these advancements, challenges remain. Power efficiency and interface compatibility are crucial considerations for organizations seeking to optimize system performance. Furthermore, data storage solutions must also address data recovery, data compression, data deduplication, and data virtualization to meet the evolving demands of modern businesses. Ultimately, the SSD market will continue to innovate, driven by the need for faster, more efficient, and more secure data storage solutions.
We can help! Our analysts can customize this solid state drive (ssd) market research report to meet your requirements.
Get in touch
1 Executive Summary
- 1.1 Market overview
- Executive Summary - Chart on Market Overview
- Executive Summary - Data Table on Market Overview
- Executive Summary - Chart on Global Market Characteristics
- Executive Summary - Chart on Market by Geography
- Executive Summary - Chart on Market Segmentation by Type
- Executive Summary - Chart on Market Segmentation by End-user
- Executive Summary - Chart on Incremental Growth
- Executive Summary - Data Table on Incremental Growth
- Executive Summary - Chart on Company Market Positioning
2 Technavio Analysis
- 2.1 Analysis of price sensitivity, lifecycle, customer purchase basket, adoption rates, and purchase criteria
- Analysis of price sensitivity, lifecycle, customer purchase basket, adoption rates, and purchase criteria
- 2.2 Criticality of inputs and Factors of differentiation
- Overview on criticality of inputs and factors of differentiation
- 2.3 Factors of disruption
- Overview on factors of disruption
- 2.4 Impact of drivers and challenges
- Impact of drivers and challenges in 2024 and 2029
3 Market Landscape
- 3.1 Market ecosystem
- Parent Market
- Data Table on - Parent Market
- 3.2 Market characteristics
- Market characteristics analysis
4 Market Sizing
- 4.1 Market definition
- Offerings of companies included in the market definition
- 4.2 Market segment analysis
- 4.4 Market outlook: Forecast for 2024-2029
- Chart on Global - Market size and forecast 2024-2029 ($ million)
- Data Table on Global - Market size and forecast 2024-2029 ($ million)
- Chart on Global Market: Year-over-year growth 2024-2029 (%)
- Data Table on Global Market: Year-over-year growth 2024-2029 (%)
5 Historic Market Size
- 5.1 Global Solid State Drive (SSD) Market 2019 - 2023
- Historic Market Size - Data Table on Global Solid State Drive (SSD) Market 2019 - 2023 ($ million)
- 5.2 Type segment analysis 2019 - 2023
- Historic Market Size - Type Segment 2019 - 2023 ($ million)
- 5.3 End-user segment analysis 2019 - 2023
- Historic Market Size - End-user Segment 2019 - 2023 ($ million)
- 5.4 Geography segment analysis 2019 - 2023
- Historic Market Size - Geography Segment 2019 - 2023 ($ million)
- 5.5 Country segment analysis 2019 - 2023
- Historic Market Size - Country Segment 2019 - 2023 ($ million)
6 Qualitative Analysis
- 6.1 The AI impact on Global Solid State Drive (SSD) Market
7 Five Forces Analysis
- 7.1 Five forces summary
- Five forces analysis - Comparison between 2024 and 2029
- 7.2 Bargaining power of buyers
- Bargaining power of buyers - Impact of key factors 2024 and 2029
- 7.3 Bargaining power of suppliers
- Bargaining power of suppliers - Impact of key factors in 2024 and 2029
- 7.4 Threat of new entrants
- Threat of new entrants - Impact of key factors in 2024 and 2029
- 7.5 Threat of substitutes
- Threat of substitutes - Impact of key factors in 2024 and 2029
- 7.6 Threat of rivalry
- Threat of rivalry - Impact of key factors in 2024 and 2029
- 7.7 Market condition
- Chart on Market condition - Five forces 2024 and 2029
8 Market Segmentation by Type
- 8.1 Market segments
- Chart on Type - Market share (2024-2029) (%)
- Data Table on Type - Market share (2024-2029) (%)
- 8.2 Comparison by Type
- Chart on Comparison by Type
- Data Table on Comparison by Type
- 8.3 TLC - Market size and forecast (2024-2029)
- Chart on TLC - Market size and forecast (2024-2029) ($ million)
- Data Table on TLC - Market size and forecast (2024-2029) ($ million)
- Chart on TLC - Year-over-year growth (2024-2029) (%)
- Data Table on TLC - Year-over-year growth (2024-2029) (%)
- 8.4 MLC - Market size and forecast (2024-2029)
- Chart on MLC - Market size and forecast (2024-2029) ($ million)
- Data Table on MLC - Market size and forecast (2024-2029) ($ million)
- Chart on MLC - Year-over-year growth (2024-2029) (%)
- Data Table on MLC - Year-over-year growth (2024-2029) (%)
- 8.5 SLC - Market size and forecast (2024-2029)
- Chart on SLC - Market size and forecast (2024-2029) ($ million)
- Data Table on SLC - Market size and forecast (2024-2029) ($ million)
- Chart on SLC - Year-over-year growth (2024-2029) (%)
- Data Table on SLC - Year-over-year growth (2024-2029) (%)
- 8.6 Market opportunity by Type
- Market opportunity by Type ($ million)
- Data Table on Market opportunity by Type ($ million)
9 Market Segmentation by End-user
- 9.1 Market segments
- Chart on End-user - Market share (2024-2029) (%)
- Data Table on End-user - Market share (2024-2029) (%)
- 9.2 Comparison by End-user
- Chart on Comparison by End-user
- Data Table on Comparison by End-user
- 9.3 Laptops - Market size and forecast (2024-2029)
- Chart on Laptops - Market size and forecast (2024-2029) ($ million)
- Data Table on Laptops - Market size and forecast (2024-2029) ($ million)
- Chart on Laptops - Year-over-year growth (2024-2029) (%)
- Data Table on Laptops - Year-over-year growth (2024-2029) (%)
- 9.4 PCs - Market size and forecast (2024-2029)
- Chart on PCs - Market size and forecast (2024-2029) ($ million)
- Data Table on PCs - Market size and forecast (2024-2029) ($ million)
- Chart on PCs - Year-over-year growth (2024-2029) (%)
- Data Table on PCs - Year-over-year growth (2024-2029) (%)
- 9.5 Market opportunity by End-user
- Market opportunity by End-user ($ million)
- Data Table on Market opportunity by End-user ($ million)
10 Market Segmentation by Form Factor
- 10.1 Market segments
- Chart on Form Factor - Market share (2024-2029) (%)
- Data Table on Form Factor - Market share (2024-2029) (%)
- 10.2 Comparison by Form Factor
- Chart on Comparison by Form Factor
- Data Table on Comparison by Form Factor
- 2.5 Inch - Market size and forecast (2024-2029)
- Chart on 2.5 Inch - Market size and forecast (2024-2029) ($ million)
- Data Table on 2.5 Inch - Market size and forecast (2024-2029) ($ million)
- Chart on 2.5 Inch - Year-over-year growth (2024-2029) (%)
- Data Table on 2.5 Inch - Year-over-year growth (2024-2029) (%)
- 10.4 M.2 - Market size and forecast (2024-2029)
- Chart on M.2 - Market size and forecast (2024-2029) ($ million)
- Data Table on M.2 - Market size and forecast (2024-2029) ($ million)
- Chart on M.2 - Year-over-year growth (2024-2029) (%)
- Data Table on M.2 - Year-over-year growth (2024-2029) (%)
- 10.5 U.2 - Market size and forecast (2024-2029)
- Chart on U.2 - Market size and forecast (2024-2029) ($ million)
- Data Table on U.2 - Market size and forecast (2024-2029) ($ million)
- Chart on U.2 - Year-over-year growth (2024-2029) (%)
- Data Table on U.2 - Year-over-year growth (2024-2029) (%)
- 10.6 AIC (Add-in Card) - Market size and forecast (2024-2029)
- Chart on AIC (Add-in Card) - Market size and forecast (2024-2029) ($ million)
- Data Table on AIC (Add-in Card) - Market size and forecast (2024-2029) ($ million)
- Chart on AIC (Add-in Card) - Year-over-year growth (2024-2029) (%)
- Data Table on AIC (Add-in Card) - Year-over-year growth (2024-2029) (%)
- 10.7 Market opportunity by Form Factor
- Market opportunity by Form Factor ($ million)
- Data Table on Market opportunity by Form Factor ($ million)
11 Market Segmentation by Storage Capacity
- 11.1 Market segments
- Chart on Storage Capacity - Market share (2024-2029) (%)
- Data Table on Storage Capacity - Market share (2024-2029) (%)
- 11.2 Comparison by Storage Capacity
- Chart on Comparison by Storage Capacity
- Data Table on Comparison by Storage Capacity
- 11.3 Under 250 GB - Market size and forecast (2024-2029)
- Chart on Under 250 GB - Market size and forecast (2024-2029) ($ million)
- Data Table on Under 250 GB - Market size and forecast (2024-2029) ($ million)
- Chart on Under 250 GB - Year-over-year growth (2024-2029) (%)
- Data Table on Under 250 GB - Year-over-year growth (2024-2029) (%)
- 250 GB - 500 GB - Market size and forecast (2024-2029)
- Chart on 250 GB - 500 GB - Market size and forecast (2024-2029) ($ million)
- Data Table on 250 GB - 500 GB - Market size and forecast (2024-2029) ($ million)
- Chart on 250 GB - 500 GB - Year-over-year growth (2024-2029) (%)
- Data Table on 250 GB - 500 GB - Year-over-year growth (2024-2029) (%)
- 500 GB - 1 TB - Market size and forecast (2024-2029)
- Chart on 500 GB - 1 TB - Market size and forecast (2024-2029) ($ million)
- Data Table on 500 GB - 1 TB - Market size and forecast (2024-2029) ($ million)
- Chart on 500 GB - 1 TB - Year-over-year growth (2024-2029) (%)
- Data Table on 500 GB - 1 TB - Year-over-year growth (2024-2029) (%)
- 1 TB - 2 TB - Market size and forecast (2024-2029)
- Chart on 1 TB - 2 TB - Market size and forecast (2024-2029) ($ million)
- Data Table on 1 TB - 2 TB - Market size and forecast (2024-2029) ($ million)
- Chart on 1 TB - 2 TB - Year-over-year growth (2024-2029) (%)
- Data Table on 1 TB - 2 TB - Year-over-year growth (2024-2029) (%)
- 11.7 Above 2 TB - Market size and forecast (2024-2029)
- Chart on Above 2 TB - Market size and forecast (2024-2029) ($ million)
- Data Table on Above 2 TB - Market size and forecast (2024-2029) ($ million)
- Chart on Above 2 TB - Year-over-year growth (2024-2029) (%)
- Data Table on Above 2 TB - Year-over-year growth (2024-2029) (%)
- 11.8 Market opportunity by Storage Capacity
- Market opportunity by Storage Capacity ($ million)
- Data Table on Market opportunity by Storage Capacity ($ million)
12 Customer Landscape
- 12.1 Customer landscape overview
- Analysis of price sensitivity, lifecycle, customer purchase basket, adoption rates, and purchase criteria
13 Geographic Landscape
- 13.1 Geographic segmentation
- Chart on Market share by geography 2024-2029 (%)
- Data Table on Market share by geography 2024-2029 (%)
- 13.2 Geographic comparison
- Chart on Geographic comparison
- Data Table on Geographic comparison
- 13.3 APAC - Market size and forecast 2024-2029
- Chart on APAC - Market size and forecast 2024-2029 ($ million)
- Data Table on APAC - Market size and forecast 2024-2029 ($ million)
- Chart on APAC - Year-over-year growth 2024-2029 (%)
- Data Table on APAC - Year-over-year growth 2024-2029 (%)
- 13.4 North America - Market size and forecast 2024-2029
- Chart on North America - Market size and forecast 2024-2029 ($ million)
- Data Table on North America - Market size and forecast 2024-2029 ($ million)
- Chart on North America - Year-over-year growth 2024-2029 (%)
- Data Table on North America - Year-over-year growth 2024-2029 (%)
- 13.5 Europe - Market size and forecast 2024-2029
- Chart on Europe - Market size and forecast 2024-2029 ($ million)
- Data Table on Europe - Market size and forecast 2024-2029 ($ million)
- Chart on Europe - Year-over-year growth 2024-2029 (%)
- Data Table on Europe - Year-over-year growth 2024-2029 (%)
- 13.6 South America - Market size and forecast 2024-2029
- Chart on South America - Market size and forecast 2024-2029 ($ million)
- Data Table on South America - Market size and forecast 2024-2029 ($ million)
- Chart on South America - Year-over-year growth 2024-2029 (%)
- Data Table on South America - Year-over-year growth 2024-2029 (%)
- 13.7 Middle East and Africa - Market size and forecast 2024-2029
- Chart on Middle East and Africa - Market size and forecast 2024-2029 ($ million)
- Data Table on Middle East and Africa - Market size and forecast 2024-2029 ($ million)
- Chart on Middle East and Africa - Year-over-year growth 2024-2029 (%)
- Data Table on Middle East and Africa - Year-over-year growth 2024-2029 (%)
- 13.8 US - Market size and forecast 2024-2029
- Chart on US - Market size and forecast 2024-2029 ($ million)
- Data Table on US - Market size and forecast 2024-2029 ($ million)
- Chart on US - Year-over-year growth 2024-2029 (%)
- Data Table on US - Year-over-year growth 2024-2029 (%)
- 13.9 China - Market size and forecast 2024-2029
- Chart on China - Market size and forecast 2024-2029 ($ million)
- Data Table on China - Market size and forecast 2024-2029 ($ million)
- Chart on China - Year-over-year growth 2024-2029 (%)
- Data Table on China - Year-over-year growth 2024-2029 (%)
- 13.10 Japan - Market size and forecast 2024-2029
- Chart on Japan - Market size and forecast 2024-2029 ($ million)
- Data Table on Japan - Market size and forecast 2024-2029 ($ million)
- Chart on Japan - Year-over-year growth 2024-2029 (%)
- Data Table on Japan - Year-over-year growth 2024-2029 (%)
- 13.11 South Korea - Market size and forecast 2024-2029
- Chart on South Korea - Market size and forecast 2024-2029 ($ million)
- Data Table on South Korea - Market size and forecast 2024-2029 ($ million)
- Chart on South Korea - Year-over-year growth 2024-2029 (%)
- Data Table on South Korea - Year-over-year growth 2024-2029 (%)
- 13.12 Taiwan - Market size and forecast 2024-2029
- Chart on Taiwan - Market size and forecast 2024-2029 ($ million)
- Data Table on Taiwan - Market size and forecast 2024-2029 ($ million)
- Chart on Taiwan - Year-over-year growth 2024-2029 (%)
- Data Table on Taiwan - Year-over-year growth 2024-2029 (%)
- 13.13 Germany - Market size and forecast 2024-2029
- Chart on Germany - Market size and forecast 2024-2029 ($ million)
- Data Table on Germany - Market size and forecast 2024-2029 ($ million)
- Chart on Germany - Year-over-year growth 2024-2029 (%)
- Data Table on Germany - Year-over-year growth 2024-2029 (%)
- 13.14 UK - Market size and forecast 2024-2029
- Chart on UK - Market size and forecast 2024-2029 ($ million)
- Data Table on UK - Market size and forecast 2024-2029 ($ million)
- Chart on UK - Year-over-year growth 2024-2029 (%)
- Data Table on UK - Year-over-year growth 2024-2029 (%)
- 13.15 France - Market size and forecast 2024-2029
- Chart on France - Market size and forecast 2024-2029 ($ million)
- Data Table on France - Market size and forecast 2024-2029 ($ million)
- Chart on France - Year-over-year growth 2024-2029 (%)
- Data Table on France - Year-over-year growth 2024-2029 (%)
- 13.16 India - Market size and forecast 2024-2029
- Chart on India - Market size and forecast 2024-2029 ($ million)
- Data Table on India - Market size and forecast 2024-2029 ($ million)
- Chart on India - Year-over-year growth 2024-2029 (%)
- Data Table on India - Year-over-year growth 2024-2029 (%)
- 13.17 Canada - Market size and forecast 2024-2029
- Chart on Canada - Market size and forecast 2024-2029 ($ million)
- Data Table on Canada - Market size and forecast 2024-2029 ($ million)
- Chart on Canada - Year-over-year growth 2024-2029 (%)
- Data Table on Canada - Year-over-year growth 2024-2029 (%)
- 13.18 Market opportunity by geography
- Market opportunity by geography ($ million)
- Data Tables on Market opportunity by geography ($ million)
- 13.19 Italy - Market size and forecast (2024-2029)
- Chart on Italy - Market size and forecast (2024-2029) ($ million)
- Data Table on Italy - Market size and forecast (2024-2029) ($ million)
- Chart on Italy - Year-over-year growth (2024-2029) (%)
- Data Table on Italy - Year-over-year growth (2024-2029) (%)
- 13.20 Brazil - Market size and forecast (2024-2029)
- Chart on Brazil - Market size and forecast (2024-2029) ($ million)
- Data Table on Brazil - Market size and forecast (2024-2029) ($ million)
- Chart on Brazil - Year-over-year growth (2024-2029) (%)
- Data Table on Brazil - Year-over-year growth (2024-2029) (%)
- 13.21 Egypt - Market size and forecast (2024-2029)
- Chart on Egypt - Market size and forecast (2024-2029) ($ million)
- Data Table on Egypt - Market size and forecast (2024-2029) ($ million)
- Chart on Egypt - Year-over-year growth (2024-2029) (%)
- Data Table on Egypt - Year-over-year growth (2024-2029) (%)
- 13.22 UAE - Market size and forecast (2024-2029)
- Chart on UAE - Market size and forecast (2024-2029) ($ million)
- Data Table on UAE - Market size and forecast (2024-2029) ($ million)
- Chart on UAE - Year-over-year growth (2024-2029) (%)
- Data Table on UAE - Year-over-year growth (2024-2029) (%)
- 13.23 Oman - Market size and forecast (2024-2029)
- Chart on Oman - Market size and forecast (2024-2029) ($ million)
- Data Table on Oman - Market size and forecast (2024-2029) ($ million)
- Chart on Oman - Year-over-year growth (2024-2029) (%)
- Data Table on Oman - Year-over-year growth (2024-2029) (%)
- 13.24 Argentina - Market size and forecast (2024-2029)
- Chart on Argentina - Market size and forecast (2024-2029) ($ million)
- Data Table on Argentina - Market size and forecast (2024-2029) ($ million)
- Chart on Argentina - Year-over-year growth (2024-2029) (%)
- Data Table on Argentina - Year-over-year growth (2024-2029) (%)
- 13.25 KSA - Market size and forecast (2024-2029)
- Chart on KSA - Market size and forecast (2024-2029) ($ million)
- Data Table on KSA - Market size and forecast (2024-2029) ($ million)
- Chart on KSA - Year-over-year growth (2024-2029) (%)
- Data Table on KSA - Year-over-year growth (2024-2029) (%)
- 13.26 Rest of World (ROW) - Market size and forecast (2024-2029)
- Chart on Rest of World (ROW) - Market size and forecast (2024-2029) ($ million)
- Data Table on Rest of World (ROW) - Market size and forecast (2024-2029) ($ million)
- Chart on Rest of World (ROW) - Year-over-year growth (2024-2029) (%)
- Data Table on Rest of World (ROW) - Year-over-year growth (2024-2029) (%)
14 Drivers, Challenges, and Opportunity/Restraints
- 14.3 Impact of drivers and challenges
- Impact of drivers and challenges in 2024 and 2029
- 14.4 Market opportunities/restraints
15 Competitive Landscape
- 15.2 Competitive Landscape
- Overview on criticality of inputs and factors of differentiation
- 15.3 Landscape disruption
- Overview on factors of disruption
- 15.4 Industry risks
- Impact of key risks on business
16 Competitive Analysis
- 16.2 Company ranking index
- 16.3 Market positioning of companies
- Matrix on companies position and classification
- 16.4 ADATA Technology Co. Ltd.
- ADATA Technology Co. Ltd. - Overview
- ADATA Technology Co. Ltd. - Product / Service
- ADATA Technology Co. Ltd. - Key offerings
- SWOT
- 16.5 DataDirect Networks Inc.
- DataDirect Networks Inc. - Overview
- DataDirect Networks Inc. - Product / Service
- DataDirect Networks Inc. - Key offerings
- SWOT
- 16.6 International Business Machines Corp.
- International Business Machines Corp. - Overview
- International Business Machines Corp. - Business segments
- International Business Machines Corp. - Key news
- International Business Machines Corp. - Key offerings
- International Business Machines Corp. - Segment focus
- SWOT
- 16.7 Kingston Technology Co. Inc.
- Kingston Technology Co. Inc. - Overview
- Kingston Technology Co. Inc. - Product / Service
- Kingston Technology Co. Inc. - Key offerings
- SWOT
- 16.8 LITE ON Technology Corp.
- LITE ON Technology Corp. - Overview
- LITE ON Technology Corp. - Business segments
- LITE ON Technology Corp. - Key news
- LITE ON Technology Corp. - Key offerings
- LITE ON Technology Corp. - Segment focus
- SWOT
- 16.9 Micron Technology Inc.
- Micron Technology Inc. - Overview
- Micron Technology Inc. - Business segments
- Micron Technology Inc. - Key news
- Micron Technology Inc. - Key offerings
- Micron Technology Inc. - Segment focus
- SWOT
- 16.10 NetApp Inc.
- NetApp Inc. - Overview
- NetApp Inc. - Product / Service
- NetApp Inc. - Key news
- NetApp Inc. - Key offerings
- SWOT
- 16.11 Samsung Electronics Co. Ltd.
- Samsung Electronics Co. Ltd. - Overview
- Samsung Electronics Co. Ltd. - Business segments
- Samsung Electronics Co. Ltd. - Key news
- Samsung Electronics Co. Ltd. - Key offerings
- Samsung Electronics Co. Ltd. - Segment focus
- SWOT
- 16.12 Sandisk Corp.
- Sandisk Corp. - Overview
- Sandisk Corp. - Product / Service
- Sandisk Corp. - Key offerings
- SWOT
- 16.13 Seagate Technology LLC
- Seagate Technology LLC - Overview
- Seagate Technology LLC - Product / Service
- Seagate Technology LLC - Key news
- Seagate Technology LLC - Key offerings
- SWOT
- 16.14 SK hynix Co. Ltd.
- SK hynix Co. Ltd. - Overview
- SK hynix Co. Ltd. - Product / Service
- SK hynix Co. Ltd. - Key news
- SK hynix Co. Ltd. - Key offerings
- SWOT
- 16.15 Solidigm
- Solidigm - Overview
- Solidigm - Product / Service
- Solidigm - Key offerings
- SWOT
- 16.16 Sony Group Corp.
- Sony Group Corp. - Overview
- Sony Group Corp. - Business segments
- Sony Group Corp. - Key offerings
- Sony Group Corp. - Segment focus
- SWOT
- 16.17 Toshiba Corp.
- Toshiba Corp. - Overview
- Toshiba Corp. - Business segments
- Toshiba Corp. - Key news
- Toshiba Corp. - Key offerings
- Toshiba Corp. - Segment focus
- SWOT
- 16.18 Transcend Information Inc.
- Transcend Information Inc. - Overview
- Transcend Information Inc. - Product / Service
- Transcend Information Inc. - Key news
- Transcend Information Inc. - Key offerings
- SWOT
17 Appendix
- 17.2 Inclusions and exclusions checklist
- Inclusions checklist
- Exclusions checklist
- 17.3 Currency conversion rates for US$
- Currency conversion rates for US$
- 17.4 Research methodology
- 17.7 Validation techniques employed for market sizing
- Validation techniques employed for market sizing
- 17.9 360 degree market analysis
- 360 degree market analysis
- 17.10 List of abbreviations