Nanocomposites Market Analysis APAC, North America, Europe, Middle East and Africa, South America - US, China, Japan, Germany, France - Size and Forecast 2024-2028

Nanocomposites Market Analysis APAC, North America, Europe, Middle East and Africa, South America - US, China, Japan, Germany, France - Size and Forecast 2024-2028

Published: Jul 2024 173 Pages SKU: IRTNTR76293

Market Overview at a Glance

$11.95 B
Market Opportunity
21.48%
CAGR
17.41
YoY growth 2023-2024(%)

Nanocomposites Market Size 2024-2028

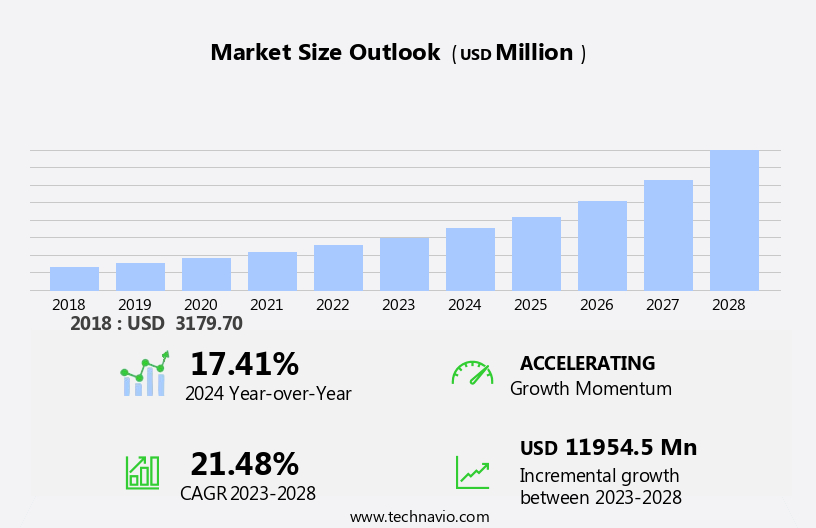
The nanocomposites market size is forecast to increase by USD 11.95 billion, at a CAGR of 21.48% between 2023 and 2028.

  • The market is experiencing significant growth due to the increasing demand for lightweight materials in various industries, including aerospace and defense, medical, electrical and electronics, and energy. Nanocomposites, which consist of a polymer matrix reinforced with nanoscale particles of metals, ceramics, or other materials, offer superior strength, durability, and functionality compared to traditional materials. However, the high cost of production is a major challenge limiting the widespread adoption of nanocomposites. In the aerospace and defense sector, nanocomposites are being used to manufacture lightweight and strong components for aircraft and military vehicles.
  • In the medical industry, nanocomposites are being used to develop advanced medical devices and implants. In the electrical and electronics sector, nanocomposites are being used to enhance the performance of batteries and capacitors. In the energy sector, nanocomposites are being used to improve the efficiency and durability of solar panels and fuel cells. Despite the challenges, the market for nanocomposites is expected to continue growing due to their unique properties and increasing applications in various industries.

What will be the Size of the Nanocomposites Market During the Forecast Period?

Nanocomposites Market Size

 Request Free Sample

  • The market is witnessing significant growth due to the unique properties these materials offer in various industries, including electronics, aerospace and defense, medical, and biotechnology. The incorporation of nanoparticles, such as single-walled carbon nanotubes and nanoclays, into polymers and other materials results in nanocomposites with enhanced semiconductor qualities. In the electronic industry, nanocomposites have gained popularity for their adaptability and flexibility in creating advanced packaging materials. These materials offer improved gas transmission rates, essential for protecting sensitive electronic components from environmental factors. Moreover, nanocomposites' oxidation-related resistance ensures extended shelf life, a crucial factor for the longevity of electronic devices.
  • Nanocomposites also find extensive applications in the convenience food industry. For instance, nanoparticles like surfactants and additives are used to enhance the properties of packaging materials, ensuring better protection against moisture and preserving the freshness of precooked food items. The automotive sector, specifically in the production of quadricycles, also benefits from nanocomposites. These materials contribute to the manufacturing of lightweight and durable components, reducing overall vehicle weight and improving fuel efficiency. In the case of General Motors, nanocomposites are used as an anticorrosion barrier, ensuring the longevity of automotive parts. In the aerospace and defense industry, nanocomposites are utilized for their exceptional strength and durability.

How is this Nanocomposites Industry segmented and which is the largest segment?

The nanocomposites industry research report provides comprehensive data (region-wise segment analysis), with forecasts and estimates in "USD billion" for the period 2024-2028, as well as historical data from 2018-2022 for the following segments.
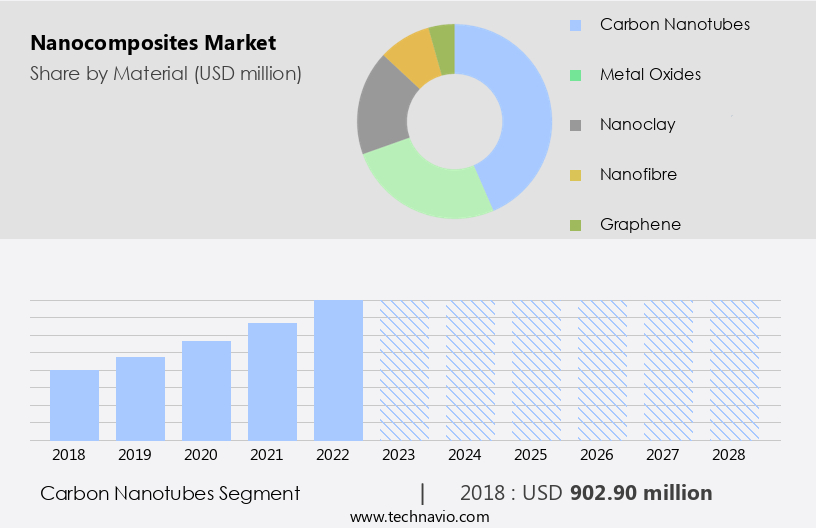
  • Material
    • Carbon nanotubes
    • Metal oxides
    • Nanoclay
    • Nanofibre
    • Graphene
  • Application
    • Packaging
    • Electronics and semiconductors
    • Automotive
    • Coatings
    • Aerospace and defense
  • Geography
    • APAC
      • China
      • Japan
    • North America
      • US
    • Europe
      • Germany
      • France
    • Middle East and Africa
    • South America

By Material Insights

  • The carbon nanotubes segment is estimated to witness significant growth during the forecast period.

Carbon nanotubes (CNTs) and graphene nanoparticles are revolutionizing the materials industry by enhancing the properties of composite materials. These nanomaterials offer significant improvements in strength, stiffness, and thermal conductivity, making them valuable additives for various end-user industries. In particular, aerospace, automotive, and construction sectors are incorporating CNTs and graphene nanoparticles to develop lightweight yet strong components. Beyond structural applications, CNTs are being explored for energy storage solutions, such as batteries and supercapacitors, due to their high surface area and conductivity. These nanomaterials are also being studied for use in fuel cells and solar PV cells, contributing to the development of high-performance nanocomposites.

Moreover, the use of CNTs and graphene nanoparticles aligns with the growing trend toward green technologies and sustainable practices. By improving energy efficiency and reducing the environmental impact of chemicals, these nanomaterials contribute to a more eco-friendly industrialization process. The versatility and exceptional properties of CNTs and graphene nanoparticles make them a valuable asset In the production of advanced nanocomposites with a wide range of applications.

Nanocomposites Market Size

Get a glance at the market report of the share of various segments Request Free Sample

The carbon nanotubes segment was valued at USD 902.90 million in 2018 and showed a gradual increase during the forecast period.

Regional Analysis

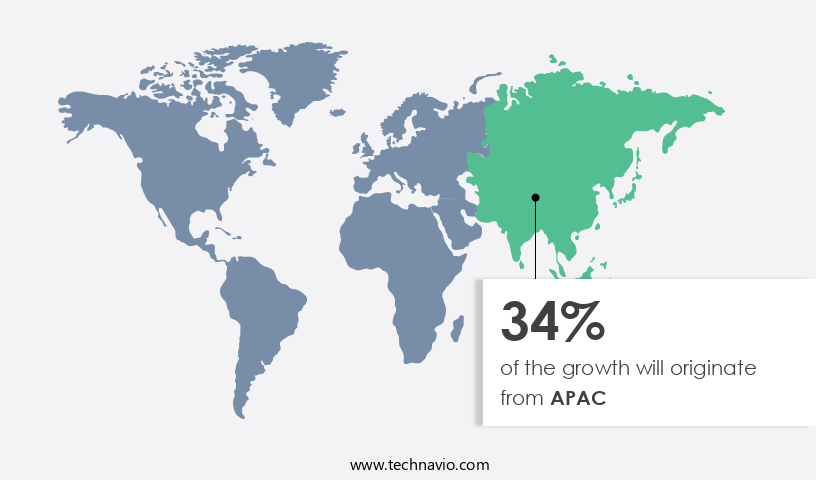
  • APAC is estimated to contribute 34% to the growth of the global market during the forecast period.

Technavio's analysts have elaborately explained the regional trends and drivers that shape the market during the forecast period.

Nanocomposites Market Share by Geography

For more insights on the market size of various regions, Request Free Sample

In Asia Pacific (APAC), the economies of China, India, Japan, South Korea, and others are experiencing rapid industrialization, urbanization, and infrastructure development. This region is a global leader in manufacturing, particularly in the sectors of general manufacturing and electronics. Nanocomposites, which are advanced materials made by combining polymers, metals, ceramics, nanoclay, graphene, and nanofibers, are increasingly being used in various manufacturing processes. In the automotive industry, nanocomposites enhance fuel efficiency, safety, and overall vehicle performance by reducing weight and improving strength. In the electronics sector, these materials are essential for creating advanced electronic components, devices, and packaging materials. The APAC electronics industry is vast, making nanocomposites indispensable In the production of high-tech gadgets and sophisticated electronic systems.

Market Dynamics

Our researchers analyzed the data with 2023 as the base year, along with the key drivers, trends, and challenges. A holistic analysis of drivers will help companies refine their marketing strategies to gain a competitive advantage.

What are the key market drivers leading to the rise in the adoption of the Nanocomposites Industry?

  • Nanocomposite coatings are gaining traction as the key driver of the market. Nanocomposite coatings have gained significant attention in numerous industries due to their semiconductor qualities and adaptability. These coatings comprise nanoscale particles embedded in a matrix material, resulting in enhanced properties and functionality. Notably, nanocomposites offer reduced friction and wear, making them indispensable in applications involving sliding or rotating components, such as bearings, gears, and cutting tools.
  • Moreover, they can boost thermal and electrical conductivity, rendering them essential in applications requiring efficient heat dissipation or electrical conduction. In the realm of healthcare, nanocomposite coatings are utilized in medical devices and implants to augment biocompatibility, minimize friction, and prevent bacterial growth on implant surfaces.

What are the market trends shaping the Nanocomposites Industry?

High demand for lightweight materials is the upcoming market trend.

  • Nanocomposites, which are materials consisting of a matrix phase and dispersed nanoscale particles, have gained significant attention in various industries due to their exceptional properties. In the aerospace and defense sector, nanocomposites are utilized for their high strength-to-weight ratios, making them indispensable in reducing the weight of components. This weight reduction results in increased aircraft capacity or fuel efficiency, leading to improved economics and reduced environmental impact. 
  • Similarly, in the medical field, nanocomposites are employed for their biocompatibility and enhanced mechanical properties, contributing to the development of advanced medical devices. The electrical and electronics industry leverages nanocomposites for their superior electrical conductivity and insulation properties, enhancing the performance of electronic components. Furthermore, nanocomposites play a crucial role In the energy sector by improving the efficiency and durability of batteries and fuel cells. Both polymer matrix, metal matrix, and ceramic matrix nanocomposites find extensive applications In these industries, making them a vital component of sustainable and efficient manufacturing processes.

What challenges does the Nanocomposites Industry face during its growth?

High cost of production of nanocomposites is a key challenge affecting the industry growth.

  • Nanocomposites, a class of advanced materials composed of nanoscale particles dispersed in a matrix, have gained significant attention due to their unique properties and potential applications in various industries. However, the production of nanocomposites comes with certain challenges that can impact their market growth. One such challenge is the high cost associated with the production of nanocomposites. The use of specialized equipment, precise manufacturing techniques, and high-quality nanoparticles necessitates higher production costs when compared to traditional materials. Furthermore, comprehensive testing and characterization are essential to ensure that nanocomposites meet the required quality standards in various end-user industries, leading to additional costs due to the use of specialized equipment and the need for skilled personnel.
  • Moreover, the sensitivity of nanocomposites to environmental factors, such as moisture and shelf life, can pose challenges in industries that deal with convenience foods, such as precooked meals. For instance, in the automotive industry, the use of nanocomposites in the production of quadricycles by manufacturers like General Motors requires stringent testing to ensure their durability and performance under varying conditions. Despite these challenges, the nanoparticles market is expected to grow significantly due to the increasing demand for lightweight and high-performance materials in various industries.

Exclusive Customer Landscape

The nanocomposites market forecasting report includes the adoption lifecycle of the market, covering from the innovator's stage to the laggard's stage. It focuses on adoption rates in different regions based on penetration. Furthermore, the nanocomposites market report also includes key purchase criteria and drivers of price sensitivity to help companies evaluate and develop their market growth analysis strategies.

Nanocomposites Market Share by Geography

 Customer Landscape

Key Companies & Market Insights

Companies are implementing various strategies, such as strategic alliances, nanocomposites market forecast, partnerships, mergers and acquisitions, geographical expansion, and product/service launches, to enhance their presence in the industry.

The industry research and growth report includes detailed analyses of the competitive landscape of the market and information about key companies, including:

  • 3M Co.
  • Arkema SA
  • BASF SE
  • Briggs Automotive Co.
  • Cabot Corp.
  • Celanese Corp.
  • eSpin Technologies Inc.
  • Evonik Industries AG
  • Inframat Corp.
  • Integran Technologies Inc
  • Makevale Group
  • Miller Waste Mills Inc.
  • Minerals Technologies Inc.
  • Nanocyl SA
  • NanoSonic Inc.
  • Pixelligent
  • PlasmaChem GmbH
  • Ultramet
  • Unitika Ltd.
  • Zyvex Corp.

Qualitative and quantitative analysis of companies has been conducted to help clients understand the wider business environment as well as the strengths and weaknesses of key industry players. Data is qualitatively analyzed to categorize companies as pure play, category-focused, industry-focused, and diversified; it is quantitatively analyzed to categorize companies as dominant, leading, strong, tentative, and weak.

Research Analyst Overview

Nanocomposites, a class of materials engineered by integrating nanoparticles into a polymer, metal, or ceramic matrix, have gained significant traction in various industries due to their semiconductor qualities. In the electronic packaging materials sector, nanocomposites offer adaptability and flexibility, making them suitable for use in microelectronics and other advanced electronic applications. The nanoparticles market, including graphene nanoparticles, carbon nanotubes, and nanoclays, is witnessing growth in the aerospace and defense, medical, electrical and electronics, energy, and industrialization sectors. The use of nanocomposites in these industries is driven by their excellent gas transmission rate, oxidation resistance, and long shelf life. 

In the consumer lifestyle segment, nanocomposites are used in the production of precooked convenience food packaging due to their non-corrosive properties and ability to withstand high temperatures. Further, the automotive industry also utilizes nanocomposites in the manufacturing of quadricycles and vehicles by General Motors for their lightweight and high-strength properties. Nanocomposites are also finding applications in biotechnology, where they are used in the production of ultrasound probes and surfactants. In the energy sector, nanocomposites are used as anticorrosion barriers and in the production of polymers, metals, and ceramics. The leading market players in the market include Chasm Advanced Materials, Nanosonics, and Birla Carbon.

Market Scope

Report Coverage

Details

Page number

173

Base year

2023

Historic period

2018-2022

Forecast period

2024-2028

Growth momentum & CAGR

Accelerate at a CAGR of 21.48%

Market growth 2024-2028

USD 11.95 billion

Market structure

Fragmented

YoY growth 2023-2024(%)

17.41

Key countries

US, China, Japan, Germany, and France

Competitive landscape

Leading Companies, Market Positioning of Companies, Competitive Strategies, and Industry Risks

Request Free Sample

What are the Key Data Covered in this Nanocomposites Market Research and Growth Report?

  • CAGR of the Nanocomposites industry during the forecast period
  • Detailed information on factors that will drive the market growth and forecasting between 2024 and 2028
  • Precise estimation of the size of the market and its contribution of the industry in focus to the parent market
  • Accurate predictions about upcoming growth and trends and changes in consumer behaviour
  • Growth of the market across APAC, North America, Europe, Middle East and Africa, and South America
  • Thorough analysis of the market's competitive landscape and detailed information about companies
  • Comprehensive analysis of factors that will challenge the nanocomposites market growth of industry companies

We can help! Our analysts can customize this nanocomposites market research report to meet your requirements.

Get in touch

1 Executive Summary

  • 1.1 Market overview
    • Executive Summary - Chart on Market Overview
    • Executive Summary - Data Table on Market Overview
    • Executive Summary - Chart on Global Market Characteristics
    • Executive Summary - Chart on Market by Geography
    • Executive Summary - Chart on Market Segmentation by Material
    • Executive Summary - Chart on Market Segmentation by Application
    • Executive Summary - Chart on Incremental Growth
    • Executive Summary - Data Table on Incremental Growth
    • Executive Summary - Chart on Company Market Positioning

2 Market Landscape

  • 2.1 Market ecosystem
    • Parent Market
    • Data Table on - Parent Market
  • 2.2 Market characteristics
    • Market characteristics analysis
  • 2.3 Value chain analysis
    • Value Chain Analysis

3 Market Sizing

  • 3.1 Market definition
    • Offerings of companies included in the market definition
  • 3.2 Market segment analysis
    • Market segments
  • 3.3 Market size 2023
    • 3.4 Market outlook: Forecast for 2023-2028
      • Chart on Global - Market size and forecast 2023-2028 ($ million)
      • Data Table on Global - Market size and forecast 2023-2028 ($ million)
      • Chart on Global Market: Year-over-year growth 2023-2028 (%)
      • Data Table on Global Market: Year-over-year growth 2023-2028 (%)

    4 Historic Market Size

    • 4.1 Global Nanocomposites Market 2018 - 2022
      • Historic Market Size - Data Table on Global Nanocomposites Market 2018 - 2022 ($ million)
    • 4.2 Material segment analysis 2018 - 2022
      • Historic Market Size - Material Segment 2018 - 2022 ($ million)
    • 4.3 Application segment analysis 2018 - 2022
      • Historic Market Size - Application Segment 2018 - 2022 ($ million)
    • 4.4 Geography segment analysis 2018 - 2022
      • Historic Market Size - Geography Segment 2018 - 2022 ($ million)
    • 4.5 Country segment analysis 2018 - 2022
      • Historic Market Size - Country Segment 2018 - 2022 ($ million)

    5 Five Forces Analysis

    • 5.1 Five forces summary
      • Five forces analysis - Comparison between 2023 and 2028
    • 5.2 Bargaining power of buyers
      • Bargaining power of buyers - Impact of key factors 2023 and 2028
    • 5.3 Bargaining power of suppliers
      • Bargaining power of suppliers - Impact of key factors in 2023 and 2028
    • 5.4 Threat of new entrants
      • Threat of new entrants - Impact of key factors in 2023 and 2028
    • 5.5 Threat of substitutes
      • Threat of substitutes - Impact of key factors in 2023 and 2028
    • 5.6 Threat of rivalry
      • Threat of rivalry - Impact of key factors in 2023 and 2028
    • 5.7 Market condition
      • Chart on Market condition - Five forces 2023 and 2028

    6 Market Segmentation by Material

    • 6.1 Market segments
      • Chart on Material - Market share 2023-2028 (%)
      • Data Table on Material - Market share 2023-2028 (%)
    • 6.2 Comparison by Material
      • Chart on Comparison by Material
      • Data Table on Comparison by Material
    • 6.3 Carbon nanotubes - Market size and forecast 2023-2028
      • Chart on Carbon nanotubes - Market size and forecast 2023-2028 ($ million)
      • Data Table on Carbon nanotubes - Market size and forecast 2023-2028 ($ million)
      • Chart on Carbon nanotubes - Year-over-year growth 2023-2028 (%)
      • Data Table on Carbon nanotubes - Year-over-year growth 2023-2028 (%)
    • 6.4 Metal oxides - Market size and forecast 2023-2028
      • Chart on Metal oxides - Market size and forecast 2023-2028 ($ million)
      • Data Table on Metal oxides - Market size and forecast 2023-2028 ($ million)
      • Chart on Metal oxides - Year-over-year growth 2023-2028 (%)
      • Data Table on Metal oxides - Year-over-year growth 2023-2028 (%)
    • 6.5 Nanoclay - Market size and forecast 2023-2028
      • Chart on Nanoclay - Market size and forecast 2023-2028 ($ million)
      • Data Table on Nanoclay - Market size and forecast 2023-2028 ($ million)
      • Chart on Nanoclay - Year-over-year growth 2023-2028 (%)
      • Data Table on Nanoclay - Year-over-year growth 2023-2028 (%)
    • 6.6 Nanofibre - Market size and forecast 2023-2028
      • Chart on Nanofibre - Market size and forecast 2023-2028 ($ million)
      • Data Table on Nanofibre - Market size and forecast 2023-2028 ($ million)
      • Chart on Nanofibre - Year-over-year growth 2023-2028 (%)
      • Data Table on Nanofibre - Year-over-year growth 2023-2028 (%)
    • 6.7 Graphene - Market size and forecast 2023-2028
      • Chart on Graphene - Market size and forecast 2023-2028 ($ million)
      • Data Table on Graphene - Market size and forecast 2023-2028 ($ million)
      • Chart on Graphene - Year-over-year growth 2023-2028 (%)
      • Data Table on Graphene - Year-over-year growth 2023-2028 (%)
    • 6.8 Market opportunity by Material
      • Market opportunity by Material ($ million)
      • Data Table on Market opportunity by Material ($ million)

    7 Market Segmentation by Application

    • 7.1 Market segments
      • Chart on Application - Market share 2023-2028 (%)
      • Data Table on Application - Market share 2023-2028 (%)
    • 7.2 Comparison by Application
      • Chart on Comparison by Application
      • Data Table on Comparison by Application
    • 7.3 Packaging - Market size and forecast 2023-2028
      • Chart on Packaging - Market size and forecast 2023-2028 ($ million)
      • Data Table on Packaging - Market size and forecast 2023-2028 ($ million)
      • Chart on Packaging - Year-over-year growth 2023-2028 (%)
      • Data Table on Packaging - Year-over-year growth 2023-2028 (%)
    • 7.4 Electronics and semiconductors - Market size and forecast 2023-2028
      • Chart on Electronics and semiconductors - Market size and forecast 2023-2028 ($ million)
      • Data Table on Electronics and semiconductors - Market size and forecast 2023-2028 ($ million)
      • Chart on Electronics and semiconductors - Year-over-year growth 2023-2028 (%)
      • Data Table on Electronics and semiconductors - Year-over-year growth 2023-2028 (%)
    • 7.5 Automotive - Market size and forecast 2023-2028
      • Chart on Automotive - Market size and forecast 2023-2028 ($ million)
      • Data Table on Automotive - Market size and forecast 2023-2028 ($ million)
      • Chart on Automotive - Year-over-year growth 2023-2028 (%)
      • Data Table on Automotive - Year-over-year growth 2023-2028 (%)
    • 7.6 Coatings - Market size and forecast 2023-2028
      • Chart on Coatings - Market size and forecast 2023-2028 ($ million)
      • Data Table on Coatings - Market size and forecast 2023-2028 ($ million)
      • Chart on Coatings - Year-over-year growth 2023-2028 (%)
      • Data Table on Coatings - Year-over-year growth 2023-2028 (%)
    • 7.7 Aerospace and defense - Market size and forecast 2023-2028
      • Chart on Aerospace and defense - Market size and forecast 2023-2028 ($ million)
      • Data Table on Aerospace and defense - Market size and forecast 2023-2028 ($ million)
      • Chart on Aerospace and defense - Year-over-year growth 2023-2028 (%)
      • Data Table on Aerospace and defense - Year-over-year growth 2023-2028 (%)
    • 7.8 Market opportunity by Application
      • Market opportunity by Application ($ million)
      • Data Table on Market opportunity by Application ($ million)

    8 Customer Landscape

    • 8.1 Customer landscape overview
      • Analysis of price sensitivity, lifecycle, customer purchase basket, adoption rates, and purchase criteria

    9 Geographic Landscape

    • 9.1 Geographic segmentation
      • Chart on Market share by geography 2023-2028 (%)
      • Data Table on Market share by geography 2023-2028 (%)
    • 9.2 Geographic comparison
      • Chart on Geographic comparison
      • Data Table on Geographic comparison
    • 9.3 APAC - Market size and forecast 2023-2028
      • Chart on APAC - Market size and forecast 2023-2028 ($ million)
      • Data Table on APAC - Market size and forecast 2023-2028 ($ million)
      • Chart on APAC - Year-over-year growth 2023-2028 (%)
      • Data Table on APAC - Year-over-year growth 2023-2028 (%)
    • 9.4 North America - Market size and forecast 2023-2028
      • Chart on North America - Market size and forecast 2023-2028 ($ million)
      • Data Table on North America - Market size and forecast 2023-2028 ($ million)
      • Chart on North America - Year-over-year growth 2023-2028 (%)
      • Data Table on North America - Year-over-year growth 2023-2028 (%)
    • 9.5 Europe - Market size and forecast 2023-2028
      • Chart on Europe - Market size and forecast 2023-2028 ($ million)
      • Data Table on Europe - Market size and forecast 2023-2028 ($ million)
      • Chart on Europe - Year-over-year growth 2023-2028 (%)
      • Data Table on Europe - Year-over-year growth 2023-2028 (%)
    • 9.6 Middle East and Africa - Market size and forecast 2023-2028
      • Chart on Middle East and Africa - Market size and forecast 2023-2028 ($ million)
      • Data Table on Middle East and Africa - Market size and forecast 2023-2028 ($ million)
      • Chart on Middle East and Africa - Year-over-year growth 2023-2028 (%)
      • Data Table on Middle East and Africa - Year-over-year growth 2023-2028 (%)
    • 9.7 South America - Market size and forecast 2023-2028
      • Chart on South America - Market size and forecast 2023-2028 ($ million)
      • Data Table on South America - Market size and forecast 2023-2028 ($ million)
      • Chart on South America - Year-over-year growth 2023-2028 (%)
      • Data Table on South America - Year-over-year growth 2023-2028 (%)
    • 9.8 US - Market size and forecast 2023-2028
      • Chart on US - Market size and forecast 2023-2028 ($ million)
      • Data Table on US - Market size and forecast 2023-2028 ($ million)
      • Chart on US - Year-over-year growth 2023-2028 (%)
      • Data Table on US - Year-over-year growth 2023-2028 (%)
    • 9.9 China - Market size and forecast 2023-2028
      • Chart on China - Market size and forecast 2023-2028 ($ million)
      • Data Table on China - Market size and forecast 2023-2028 ($ million)
      • Chart on China - Year-over-year growth 2023-2028 (%)
      • Data Table on China - Year-over-year growth 2023-2028 (%)
    • 9.10 Japan - Market size and forecast 2023-2028
      • Chart on Japan - Market size and forecast 2023-2028 ($ million)
      • Data Table on Japan - Market size and forecast 2023-2028 ($ million)
      • Chart on Japan - Year-over-year growth 2023-2028 (%)
      • Data Table on Japan - Year-over-year growth 2023-2028 (%)
    • 9.11 Germany - Market size and forecast 2023-2028
      • Chart on Germany - Market size and forecast 2023-2028 ($ million)
      • Data Table on Germany - Market size and forecast 2023-2028 ($ million)
      • Chart on Germany - Year-over-year growth 2023-2028 (%)
      • Data Table on Germany - Year-over-year growth 2023-2028 (%)
    • 9.12 France - Market size and forecast 2023-2028
      • Chart on France - Market size and forecast 2023-2028 ($ million)
      • Data Table on France - Market size and forecast 2023-2028 ($ million)
      • Chart on France - Year-over-year growth 2023-2028 (%)
      • Data Table on France - Year-over-year growth 2023-2028 (%)
    • 9.13 Market opportunity by geography
      • Market opportunity by geography ($ million)
      • Data Tables on Market opportunity by geography ($ million)

    10 Drivers, Challenges, and Opportunity/Restraints

    • 10.1 Market drivers
      • 10.2 Market challenges
        • 10.3 Impact of drivers and challenges
          • Impact of drivers and challenges in 2023 and 2028
        • 10.4 Market opportunities/restraints

          11 Competitive Landscape

          • 11.1 Overview
            • 11.2 Competitive Landscape
              • Overview on criticality of inputs and factors of differentiation
            • 11.3 Landscape disruption
              • Overview on factors of disruption
            • 11.4 Industry risks
              • Impact of key risks on business

            12 Competitive Analysis

            • 12.1 Companies profiled
              • Companies covered
            • 12.2 Market positioning of companies
              • Matrix on companies position and classification
            • 3M Co.
              • 3M Co. - Overview
              • 3M Co. - Business segments
              • 3M Co. - Key news
              • 3M Co. - Key offerings
              • 3M Co. - Segment focus
            • 12.4 Arkema SA
              • Arkema SA - Overview
              • Arkema SA - Business segments
              • Arkema SA - Key news
              • Arkema SA - Key offerings
              • Arkema SA - Segment focus
            • 12.5 Briggs Automotive Co.
              • Briggs Automotive Co. - Overview
              • Briggs Automotive Co. - Product / Service
              • Briggs Automotive Co. - Key offerings
            • 12.6 Cabot Corp.
              • Cabot Corp. - Overview
              • Cabot Corp. - Business segments
              • Cabot Corp. - Key news
              • Cabot Corp. - Key offerings
              • Cabot Corp. - Segment focus
            • 12.7 Celanese Corp.
              • Celanese Corp. - Overview
              • Celanese Corp. - Business segments
              • Celanese Corp. - Key news
              • Celanese Corp. - Key offerings
              • Celanese Corp. - Segment focus
            • 12.8 eSpin Technologies Inc.
              • eSpin Technologies Inc. - Overview
              • eSpin Technologies Inc. - Product / Service
              • eSpin Technologies Inc. - Key offerings
            • 12.9 Evonik Industries AG
              • Evonik Industries AG - Overview
              • Evonik Industries AG - Business segments
              • Evonik Industries AG - Key news
              • Evonik Industries AG - Key offerings
              • Evonik Industries AG - Segment focus
            • 12.10 Inframat Corp.
              • Inframat Corp. - Overview
              • Inframat Corp. - Product / Service
              • Inframat Corp. - Key offerings
            • 12.11 Integran Technologies Inc
              • Integran Technologies Inc - Overview
              • Integran Technologies Inc - Product / Service
              • Integran Technologies Inc - Key offerings
            • 12.12 Miller Waste Mills Inc.
              • Miller Waste Mills Inc. - Overview
              • Miller Waste Mills Inc. - Product / Service
              • Miller Waste Mills Inc. - Key offerings
            • 12.13 Minerals Technologies Inc.
              • Minerals Technologies Inc. - Overview
              • Minerals Technologies Inc. - Business segments
              • Minerals Technologies Inc. - Key news
              • Minerals Technologies Inc. - Key offerings
              • Minerals Technologies Inc. - Segment focus
            • 12.14 Pixelligent
              • Pixelligent - Overview
              • Pixelligent - Product / Service
              • Pixelligent - Key offerings
            • 12.15 PlasmaChem GmbH
              • PlasmaChem GmbH - Overview
              • PlasmaChem GmbH - Product / Service
              • PlasmaChem GmbH - Key offerings
            • 12.16 Ultramet
              • Ultramet - Overview
              • Ultramet - Product / Service
              • Ultramet - Key offerings
            • 12.17 Zyvex Corp.
              • Zyvex Corp. - Overview
              • Zyvex Corp. - Product / Service
              • Zyvex Corp. - Key offerings

            13 Appendix

            • 13.1 Scope of the report
              • 13.2 Inclusions and exclusions checklist
                • Inclusions checklist
                • Exclusions checklist
              • 13.3 Currency conversion rates for US$
                • Currency conversion rates for US$
              • 13.4 Research methodology
                • Research methodology
              • 13.5 Data procurement
                • Information sources
              • 13.6 Data validation
                • Data validation
              • 13.7 Validation techniques employed for market sizing
                • Validation techniques employed for market sizing
              • 13.8 Data synthesis
                • Data synthesis
              • 360 degree market analysis
                • 360 degree market analysis
              • 13.10 List of abbreviations
                • List of abbreviations

              Research Methodology

              Technavio presents a detailed picture of the market by way of study, synthesis, and summation of data from multiple sources. The analysts have presented the various facets of the market with a particular focus on identifying the key industry influencers. The data thus presented is comprehensive, reliable, and the result of extensive research, both primary and secondary.

              INFORMATION SOURCES

              Primary sources

              • Manufacturers and suppliers
              • Channel partners
              • Industry experts
              • Strategic decision makers

              Secondary sources

              • Industry journals and periodicals
              • Government data
              • Financial reports of key industry players
              • Historical data
              • Press releases

              DATA ANALYSIS

              Data Synthesis

              • Collation of data
              • Estimation of key figures
              • Analysis of derived insights

              Data Validation

              • Triangulation with data models
              • Reference against proprietary databases
              • Corroboration with industry experts

              REPORT WRITING

              Qualitative

              • Market drivers
              • Market challenges
              • Market trends
              • Five forces analysis

              Quantitative

              • Market size and forecast
              • Market segmentation
              • Geographical insights
              • Competitive landscape

              Interested in this report?

              Get your sample now to see our research methodology and insights!

              Download Now

              Frequently Asked Questions

              Nanocomposites market growth will increase by $ 11954.5 mn during 2024-2028.

              The Nanocomposites market is expected to grow at a CAGR of 21.48% during 2024-2028.

              Nanocomposites market is segmented by Material( Carbon nanotubes, Metal oxides, Nanoclay, Nanofibre, Graphene) Application( Packaging, Electronics and semiconductors, Automotive, Coatings, Aerospace and defense)

              3M Co., Arkema SA, BASF SE, Briggs Automotive Co., Cabot Corp., Celanese Corp., eSpin Technologies Inc., Evonik Industries AG, Inframat Corp., Integran Technologies Inc, Makevale Group, Miller Waste Mills Inc., Minerals Technologies Inc., Nanocyl SA, NanoSonic Inc., Pixelligent, PlasmaChem GmbH, Ultramet, Unitika Ltd., Zyvex Corp. are a few of the key vendors in the Nanocomposites market.

              APAC will register the highest growth rate of 34% among the other regions. Therefore, the Nanocomposites market in APAC is expected to garner significant business opportunities for the vendors during the forecast period.

              US, China, Japan, Germany, France

              • Nanocomposite coatings gaining tractionNanocomposite coatings are gaining traction across various end-user industries due to their unique properties and versatile applications. These coatings consist of nanoscale particles that are dispersed within a matrix material is the driving factor this market.
              • which offers improved performance is the driving factor this market.
              • durability is the driving factor this market.
              • and functionality. Nanocomposite coatings can offer low friction and wear characteristics is the driving factor this market.
              • making them valuable in applications that involve sliding or rotating components is the driving factor this market.
              • such as bearings is the driving factor this market.
              • gears is the driving factor this market.
              • and cutting tools. Nanocomposite coatings can enhance the thermal and electrical conductivity of surfaces is the driving factor this market.
              • making them useful in applications that require efficient heat dissipation or electrical conduction. Nanocomposite coatings are used in medical devices and implants to improve their biocompatibility is the driving factor this market.
              • reduce friction is the driving factor this market.
              • and prevent bacterial growth on the surfaces of the implants. The diverse range of benefits offered by nanocomposite coatings is the driving factor this market.
              • coupled with advances in nanotechnology and manufacturing techniques is the driving factor this market.
              • is driving their increasing adoption across many industries is the driving factor this market.
              • ranging from automotive and aerospace to electronics and healthcare is the driving factor this market.
              • which is the driving factor this market.
              • in turn is the driving factor this market.
              • is expected to boost the growth of the global nanocomposites market during the forecast period. is the driving factor this market.

              The Nanocomposites market vendors should focus on grabbing business opportunities from the Carbon nanotubes segment as it accounted for the largest market share in the base year.
              RIA - Research AI Assistant
              Ask RIA