Nanosilica Market Analysis APAC, North America, Europe, South America, Middle East and Africa - US, China, Germany, Japan, UK - Size and Forecast 2024-2028

Nanosilica Market Analysis APAC, North America, Europe, South America, Middle East and Africa - US, China, Germany, Japan, UK - Size and Forecast 2024-2028

Published: Jul 2024 176 Pages SKU: IRTNTR45769

Market Overview at a Glance

$1.90 B
Market Opportunity
6.78%
CAGR
6.23
YoY growth 2023-2024(%)

Nanosilica Market Size 2024-2028

The nanosilica market size is forecast to increase by USD 1.9 billion, at a CAGR of 6.78% between 2023 and 2028.

  • The market is experiencing significant growth due to the increasing demand for nanotechnology in various industries, particularly in the sectors of electronics and healthcare. The miniaturization trend in technology is driving this demand, as nanosilica's unique properties enable the production of smaller, more efficient components. However, the high cost of manufacturing nanosilica poses a significant challenge for market growth. This cost barrier may limit the adoption of nanosilica in mass production applications, requiring continued research and development efforts to reduce production costs and expand the market's reach.
  • Companies seeking to capitalize on the opportunities presented by the market must navigate this challenge effectively, potentially through partnerships, economies of scale, or process optimization strategies. Overall, the market holds great potential for innovation and growth, with the ability to transform industries and create new applications in the realms of electronics, energy, and healthcare.

What will be the Size of the Nanosilica Market during the forecast period?

Nanosilica Market Size

Explore in-depth regional segment analysis with market size data - historical 2018-2022 and forecasts 2024-2028 - in the full report.  
Request Free Sample

Nanosilica, a form of silica with a high specific surface area, continues to gain traction in various industries due to its versatile properties. This nanomaterial offers enhanced performance in applications such as rheology modification, reinforcement, thermal conductivity, and insulation materials. In the realm of concrete, nanosilica enhances mechanical strength and water repellency through surface modification and hydrophobic treatment. In the insulation sector, nanosilica's high specific surface area and particle size distribution contribute to improved insulation properties. As a catalyst support, it offers increased efficiency and selectivity in chemical reactions. In food additives, nanosilica's hydrophobic treatment and particle engineering lead to innovative solutions for texture improvement and stabilization.

The evolving market dynamics of nanosilica are further influenced by its application in catalyst support, where it demonstrates synergistic effects with other additives. In the field of particle size distribution and surface area, advancements in precipitated silica and colloidal silica production continue to shape the industry. Nanosilica's surface chemistry, including hydrophilic treatment and silane coupling agents, expands its potential in various sectors, such as drug delivery and dental materials. Its applications in flame retardancy, transmission electron microscopy, and scanning electron microscopy further highlight its role in material science research and development. The continuous unfolding of market activities surrounding nanosilica is marked by ongoing research and development efforts, focusing on improving dispersion stability, pore size distribution, and bulk density.

As the industry evolves, nanosilica's role in enhancing the properties of various materials is becoming increasingly significant.

How is this Nanosilica Industry segmented?

The nanosilica industry research report provides comprehensive data (region-wise segment analysis), with forecasts and estimates in "USD million" for the period 2024-2028, as well as historical data from 2018-2022 for the following segments.

  • Type
    • P type
    • S type
    • Type III
  • Application
    • Rubber
    • Coatings
    • Healthcare and medicine
    • Plastics
    • Others
  • Geography
    • North America
      • US
    • Europe
      • Germany
      • UK
    • APAC
      • China
      • Japan
    • Rest of World (ROW)

    By Type Insights

    The p type segment is estimated to witness significant growth during the forecast period.

    Nanosilica, a type of silica with particles in the nanometer range, is a versatile material used in various industries due to its unique properties. Two primary types, S-type and P-type, differ in their structure and surface characteristics. S-type nanosilica has a spherical shape and a smaller specific surface area (SSA), while P-type, also known as porous nanosilica, contains nanopores and exhibits a larger SSA and higher UV reflectivity. P-type nanosilica's large surface area and amorphous nature make it suitable for applications in coatings, gypsum, batteries, paints, adhesives, and cosmetics. In the coatings industry, it functions as a rheology modifier, reinforcement agent, and viscosity controller.

    In high-performance concrete, it improves mechanical strength and thermal conductivity. As an insulation material, it enhances flame retardancy and provides controlled release properties. In catalyst support, it ensures dispersion stability and silane coupling agent efficiency. In food additives, it offers hydrophobic treatment and particle engineering for improved texture and shelf life. The global market for these applications is expected to grow significantly due to factors such as increasing construction activities, particularly in developing regions, and the demand for advanced materials in various industries. Nanosilica also finds applications in dental materials, drug delivery systems, and hydrophilic treatment for specific surface modifications.

    Its unique properties, including chemical resistance, abrasion resistance, and pore size distribution, contribute to its wide usage and the market's continued expansion.

    Nanosilica Market Size

    Request Free Sample

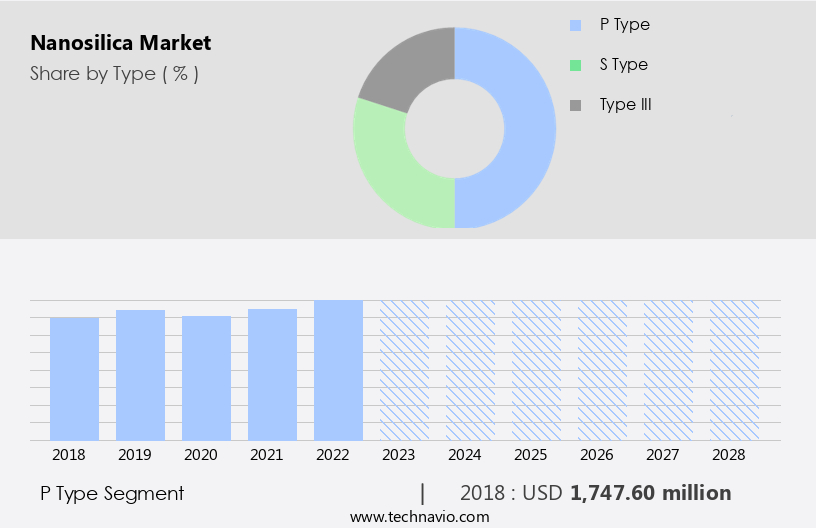
    The P type segment was valued at USD 1.75 billion in 2018 and showed a gradual increase during the forecast period.

    Regional Analysis

    APAC is estimated to contribute 59% to the growth of the global market during the forecast period.Technavio’s analysts have elaborately explained the regional trends and drivers that shape the market during the forecast period.

    Nanosilica Market Share by Geography

     Request Free Sample

    Nanosilica, a versatile nanomaterial, finds extensive applications in various industries due to its unique properties, including rheology modification, reinforcement, thermal conductivity enhancement, and chemical resistance. The global market for nanosilica is witnessing significant growth, driven by its use in high-performance concrete, insulation materials, catalyst support, food additives, and other applications. APAC is the largest and fastest-growing regional market for nanosilica, fueled by the expansion of end-user industries such as consumer durables, electrical and electronics, automotive, and construction in countries like China, Japan, and India. These economies' low labor and operating costs, coupled with improved business standards, contribute to their dominance in the market.

    China, in particular, is a significant consumer of nanosilica due to its large population and robust manufacturing sector. Nanosilica's small particle size, high surface area, and ability to form dispersions make it an essential ingredient in various industries. Its hydrophobic and hydrophilic treatments, surface modification, and synergistic effects with other additives further expand its applications. Nanosilica's particle engineering, dispersion stability, and surface chemistry are crucial factors influencing its performance in various applications. Additionally, its use in drug delivery, dental materials, and flame retardancy adds to its market potential. Transmission electron microscopy and scanning electron microscopy are commonly used to analyze the morphology and structure of nanosilica particles.

    Silane coupling agents and colloidal silica are often used in conjunction with nanosilica to enhance its properties. Bulk density, mechanical strength, and pore size distribution are essential parameters in evaluating the performance of nanosilica in different applications. In summary, The market is experiencing robust growth, driven by its diverse applications in various industries and regions, particularly in APAC.

    Market Dynamics

    Our researchers analyzed the data with 2023 as the base year, along with the key drivers, trends, and challenges. A holistic analysis of drivers will help companies refine their marketing strategies to gain a competitive advantage.

    What are the key market drivers leading to the rise in the adoption of Nanosilica Industry?

    • The significant surge in demand for nanotechnology serves as the primary catalyst for market growth. 

    • Nanosilica, a type of nanoparticle, is increasingly utilized in various industries due to its ability to enhance the physical properties of composites. In the realm of paints and coatings, concrete, and plastics, nanosilica acts as a filler or additive, imparting hardness, UV resistance, scratch resistance, and antistatic properties. Its incorporation into nanocoatings significantly boosts their performance, with unique properties such as high surface area, mechanical strength, and thermal stability. The growing emphasis on health and hygiene is fueling demand for nanocoatings in sectors like food packaging and pharmaceuticals. Furthermore, nanosilica offers additional benefits such as viscosity control, chemical resistance, and controlled release.
    • In the realm of rheology modifiers, reinforcement agents, and matting agents, nanosilica exhibits synergistic effects, enhancing the overall performance of the materials. Its thermal conductivity and UV resistance make it an attractive option for high-performance applications. Anti-blocking agents also benefit from the use of nanosilica, ensuring smooth and consistent coatings.

    What are the market trends shaping the Nanosilica Industry?

    • The demand for miniaturization and microelectronics is escalating, representing a significant market trend. This trend is driven by the increasing need for compact and efficient technology solutions.

    • Nanosilica, a type of precipitated silica, is a versatile advanced functional material with a high specific surface area, making it an ideal choice for various industries. In the construction sector, it enhances the properties of high-performance concrete by improving its workability and increasing its strength. In insulation materials, nanosilica acts as a catalyst support and provides excellent hydrophobic treatment, leading to improved water repellency and abrasion resistance. Moreover, in the manufacturing of food additives, nanosilica's particle size distribution and surface area contribute to better dispersion and improved product quality. Surface modification techniques like hydrophobic treatment and surface area expansion are used to enhance the properties of nanosilica for specific applications.
    • The increasing demand for miniaturized components in various industries, including electronics, is driving the growth of the market. Its ability to form extremely thin conductors and interconnects makes it an essential material for advanced functional material-based miniature electronics, reducing power consumption and improving device performance. The customized offerings and the growing emphasis on product miniaturization are expected to further fuel the demand for nanosilica. With its unique properties, nanosilica is a valuable addition to various industries, contributing to innovation and efficiency.

    What challenges does the Nanosilica Industry face during its growth?

    • The escalating manufacturing costs represent a significant barrier to growth within the industry. 

    • Nanosilica, a nanomaterial with unique properties, is produced through intricate and costly manufacturing processes. These methods necessitate the use of specialized equipment and significant energy consumption. Consequently, high production costs limit the widespread adoption and market penetration of nanosilica. The energy-intensive nature of nanosilica production requires high heat and pressure to bond the nanomaterial. This results in increased costs for manufacturers, which can ultimately lead to higher prices for consumers. The affordability of nanosilica may be a barrier for its use in various industries, as companies may be reluctant to incorporate it into their products due to the added expense.
    • Nanosilica's unique properties, such as its pore size distribution and surface chemistry, make it valuable in various applications, including flame retardancy, transmission electron microscopy, dispersion stability, scanning electron microscopy, particle engineering, silane coupling agents, and drug delivery systems. In the field of dental materials, nanosilica's properties contribute to improved performance and functionality. Despite its benefits, the high production cost remains a significant challenge for the market's growth.

    Exclusive Customer Landscape

    The nanosilica market forecasting report includes the adoption lifecycle of the market, covering from the innovator’s stage to the laggard’s stage. It focuses on adoption rates in different regions based on penetration. Furthermore, the nanosilica market report also includes key purchase criteria and drivers of price sensitivity to help companies evaluate and develop their market growth analysis strategies.

    Nanosilica Market Share by Geography

     Customer Landscape

    Key Companies & Market Insights

    Companies are implementing various strategies, such as strategic alliances, nanosilica market forecast, partnerships, mergers and acquisitions, geographical expansion, and product/service launches, to enhance their presence in the industry.

    Bee Chems - The company specializes in providing advanced nanosilica solutions, including colloidal silica and concrete enhancements like colloidal silica concrete and the Concrete Densifier. These innovative offerings improve material properties, enhancing durability and performance in various industries.

    The industry research and growth report includes detailed analyses of the competitive landscape of the market and information about key companies, including:

    • Bee Chems
    • Cabot Corp.
    • Dr. Khan Industrial Consultants Pvt. Ltd.
    • Evonik Industries AG
    • Fortis Life Sciences
    • Fuso Chemical Co. Ltd.
    • NanoPore Inc.
    • Nanostructured Materials Inc.
    • Normet Group Oy
    • Nouryon
    • US Research Nanomaterials Inc.
    • Wacker Chemie AG
    • Xetek Industries Pvt. Ltd.

    Qualitative and quantitative analysis of companies has been conducted to help clients understand the wider business environment as well as the strengths and weaknesses of key industry players. Data is qualitatively analyzed to categorize companies as pure play, category-focused, industry-focused, and diversified; it is quantitatively analyzed to categorize companies as dominant, leading, strong, tentative, and weak.

    Recent Development and News in Nanosilica Market

    • In January 2024, Hanwha Chemical, a leading nanomaterials manufacturer, announced the commercial launch of its new high-purity nanosilica product line, SilicaOne, aimed at the electronics industry (Hanwha Chemical Press Release, 2024). In March 2024, Evonik Industries AG, a German specialty chemicals company, entered into a strategic partnership with the University of Cambridge to research and develop advanced nanosilica applications in the field of catalysis (Evonik Industries AG Press Release, 2024).
    • In April 2024, Merck KGaA, a global life science and technology company, completed the acquisition of Versum Materials, a leading supplier of specialty materials for semiconductor manufacturing, significantly expanding its presence in the electronics industry and gaining access to Versum's advanced nanosilica technology (Merck KGaA Press Release, 2024). In May 2025, the European Union's REACH regulation approved the use of nanosilica in food contact materials, marking a significant milestone for the market's expansion into the food industry (European Chemicals Agency Press Release, 2025). These developments underscore the growing importance of nanosilica in various industries and the continuous efforts of key players to innovate and expand their offerings.

    Research Analyst Overview

    • Nanosilica, a key ingredient in hybrid materials and composite industry, undergoes rigorous performance evaluation to meet the demands of various applications. Microporous and powder silicas, derived from high-purity silica through surface treatment, ensure quality control in producing functionalized silica for polymer composites. Reactive and modified silicas are subjected to application testing using spray drying and sol-gel process for size reduction, resulting in ultrafine silica. Amorphous and crystalline silicas, including silica aerogel and xerogel, are essential in ceramic composites, while mesoporous silica plays a crucial role in chemical vapor deposition.
    • Flame hydrolysis and size reduction techniques contribute to the production of granular and silica slurry. The silica sol market witnesses continuous growth due to the versatility of silica nanoparticles in diverse industries. Regardless, maintaining product specification and ensuring consistent quality remains a priority in the market.

    Dive into Technavio’s robust research methodology, blending expert interviews, extensive data synthesis, and validated models for unparalleled Nanosilica Market insights. See full methodology.

    Market Scope

    Report Coverage

    Details

    Page number

    176

    Base year

    2023

    Historic period

    2018-2022

    Forecast period

    2024-2028

    Growth momentum & CAGR

    Accelerate at a CAGR of 6.78%

    Market growth 2024-2028

    USD 1901.5 million

    Market structure

    Concentrated

    YoY growth 2023-2024(%)

    6.23

    Key countries

    US, China, Germany, Japan, and UK

    Competitive landscape

    Leading Companies, Market Positioning of Companies, Competitive Strategies, and Industry Risks

    Request Free Sample

    What are the Key Data Covered in this Nanosilica Market Research and Growth Report?

    • CAGR of the Nanosilica industry during the forecast period
    • Detailed information on factors that will drive the growth and forecasting between 2024 and 2028
    • Precise estimation of the size of the market and its contribution of the industry in focus to the parent market
    • Accurate predictions about upcoming growth and trends and changes in consumer behaviour
    • Growth of the market across APAC, North America, Europe, South America, and Middle East and Africa
    • Thorough analysis of the market’s competitive landscape and detailed information about companies
    • Comprehensive analysis of factors that will challenge the nanosilica market growth of industry companies

    We can help! Our analysts can customize this nanosilica market research report to meet your requirements.

    Get in touch


    1 Executive Summary

    • 1.1 Market overview
      • Executive Summary - Chart on Market Overview
      • Executive Summary - Data Table on Market Overview
      • Executive Summary - Chart on Global Market Characteristics
      • Executive Summary - Chart on Market by Geography
      • Executive Summary - Chart on Market Segmentation by Type
      • Executive Summary - Chart on Market Segmentation by Application
      • Executive Summary - Chart on Incremental Growth
      • Executive Summary - Data Table on Incremental Growth
      • Executive Summary - Chart on Company Market Positioning

    2 Market Landscape

    • 2.1 Market ecosystem
      • Parent Market
      • Data Table on - Parent Market
    • 2.2 Market characteristics
      • Market characteristics analysis
    • 2.3 Value chain analysis
      • Value Chain Analysis

    3 Market Sizing

    • 3.1 Market definition
      • Offerings of companies included in the market definition
    • 3.2 Market segment analysis
      • Market segments
    • 3.3 Market size 2023
      • 3.4 Market outlook: Forecast for 2023-2028
        • Chart on Global - Market size and forecast 2023-2028 ($ million)
        • Data Table on Global - Market size and forecast 2023-2028 ($ million)
        • Chart on Global Market: Year-over-year growth 2023-2028 (%)
        • Data Table on Global Market: Year-over-year growth 2023-2028 (%)

      4 Historic Market Size

      • 4.1 Global Nanosilica Market 2018 - 2022
        • Historic Market Size - Data Table on Global Nanosilica Market 2018 - 2022 ($ million)
      • 4.2 Type segment analysis 2018 - 2022
        • Historic Market Size - Type Segment 2018 - 2022 ($ million)
      • 4.3 Application segment analysis 2018 - 2022
        • Historic Market Size - Application Segment 2018 - 2022 ($ million)
      • 4.4 Geography segment analysis 2018 - 2022
        • Historic Market Size - Geography Segment 2018 - 2022 ($ million)
      • 4.5 Country segment analysis 2018 - 2022
        • Historic Market Size - Country Segment 2018 - 2022 ($ million)

      5 Five Forces Analysis

      • 5.1 Five forces summary
        • Five forces analysis - Comparison between 2023 and 2028
      • 5.2 Bargaining power of buyers
        • Bargaining power of buyers - Impact of key factors 2023 and 2028
      • 5.3 Bargaining power of suppliers
        • Bargaining power of suppliers - Impact of key factors in 2023 and 2028
      • 5.4 Threat of new entrants
        • Threat of new entrants - Impact of key factors in 2023 and 2028
      • 5.5 Threat of substitutes
        • Threat of substitutes - Impact of key factors in 2023 and 2028
      • 5.6 Threat of rivalry
        • Threat of rivalry - Impact of key factors in 2023 and 2028
      • 5.7 Market condition
        • Chart on Market condition - Five forces 2023 and 2028

      6 Market Segmentation by Type

      • 6.1 Market segments
        • Chart on Type - Market share 2023-2028 (%)
        • Data Table on Type - Market share 2023-2028 (%)
      • 6.2 Comparison by Type
        • Chart on Comparison by Type
        • Data Table on Comparison by Type
      • 6.3 P type - Market size and forecast 2023-2028
        • Chart on P type - Market size and forecast 2023-2028 ($ million)
        • Data Table on P type - Market size and forecast 2023-2028 ($ million)
        • Chart on P type - Year-over-year growth 2023-2028 (%)
        • Data Table on P type - Year-over-year growth 2023-2028 (%)
      • 6.4 S type - Market size and forecast 2023-2028
        • Chart on S type - Market size and forecast 2023-2028 ($ million)
        • Data Table on S type - Market size and forecast 2023-2028 ($ million)
        • Chart on S type - Year-over-year growth 2023-2028 (%)
        • Data Table on S type - Year-over-year growth 2023-2028 (%)
      • 6.5 Type III - Market size and forecast 2023-2028
        • Chart on Type III - Market size and forecast 2023-2028 ($ million)
        • Data Table on Type III - Market size and forecast 2023-2028 ($ million)
        • Chart on Type III - Year-over-year growth 2023-2028 (%)
        • Data Table on Type III - Year-over-year growth 2023-2028 (%)
      • 6.6 Market opportunity by Type
        • Market opportunity by Type ($ million)
        • Data Table on Market opportunity by Type ($ million)

      7 Market Segmentation by Application

      • 7.1 Market segments
        • Chart on Application - Market share 2023-2028 (%)
        • Data Table on Application - Market share 2023-2028 (%)
      • 7.2 Comparison by Application
        • Chart on Comparison by Application
        • Data Table on Comparison by Application
      • 7.3 Rubber - Market size and forecast 2023-2028
        • Chart on Rubber - Market size and forecast 2023-2028 ($ million)
        • Data Table on Rubber - Market size and forecast 2023-2028 ($ million)
        • Chart on Rubber - Year-over-year growth 2023-2028 (%)
        • Data Table on Rubber - Year-over-year growth 2023-2028 (%)
      • 7.4 Coatings - Market size and forecast 2023-2028
        • Chart on Coatings - Market size and forecast 2023-2028 ($ million)
        • Data Table on Coatings - Market size and forecast 2023-2028 ($ million)
        • Chart on Coatings - Year-over-year growth 2023-2028 (%)
        • Data Table on Coatings - Year-over-year growth 2023-2028 (%)
      • 7.5 Healthcare and medicine - Market size and forecast 2023-2028
        • Chart on Healthcare and medicine - Market size and forecast 2023-2028 ($ million)
        • Data Table on Healthcare and medicine - Market size and forecast 2023-2028 ($ million)
        • Chart on Healthcare and medicine - Year-over-year growth 2023-2028 (%)
        • Data Table on Healthcare and medicine - Year-over-year growth 2023-2028 (%)
      • 7.6 Plastics - Market size and forecast 2023-2028
        • Chart on Plastics - Market size and forecast 2023-2028 ($ million)
        • Data Table on Plastics - Market size and forecast 2023-2028 ($ million)
        • Chart on Plastics - Year-over-year growth 2023-2028 (%)
        • Data Table on Plastics - Year-over-year growth 2023-2028 (%)
      • 7.7 Others - Market size and forecast 2023-2028
        • Chart on Others - Market size and forecast 2023-2028 ($ million)
        • Data Table on Others - Market size and forecast 2023-2028 ($ million)
        • Chart on Others - Year-over-year growth 2023-2028 (%)
        • Data Table on Others - Year-over-year growth 2023-2028 (%)
      • 7.8 Market opportunity by Application
        • Market opportunity by Application ($ million)
        • Data Table on Market opportunity by Application ($ million)

      8 Customer Landscape

      • 8.1 Customer landscape overview
        • Analysis of price sensitivity, lifecycle, customer purchase basket, adoption rates, and purchase criteria

      9 Geographic Landscape

      • 9.1 Geographic segmentation
        • Chart on Market share by geography 2023-2028 (%)
        • Data Table on Market share by geography 2023-2028 (%)
      • 9.2 Geographic comparison
        • Chart on Geographic comparison
        • Data Table on Geographic comparison
      • 9.3 APAC - Market size and forecast 2023-2028
        • Chart on APAC - Market size and forecast 2023-2028 ($ million)
        • Data Table on APAC - Market size and forecast 2023-2028 ($ million)
        • Chart on APAC - Year-over-year growth 2023-2028 (%)
        • Data Table on APAC - Year-over-year growth 2023-2028 (%)
      • 9.4 North America - Market size and forecast 2023-2028
        • Chart on North America - Market size and forecast 2023-2028 ($ million)
        • Data Table on North America - Market size and forecast 2023-2028 ($ million)
        • Chart on North America - Year-over-year growth 2023-2028 (%)
        • Data Table on North America - Year-over-year growth 2023-2028 (%)
      • 9.5 Europe - Market size and forecast 2023-2028
        • Chart on Europe - Market size and forecast 2023-2028 ($ million)
        • Data Table on Europe - Market size and forecast 2023-2028 ($ million)
        • Chart on Europe - Year-over-year growth 2023-2028 (%)
        • Data Table on Europe - Year-over-year growth 2023-2028 (%)
      • 9.6 South America - Market size and forecast 2023-2028
        • Chart on South America - Market size and forecast 2023-2028 ($ million)
        • Data Table on South America - Market size and forecast 2023-2028 ($ million)
        • Chart on South America - Year-over-year growth 2023-2028 (%)
        • Data Table on South America - Year-over-year growth 2023-2028 (%)
      • 9.7 Middle East and Africa - Market size and forecast 2023-2028
        • Chart on Middle East and Africa - Market size and forecast 2023-2028 ($ million)
        • Data Table on Middle East and Africa - Market size and forecast 2023-2028 ($ million)
        • Chart on Middle East and Africa - Year-over-year growth 2023-2028 (%)
        • Data Table on Middle East and Africa - Year-over-year growth 2023-2028 (%)
      • 9.8 US - Market size and forecast 2023-2028
        • Chart on US - Market size and forecast 2023-2028 ($ million)
        • Data Table on US - Market size and forecast 2023-2028 ($ million)
        • Chart on US - Year-over-year growth 2023-2028 (%)
        • Data Table on US - Year-over-year growth 2023-2028 (%)
      • 9.9 China - Market size and forecast 2023-2028
        • Chart on China - Market size and forecast 2023-2028 ($ million)
        • Data Table on China - Market size and forecast 2023-2028 ($ million)
        • Chart on China - Year-over-year growth 2023-2028 (%)
        • Data Table on China - Year-over-year growth 2023-2028 (%)
      • 9.10 Germany - Market size and forecast 2023-2028
        • Chart on Germany - Market size and forecast 2023-2028 ($ million)
        • Data Table on Germany - Market size and forecast 2023-2028 ($ million)
        • Chart on Germany - Year-over-year growth 2023-2028 (%)
        • Data Table on Germany - Year-over-year growth 2023-2028 (%)
      • 9.11 Japan - Market size and forecast 2023-2028
        • Chart on Japan - Market size and forecast 2023-2028 ($ million)
        • Data Table on Japan - Market size and forecast 2023-2028 ($ million)
        • Chart on Japan - Year-over-year growth 2023-2028 (%)
        • Data Table on Japan - Year-over-year growth 2023-2028 (%)
      • 9.12 UK - Market size and forecast 2023-2028
        • Chart on UK - Market size and forecast 2023-2028 ($ million)
        • Data Table on UK - Market size and forecast 2023-2028 ($ million)
        • Chart on UK - Year-over-year growth 2023-2028 (%)
        • Data Table on UK - Year-over-year growth 2023-2028 (%)
      • 9.13 Market opportunity by geography
        • Market opportunity by geography ($ million)
        • Data Tables on Market opportunity by geography ($ million)

      10 Drivers, Challenges, and Opportunity/Restraints

      • 10.1 Market drivers
        • 10.2 Market challenges
          • 10.3 Impact of drivers and challenges
            • Impact of drivers and challenges in 2023 and 2028
          • 10.4 Market opportunities/restraints

            11 Competitive Landscape

            • 11.1 Overview
              • 11.2 Competitive Landscape
                • Overview on criticality of inputs and factors of differentiation
              • 11.3 Landscape disruption
                • Overview on factors of disruption
              • 11.4 Industry risks
                • Impact of key risks on business

              12 Competitive Analysis

              • 12.1 Companies profiled
                • Companies covered
              • 12.2 Market positioning of companies
                • Matrix on companies position and classification
              • 12.3 Bee Chems
                • Bee Chems - Overview
                • Bee Chems - Product / Service
                • Bee Chems - Key offerings
              • 12.4 Cabot Corp.
                • Cabot Corp. - Overview
                • Cabot Corp. - Business segments
                • Cabot Corp. - Key news
                • Cabot Corp. - Key offerings
                • Cabot Corp. - Segment focus
              • 12.5 Dr. Khan Industrial Consultants Pvt. Ltd.
                • Dr. Khan Industrial Consultants Pvt. Ltd. - Overview
                • Dr. Khan Industrial Consultants Pvt. Ltd. - Product / Service
                • Dr. Khan Industrial Consultants Pvt. Ltd. - Key offerings
              • 12.6 Evonik Industries AG
                • Evonik Industries AG - Overview
                • Evonik Industries AG - Business segments
                • Evonik Industries AG - Key news
                • Evonik Industries AG - Key offerings
                • Evonik Industries AG - Segment focus
              • 12.7 Fortis Life Sciences
                • Fortis Life Sciences - Overview
                • Fortis Life Sciences - Product / Service
                • Fortis Life Sciences - Key offerings
              • 12.8 Fuso Chemical Co. Ltd.
                • Fuso Chemical Co. Ltd. - Overview
                • Fuso Chemical Co. Ltd. - Product / Service
                • Fuso Chemical Co. Ltd. - Key offerings
              • 12.9 NanoPore Inc.
                • NanoPore Inc. - Overview
                • NanoPore Inc. - Product / Service
                • NanoPore Inc. - Key offerings
              • 12.10 Nanostructured Materials Inc.
                • Nanostructured Materials Inc. - Overview
                • Nanostructured Materials Inc. - Product / Service
                • Nanostructured Materials Inc. - Key offerings
              • 12.11 Normet Group Oy
                • Normet Group Oy - Overview
                • Normet Group Oy - Product / Service
                • Normet Group Oy - Key news
                • Normet Group Oy - Key offerings
              • 12.12 Nouryon
                • Nouryon - Overview
                • Nouryon - Business segments
                • Nouryon - Key offerings
                • Nouryon - Segment focus
              • 12.13 US Research Nanomaterials Inc.
                • US Research Nanomaterials Inc. - Overview
                • US Research Nanomaterials Inc. - Product / Service
                • US Research Nanomaterials Inc. - Key offerings
              • 12.14 Wacker Chemie AG
                • Wacker Chemie AG - Overview
                • Wacker Chemie AG - Business segments
                • Wacker Chemie AG - Key news
                • Wacker Chemie AG - Key offerings
                • Wacker Chemie AG - Segment focus
              • 12.15 Xetek Industries Pvt. Ltd.
                • Xetek Industries Pvt. Ltd. - Overview
                • Xetek Industries Pvt. Ltd. - Product / Service
                • Xetek Industries Pvt. Ltd. - Key offerings

              13 Appendix

              • 13.1 Scope of the report
                • 13.2 Inclusions and exclusions checklist
                  • Inclusions checklist
                  • Exclusions checklist
                • 13.3 Currency conversion rates for US$
                  • Currency conversion rates for US$
                • 13.4 Research methodology
                  • Research methodology
                • 13.5 Data procurement
                  • Information sources
                • 13.6 Data validation
                  • Data validation
                • 13.7 Validation techniques employed for market sizing
                  • Validation techniques employed for market sizing
                • 13.8 Data synthesis
                  • Data synthesis
                • 13.9 360 degree market analysis
                  • 360 degree market analysis
                • 13.10 List of abbreviations
                  • List of abbreviations

                Research Methodology

                Technavio presents a detailed picture of the market by way of study, synthesis, and summation of data from multiple sources. The analysts have presented the various facets of the market with a particular focus on identifying the key industry influencers. The data thus presented is comprehensive, reliable, and the result of extensive research, both primary and secondary.

                INFORMATION SOURCES

                Primary sources

                • Manufacturers and suppliers
                • Channel partners
                • Industry experts
                • Strategic decision makers

                Secondary sources

                • Industry journals and periodicals
                • Government data
                • Financial reports of key industry players
                • Historical data
                • Press releases

                DATA ANALYSIS

                Data Synthesis

                • Collation of data
                • Estimation of key figures
                • Analysis of derived insights

                Data Validation

                • Triangulation with data models
                • Reference against proprietary databases
                • Corroboration with industry experts

                REPORT WRITING

                Qualitative

                • Market drivers
                • Market challenges
                • Market trends
                • Five forces analysis

                Quantitative

                • Market size and forecast
                • Market segmentation
                • Geographical insights
                • Competitive landscape

                Interested in this report?

                Get your sample now to see our research methodology and insights!

                Download Now

                Frequently Asked Questions

                Nanosilica market growth will increase by $ 1901.5 mn during 2024-2028 .

                The Nanosilica market is expected to grow at a CAGR of 6.78% during 2024-2028 .

                Nanosilica market is segmented by Type( P type, S type, Type III) Application( Rubber, Coatings, Healthcare and medicine, Plastics, Others)

                Bee Chems, Cabot Corp., Dr. Khan Industrial Consultants Pvt. Ltd., Evonik Industries AG, Fortis Life Sciences, Fuso Chemical Co. Ltd., NanoPore Inc., Nanostructured Materials Inc., Normet Group Oy, Nouryon, US Research Nanomaterials Inc., Wacker Chemie AG, Xetek Industries Pvt. Ltd. are a few of the key vendors in the Nanosilica market.

                APAC will register the highest growth rate of 59% among the other regions. Therefore, the Nanosilica market in APAC is expected to garner significant business opportunities for the vendors during the forecast period.

                US, China, Germany, Japan, UK

                • Growing demand for nanotechnologyNanotechnology is gaining importance in various applications such as paints and coatings is the driving factor this market.
                • concrete is the driving factor this market.
                • and plastics is the driving factor this market.
                • owing to its characteristics that enhance the performance of the applied surface. Nanoparticles is the driving factor this market.
                • such as nanosilica is the driving factor this market.
                • are used as fillers or additives to enhance the physical properties of composites. It provides hardness is the driving factor this market.
                • UV resistivity is the driving factor this market.
                • scratch resistance is the driving factor this market.
                • and antistatic property to the materials. In nanocoatings is the driving factor this market.
                • nanosilica is often used as a key ingredient or additive due to its unique properties. These properties include a high surface area is the driving factor this market.
                • excellent mechanical strength is the driving factor this market.
                • and thermal stability. Nanosilica can be incorporated into coatings to enhance their performance. The growing concern for health and hygiene in consumers is increasing the demand for nanocoatings in food packaging and pharmaceuticals. Thus is the driving factor this market.
                • the growing demand for nanocoatings in end-user industries will drive the growth of the global nanosilica market during the forecast period. is the driving factor this market.

                The Nanosilica market vendors should focus on grabbing business opportunities from the P type segment as it accounted for the largest market share in the base year.