Nanotechnology Products Market Analysis, Size, and Forecast 2025-2029: North America (US and Canada), Europe (France, Germany, Italy, UK), APAC (China, India, Japan, South Korea), Middle East and Africa , and South America

Nanotechnology Products Market Analysis, Size, and Forecast 2025-2029:
North America (US and Canada), Europe (France, Germany, Italy, UK), APAC (China, India, Japan, South Korea), Middle East and Africa , and South America

Published: Apr 2025 221 Pages SKU: IRTNTR75332

Market Overview at a Glance

$211.1 B
Market Opportunity
20.3%
CAGR
16.6
YoY growth 2024-2025(%)

Nanotechnology Products Market Size 2025-2029

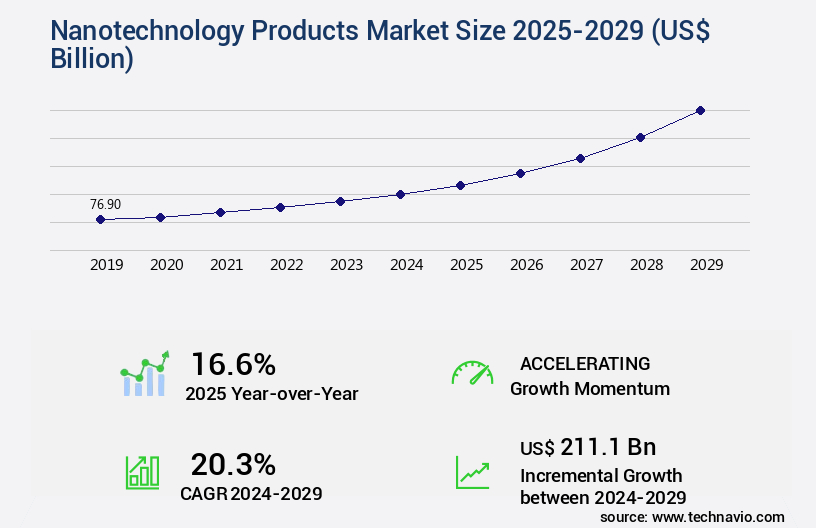
The nanotechnology products market size is valued to increase USD 211.1 billion, at a CAGR of 20.3% from 2024 to 2029. Increasing adoption of novel nanotechnology tools to boost agricultural productivity will drive the nanotechnology products market.

Major Market Trends & Insights

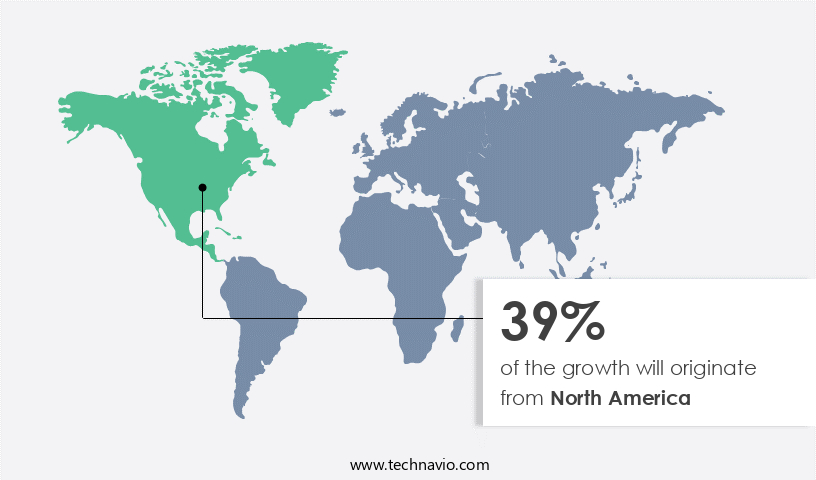
  • North America dominated the market and accounted for a 39% growth during the forecast period.
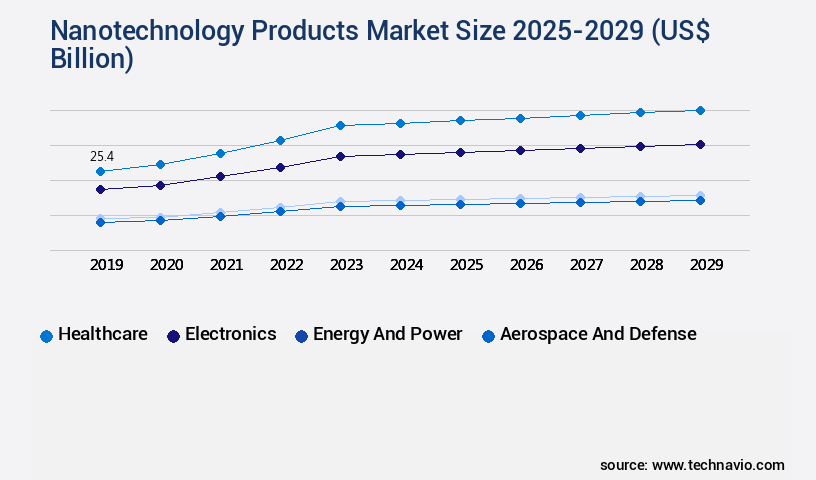
  • By Application - Healthcare segment was valued at USD 25.40 billion in 2023
  • By Product - Nanomaterial segment accounted for the largest market revenue share in 2023

Market Size & Forecast

  • Market Opportunities: USD 354.88 billion
  • Market Future Opportunities: USD 211.10 billion
  • CAGR : 20.3%
  • North America: Largest market in 2023

Market Summary

  • The market represents a dynamic and innovative industry, driven by advancements in core technologies and applications. Key technologies, such as carbon nanotubes and quantum dots, continue to revolutionize various sectors, including electronics, healthcare, and energy. For instance, the increasing adoption of novel nanotechnology tools is boosting agricultural productivity by enhancing crop yield and improving soil quality. In addition, the growing demand for carbon nanotube-based touchscreens is fueling the expansion of the consumer electronics market. However, the high cost of production remains a significant challenge, limiting the market's growth potential.
  • According to a recent study, the nanotechnology market is expected to account for over 15% of the global advanced materials market by 2025. Despite the challenges, the market's continuous evolution offers ample opportunities for companies to innovate and expand their offerings.

What will be the Size of the Nanotechnology Products Market during the forecast period?

Nanotechnology Products Market Size

Get Key Insights on Market Forecast (PDF) Request Free Sample

How is the Nanotechnology Products Market Segmented and what are the key trends of market segmentation?

The nanotechnology products industry research report provides comprehensive data (region-wise segment analysis), with forecasts and estimates in "USD billion" for the period 2025-2029, as well as historical data from 2019-2023 for the following segments.

  • Application
    • Healthcare
    • Electronics
    • Energy and power
    • Aerospace and defense
    • Others
  • Product
    • Nanomaterial
    • Nanodevices
    • Nano tools
  • Geography
    • North America
      • US
      • Canada
    • Europe
      • France
      • Germany
      • Italy
      • UK
    • APAC
      • China
      • India
      • Japan
      • South Korea
    • Rest of World (ROW)

By Application Insights

The healthcare segment is estimated to witness significant growth during the forecast period.

Nanotechnology products have significantly impacted various industries, with healthcare being the largest segment in 2024. In this sector, nanotechnology's applications span regenerative medicine, wound treatment, and drug delivery systems. For instance, nanofibers, a type of nanotechnology product, are extensively used in tissue engineering for scaffolding. Their high surface-to-volume ratio and complex mesh structure make nanofibers ideal for preventing bacteria from entering wounds in tissue re-engineering. Moreover, nanofibers are also employed in liquid bandage sprays, providing an effective barrier against infections. The nanotechnology market's growth is driven by the continuous advancements in nanomaterial synthesis techniques, such as nanoparticle synthesis and self-assembled monolayers.

These techniques enable the production of nanoparticles, including metallic nanoparticles and polymer nanoparticles, which have diverse applications. For example, metallic nanoparticles are crucial components in imaging techniques like quantum dots imaging and x-ray diffraction. Meanwhile, polymer nanoparticles are used in microfluidic devices and targeted therapies. The nanotechnology industry's future growth is promising, with expectations of expansion in sectors like nanomedicine, materials science, and biosensors development. Nanotechnology's optical properties, thermal conductivity, and surface plasmon resonance make it a valuable resource in these areas. Furthermore, nanomaterial characterization techniques, such as atomic force microscopy and lithographic techniques, will continue to play a pivotal role in advancing nanotechnology applications.

In nanomedicine, nanoparticles are used for drug delivery systems, enabling controlled drug release and improving therapeutic efficacy. Surface modification techniques, like surface plasmon resonance, are employed to enhance the bioavailability and targeting of nanoparticles. Magnetic nanoparticles are another essential component in nanomedicine, contributing to imaging contrast agents and targeted therapies. The nanotechnology market's ongoing evolution is marked by the development of advanced materials and fabrication techniques, such as nanoscale patterning and nanofabrication. These techniques enable the creation of high-performance materials with unique properties, like graphene oxide and carbon nanotubes. These materials are used in various applications, including tissue engineering, catalysis, and energy storage.

Despite the numerous benefits, nanotechnology products face challenges, including nanoparticle toxicity and ethical concerns. Researchers are actively working on addressing these issues through surface modification techniques and rigorous safety assessments. In summary, the market is experiencing significant growth and innovation, driven by advancements in nanomaterial synthesis techniques and applications in various industries, including healthcare, nanomedicine, and materials science. The ongoing research and development in this field will continue to unfold new opportunities and challenges, making it an exciting area for businesses to explore. Based on recent reports, the healthcare sector accounted for approximately 45% of the market share in 2024.

Furthermore, the market is projected to expand at a rate of around 12% annually in the coming years, with nanomedicine applications being a major contributor to this growth.

Nanotechnology Products Market Size

Request Free Sample

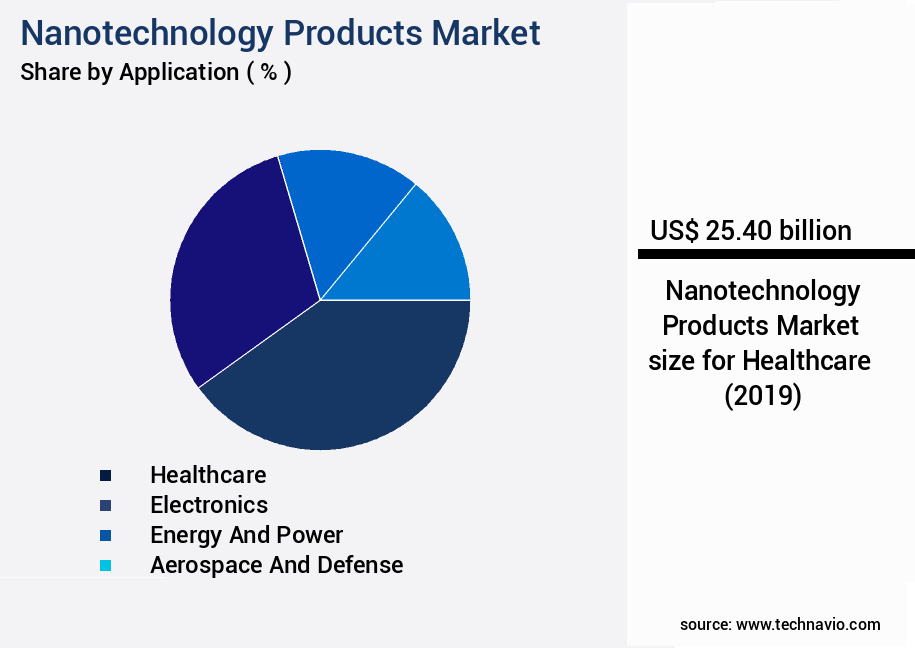
The Healthcare segment was valued at USD 25.40 billion in 2019 and showed a gradual increase during the forecast period.

Nanotechnology Products Market Size

Request Free Sample

Regional Analysis

North America is estimated to contribute 39% to the growth of the global market during the forecast period.Technavio's analysts have elaborately explained the regional trends and drivers that shape the market during the forecast period.

Nanotechnology Products Market Share by Geography

See How Nanotechnology Products Market Demand is Rising in North America Request Free Sample

In The market, North America emerged as the leading region in 2024, driven by the electronics industry's expansion and technological advancements. This growth is further fueled by the increasing production and sales of battery electric vehicles, as exemplified by Tesla's expansion of its Gigafactory in Texas. The nanotechnology market in North America is expected to continue its dominance during the forecast period due to the region's robust manufacturing sector for tailored polymers.

This sector's growth is a significant contributor to the regional market's expansion.

Market Dynamics

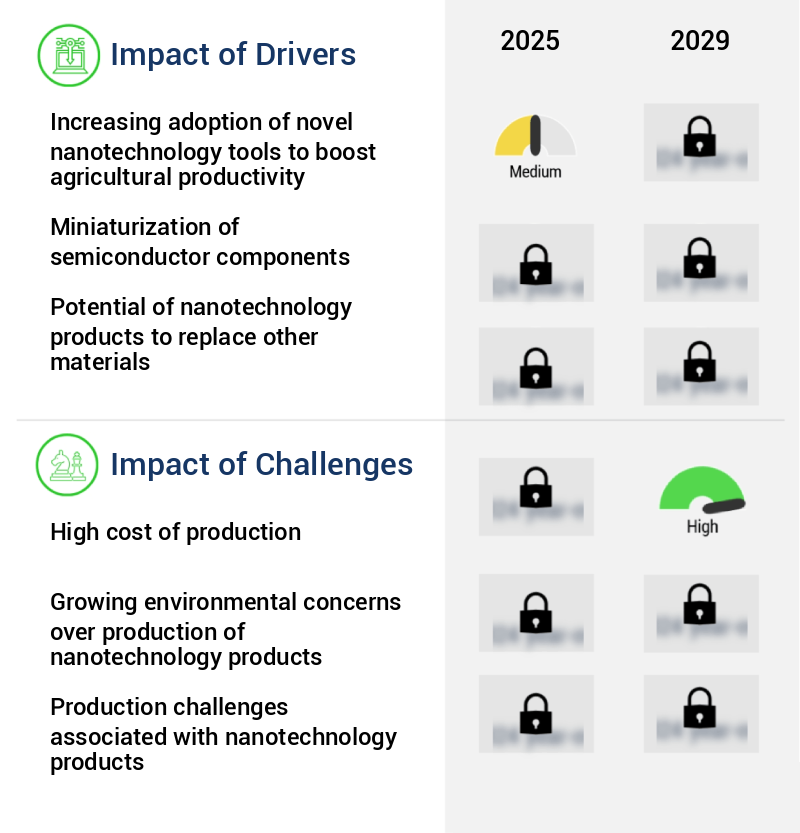
Our researchers analyzed the data with 2024 as the base year, along with the key drivers, trends, and challenges. A holistic analysis of drivers will help companies refine their marketing strategies to gain a competitive advantage.

The market encompasses a diverse range of applications, from healthcare and electronics to energy and materials science. One of the most promising areas is nanotechnology in healthcare, where innovations such as quantum dots for cancer imaging and nanoparticle drug delivery systems are revolutionizing diagnosis and treatment. In cancer imaging, quantum dots offer superior sensitivity and specificity compared to traditional imaging methods, enabling early detection and more effective therapy. Nanoparticles, meanwhile, can significantly enhance drug delivery efficiency by targeting specific cells and improving bioavailability. Surface modification for biocompatibility is another critical aspect of nanotechnology in healthcare. For instance, carbon nanotubes have shown great potential in electronics due to their unique electrical properties.

However, their use in biomedical applications requires addressing biocompatibility concerns. Graphene oxide-based biosensors are another example of nanotechnology's potential in healthcare, offering high sensitivity and selectivity for various biomolecules. In the field of tissue regeneration, nanofibrous scaffolds are gaining popularity due to their ability to mimic the natural extracellular matrix. Metallic nanoparticles are also finding applications in catalysis, while polymer nanoparticles are being explored for gene delivery. Nanoscale fabrication techniques for microchips and nanofluidic devices for diagnostics are driving innovation in the electronics industry. The in vivo biodistribution and cytotoxicity assessment of nanoparticles are crucial areas of research, as understanding their behavior in the body can help optimize their therapeutic efficacy.

Drug loading and release from nanoparticles can be precisely controlled, leading to improved therapeutic outcomes. Nanoscale patterning for flexible electronics and surface plasmon resonance biosensing are other exciting applications of nanotechnology. Colloidal nanoparticles stability and self-assembled monolayers for sensors are essential considerations in the development and application of nanotechnology. Atomic force microscopy imaging and x-ray diffraction analysis of nanomaterials provide valuable insights into their structure and properties. Electron microscopy characterization is crucial for understanding the morphology and composition of nanomaterials. Despite the vast potential of nanotechnology, challenges remain, including safety concerns and regulatory hurdles. However, the market's growth is significant, with adoption rates in healthcare applications nearly double those in other sectors.

This underscores the immense potential of nanotechnology to transform various industries and improve our lives.

Nanotechnology Products Market Size

What are the key market drivers leading to the rise in the adoption of Nanotechnology Products Industry?

  • The significant expansion of nanotechnology adoption in agriculture, characterized by the implementation of innovative tools, is the primary market catalyst, driving productivity enhancements. 
  • The global population surge, which has grown from 7.34 billion in 2015 to around 8 billion in 2024, according to World Bank data, necessitates advanced agricultural productivity solutions. Traditional farming methods struggle to meet the increasing food demand, as they are insufficient to overcome climate change challenges, such as droughts and floods. These environmental adversities negatively impact the agriculture sector. To address these issues, innovative agricultural technologies are gaining traction. For instance, precision farming, which utilizes data-driven insights, is becoming increasingly popular.
  • This approach optimizes resource usage, enhancing productivity while minimizing environmental impact. Additionally, vertical farming, which uses controlled environments to grow crops, is another promising solution. It allows for year-round production, reducing dependence on weather conditions and expanding agricultural capacity. These technological advancements are crucial in ensuring food security amidst a growing population and evolving climate challenges.

What are the market trends shaping the Nanotechnology Products Industry?

  • The growing demand for touchscreens based on carbon nanotubes represents an emerging market trend. Carbon nanotube technology is poised to revolutionize the touchscreen industry due to its increasing popularity.
  • Touchscreens, a crucial interface for various devices, have witnessed significant advancements since the transition from push-button and physical keypads. Initially, mobile devices featured these traditional inputs. However, touchscreens' simplicity and ease of use have led to their widespread adoption. These touchscreens recognize contact, enabling their integration into various applications, such as ATMs, kiosks, television, and monitors. The touchscreen market's evolution is marked by the replacement of indium tin oxide (ITO) materials with single-walled carbon nanotubes (SWCNTs). ITO-based materials, while effective, have limitations, including lower transparency and resistivity.
  • In contrast, SWCNTs offer a transparency rate of 99% and superior electrical conductivity. This enhancement in properties makes SWCNTs a promising alternative for touchscreen manufacturing. The shift towards SWCNTs signifies the continuous innovation in touchscreen technology, catering to the evolving demands of diverse industries.

What challenges does the Nanotechnology Products Industry face during its growth?

  • The high cost of production is a significant challenge that can hinder industry growth. In order to maintain competitiveness and profitability, companies must continually seek ways to minimize production costs while maintaining quality. This may involve investing in more efficient technology, negotiating better supplier contracts, or implementing lean manufacturing processes. By effectively managing production costs, businesses can improve their bottom line and contribute to the overall growth of the industry. 
  • The high cost of manufacturing nanotechnology products, particularly carbon nanotubes, poses a significant challenge to the expansion of this market. The production of nanotechnology items and electrically conductive nanoparticles necessitates substantial capital investment, as companies require various types of manufacturing equipment, microscopes, power sources, probes, and cleanrooms. Moreover, the procurement of raw materials for nanotechnology research and product creation is expensive, contributing to market growth limitations.
  • Despite these challenges, the nanotechnology industry continues to evolve, with innovations in alternative manufacturing methods and the exploration of new applications across various sectors, such as healthcare, electronics, and energy. The potential benefits of nanotechnology, including increased efficiency, enhanced performance, and new product possibilities, make it a promising area for future advancements.

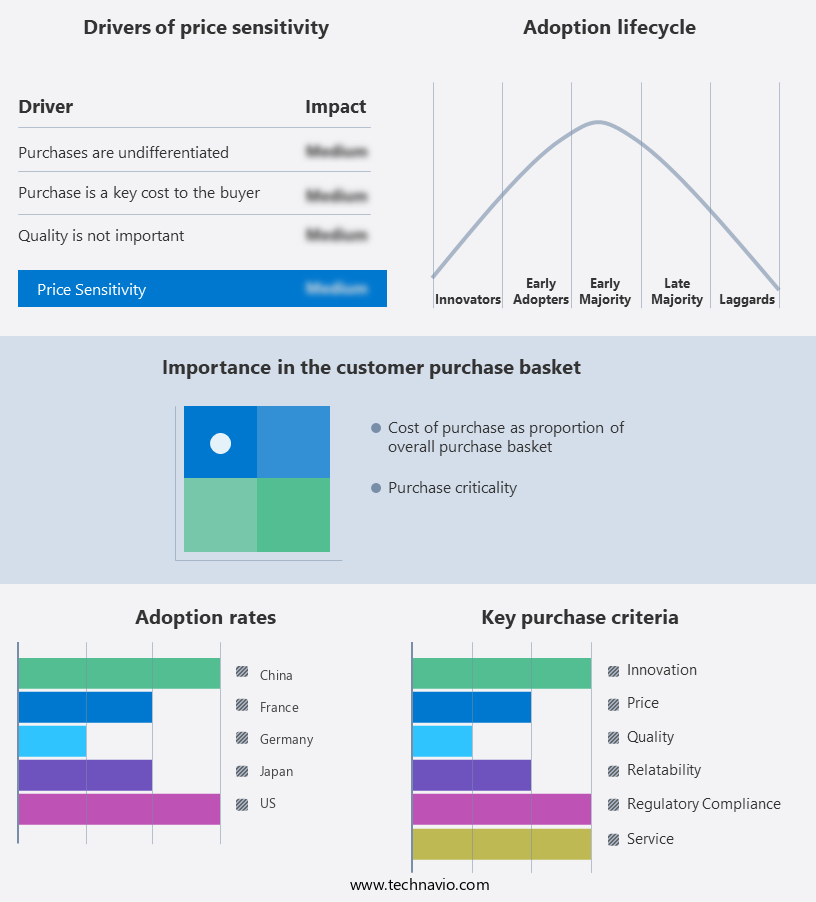
Exclusive Technavio Analysis on Customer Landscape

The nanotechnology products market forecasting report includes the adoption lifecycle of the market, covering from the innovator's stage to the laggard's stage. It focuses on adoption rates in different regions based on penetration. Furthermore, the nanotechnology products market report also includes key purchase criteria and drivers of price sensitivity to help companies evaluate and develop their market growth analysis strategies.

Nanotechnology Products Market Share by Geography

 Customer Landscape of Nanotechnology Products Industry

Competitive Landscape

Companies are implementing various strategies, such as strategic alliances, nanotechnology products market forecast, partnerships, mergers and acquisitions, geographical expansion, and product/service launches, to enhance their presence in the industry.

3M Co. - This company specializes in nanotechnology innovations, producing products such as 3M Brightness Enhancement Film, Filtek One, and 3M Matrix Resin, enhancing various industries with advanced technology solutions.

The industry research and growth report includes detailed analyses of the competitive landscape of the market and information about key companies, including:

  • 3M Co.
  • Advanced Nano Products Co. Ltd.
  • Applied Materials Inc.
  • Arkema
  • BASF SE
  • Bruker Corp.
  • Covestro AG
  • DuPont de Nemours Inc.
  • Kleindiek Nanotechnik GmbH
  • Nano C Inc.
  • Nano Magic Inc.
  • Nanophase Technologies Corp.
  • Nanosys Inc.
  • PPG Industries Inc.
  • Smiths Group Plc
  • Synopsys Inc.
  • Taiwan Semiconductor Manufacturing Co. Ltd.
  • The Dow Chemical Co.
  • Thermo Fisher Scientific Inc.
  • Zyvex Corp.

Qualitative and quantitative analysis of companies has been conducted to help clients understand the wider business environment as well as the strengths and weaknesses of key industry players. Data is qualitatively analyzed to categorize companies as pure play, category-focused, industry-focused, and diversified; it is quantitatively analyzed to categorize companies as dominant, leading, strong, tentative, and weak.

Recent Development and News in Nanotechnology Products Market

  • In January 2024, Carbon Nanotechnologies, Inc. Announced the commercial launch of their new line of high-performance nanocoatings for the automotive industry, following successful trials with major automakers (Carbon Nanotechnologies, Inc. Press release). In March 2024, Intel and Taiwan Semiconductor Manufacturing Company (TSMC) entered into a strategic collaboration to co-develop advanced nanotechnology for next-generation semiconductors (Intel press release). In April 2025, Nanosys, Inc. Secured a USD50 million Series D funding round, led by new investor BASF, to expand its nanomaterial production capacity and accelerate product development (Nanosys, Inc. Press release). In May 2025, the European Union passed the Horizon Europe regulatory framework, which includes a €100 billion budget for research and innovation initiatives, with a focus on nanotechnology and advanced materials (European Commission press release).

Dive into Technavio's robust research methodology, blending expert interviews, extensive data synthesis, and validated models for unparalleled Nanotechnology Products Market insights. See full methodology.

Market Scope

Report Coverage

Details

Page number

221

Base year

2024

Historic period

2019-2023

Forecast period

2025-2029

Growth momentum & CAGR

Accelerate at a CAGR of 20.3%

Market growth 2025-2029

USD 211.1 billion

Market structure

Fragmented

YoY growth 2024-2025(%)

16.6

Key countries

US, China, Germany, Japan, France, UK, Canada, India, South Korea, and Italy

Competitive landscape

Leading Companies, Market Positioning of Companies, Competitive Strategies, and Industry Risks

Request Free Sample

Research Analyst Overview

  • Nanotechnology, a rapidly evolving field, encompasses various applications of nanoscale materials, including polymer nanoparticles, metallic nanoparticles, self-assembled monolayers, colloidal nanoparticles, and quantum dots. These nanomaterials exhibit unique properties that distinguish them from their bulk counterparts, making them essential in numerous industries. One significant area of application is in imaging technologies, such as electron microscopy and X-ray diffraction, which rely on nanoparticles for enhanced contrast and resolution. In nanoparticle synthesis, researchers employ various techniques, like lithographic methods and self-assembly, to create materials with precise dimensions and structures. Metallic nanoparticles, for instance, exhibit unusual optical properties due to their size, making them suitable for use in microfluidic devices and biosensors development.
  • Meanwhile, carbon nanotubes and graphene oxide are popular choices for nanoscale fabrication and tissue engineering applications. In the realm of materials science, nanotechnology has led to advancements in nanofibrous scaffolds, controlled drug release systems, and surface modification techniques. These innovations have opened doors to new possibilities in nanomedicine applications, including targeted therapies and imaging contrast agents. Moreover, magnetic nanoparticles have gained considerable attention for their role in drug delivery systems and nanomaterial characterization. Surface plasmon resonance and atomic force microscopy are essential tools in the study and manipulation of these materials at the nanoscale. Despite the numerous benefits, nanotechnology faces challenges, particularly in addressing nanoparticle toxicity and ensuring safe and effective implementation in various applications.
  • Continuous research and development efforts are underway to mitigate these concerns and expand the potential of nanotechnology. In summary, nanotechnology is a dynamic and evolving field, with ongoing research and market activities shaping its future. From imaging technologies to materials science and nanomedicine, nanotechnology's impact is felt across various industries, driving innovation and progress.

What are the Key Data Covered in this Nanotechnology Products Market Research and Growth Report?

  • What is the expected growth of the Nanotechnology Products Market between 2025 and 2029?

    • USD 211.1 billion, at a CAGR of 20.3%

  • What segmentation does the market report cover?

    • The report segmented by Application (Healthcare, Electronics, Energy and power, Aerospace and defense, and Others), Product (Nanomaterial, Nanodevices, and Nano tools), and Geography (North America, Europe, APAC, Middle East and Africa, and South America)

  • Which regions are analyzed in the report?

    • North America, Europe, APAC, Middle East and Africa, and South America

  • What are the key growth drivers and market challenges?

    • Increasing adoption of novel nanotechnology tools to boost agricultural productivity, High cost of production

  • Who are the major players in the Nanotechnology Products Market?

    • Key Companies 3M Co., Advanced Nano Products Co. Ltd., Applied Materials Inc., Arkema, BASF SE, Bruker Corp., Covestro AG, DuPont de Nemours Inc., Kleindiek Nanotechnik GmbH, Nano C Inc., Nano Magic Inc., Nanophase Technologies Corp., Nanosys Inc., PPG Industries Inc., Smiths Group Plc, Synopsys Inc., Taiwan Semiconductor Manufacturing Co. Ltd., The Dow Chemical Co., Thermo Fisher Scientific Inc., and Zyvex Corp.

Market Research Insights

  • The market encompasses a diverse range of applications, from cytotoxicity studies in waste management to sustainable synthesis in drug development. According to industry estimates, the global nanotechnology market size was valued at USD1.1 trillion in 2020, with a projected compound annual growth rate (CAGR) of 14.5% from 2021 to 2028. This growth is driven by advancements in areas such as drug loading capacity, in vitro efficacy, and surface area analysis. For instance, nanoparticles used in drug delivery systems can significantly increase the therapeutic index by improving target specificity and release kinetics. However, challenges remain, including regulatory compliance, clinical trials, and scalable manufacturing.
  • For example, the environmental impact of nanotechnology production and disposal must be addressed, as well as the mechanical properties and stability studies of nanomaterials. Despite these challenges, the market continues to evolve, with ongoing research in areas such as sensitivity enhancement, imaging resolution, and porosity measurement. The nanotechnology market's potential for innovation and impact is vast, with applications spanning from healthcare to energy and electronics.

We can help! Our analysts can customize this nanotechnology products market research report to meet your requirements.

Get in touch

1 Executive Summary

  • 1.1 Market overview
    • Executive Summary - Chart on Market Overview
    • Executive Summary - Data Table on Market Overview
    • Executive Summary - Chart on Global Market Characteristics
    • Executive Summary - Chart on Market by Geography
    • Executive Summary - Chart on Market Segmentation by Application
    • Executive Summary - Chart on Market Segmentation by Product
    • Executive Summary - Chart on Incremental Growth
    • Executive Summary - Data Table on Incremental Growth
    • Executive Summary - Chart on Company Market Positioning

2 Technavio Analysis

  • 2.1 Analysis of price sensitivity, lifecycle, customer purchase basket, adoption rates, and purchase criteria
    • Analysis of price sensitivity, lifecycle, customer purchase basket, adoption rates, and purchase criteria
  • 2.2 Criticality of inputs and Factors of differentiation
    • Overview on criticality of inputs and factors of differentiation
  • 2.3 Factors of disruption
    • Overview on factors of disruption
  • 2.4 Impact of drivers and challenges
    • Impact of drivers and challenges in 2024 and 2029

3 Market Landscape

  • 3.1 Market ecosystem
    • Parent Market
    • Data Table on - Parent Market
  • 3.2 Market characteristics
    • Market characteristics analysis
  • 3.3 Value chain analysis
    • Value chain analysis

4 Market Sizing

  • 4.1 Market definition
    • Offerings of companies included in the market definition
  • 4.2 Market segment analysis
    • Market segments
  • 4.3 Market size 2024
    • 4.4 Market outlook: Forecast for 2024-2029
      • Chart on Global - Market size and forecast 2024-2029 ($ billion)
      • Data Table on Global - Market size and forecast 2024-2029 ($ billion)
      • Chart on Global Market: Year-over-year growth 2024-2029 (%)
      • Data Table on Global Market: Year-over-year growth 2024-2029 (%)

    5 Historic Market Size

    • 5.1 Global Nanotechnology Products Market 2019 - 2023
      • Historic Market Size - Data Table on Global Nanotechnology Products Market 2019 - 2023 ($ billion)
    • 5.2 Application segment analysis 2019 - 2023
      • Historic Market Size - Application Segment 2019 - 2023 ($ billion)
    • 5.3 Product segment analysis 2019 - 2023
      • Historic Market Size - Product Segment 2019 - 2023 ($ billion)
    • 5.4 Geography segment analysis 2019 - 2023
      • Historic Market Size - Geography Segment 2019 - 2023 ($ billion)
    • 5.5 Country segment analysis 2019 - 2023
      • Historic Market Size - Country Segment 2019 - 2023 ($ billion)

    6 Qualitative Analysis

    • 6.1 The AI impact on Global Nanotechnology Products Market

      7 Five Forces Analysis

      • 7.1 Five forces summary
        • Five forces analysis - Comparison between 2024 and 2029
      • 7.2 Bargaining power of buyers
        • Bargaining power of buyers - Impact of key factors 2024 and 2029
      • 7.3 Bargaining power of suppliers
        • Bargaining power of suppliers - Impact of key factors in 2024 and 2029
      • 7.4 Threat of new entrants
        • Threat of new entrants - Impact of key factors in 2024 and 2029
      • 7.5 Threat of substitutes
        • Threat of substitutes - Impact of key factors in 2024 and 2029
      • 7.6 Threat of rivalry
        • Threat of rivalry - Impact of key factors in 2024 and 2029
      • 7.7 Market condition
        • Chart on Market condition - Five forces 2024 and 2029

      8 Market Segmentation by Application

      • 8.1 Market segments
        • Chart on Application - Market share 2024-2029 (%)
        • Data Table on Application - Market share 2024-2029 (%)
      • 8.2 Comparison by Application
        • Chart on Comparison by Application
        • Data Table on Comparison by Application
      • 8.3 Healthcare - Market size and forecast 2024-2029
        • Chart on Healthcare - Market size and forecast 2024-2029 ($ billion)
        • Data Table on Healthcare - Market size and forecast 2024-2029 ($ billion)
        • Chart on Healthcare - Year-over-year growth 2024-2029 (%)
        • Data Table on Healthcare - Year-over-year growth 2024-2029 (%)
      • 8.4 Electronics - Market size and forecast 2024-2029
        • Chart on Electronics - Market size and forecast 2024-2029 ($ billion)
        • Data Table on Electronics - Market size and forecast 2024-2029 ($ billion)
        • Chart on Electronics - Year-over-year growth 2024-2029 (%)
        • Data Table on Electronics - Year-over-year growth 2024-2029 (%)
      • 8.5 Energy and power - Market size and forecast 2024-2029
        • Chart on Energy and power - Market size and forecast 2024-2029 ($ billion)
        • Data Table on Energy and power - Market size and forecast 2024-2029 ($ billion)
        • Chart on Energy and power - Year-over-year growth 2024-2029 (%)
        • Data Table on Energy and power - Year-over-year growth 2024-2029 (%)
      • 8.6 Aerospace and defense - Market size and forecast 2024-2029
        • Chart on Aerospace and defense - Market size and forecast 2024-2029 ($ billion)
        • Data Table on Aerospace and defense - Market size and forecast 2024-2029 ($ billion)
        • Chart on Aerospace and defense - Year-over-year growth 2024-2029 (%)
        • Data Table on Aerospace and defense - Year-over-year growth 2024-2029 (%)
      • 8.7 Others - Market size and forecast 2024-2029
        • Chart on Others - Market size and forecast 2024-2029 ($ billion)
        • Data Table on Others - Market size and forecast 2024-2029 ($ billion)
        • Chart on Others - Year-over-year growth 2024-2029 (%)
        • Data Table on Others - Year-over-year growth 2024-2029 (%)
      • 8.8 Market opportunity by Application
        • Market opportunity by Application ($ billion)
        • Data Table on Market opportunity by Application ($ billion)

      9 Market Segmentation by Product

      • 9.1 Market segments
        • Chart on Product - Market share 2024-2029 (%)
        • Data Table on Product - Market share 2024-2029 (%)
      • 9.2 Comparison by Product
        • Chart on Comparison by Product
        • Data Table on Comparison by Product
      • 9.3 Nanomaterial - Market size and forecast 2024-2029
        • Chart on Nanomaterial - Market size and forecast 2024-2029 ($ billion)
        • Data Table on Nanomaterial - Market size and forecast 2024-2029 ($ billion)
        • Chart on Nanomaterial - Year-over-year growth 2024-2029 (%)
        • Data Table on Nanomaterial - Year-over-year growth 2024-2029 (%)
      • 9.4 Nanodevices - Market size and forecast 2024-2029
        • Chart on Nanodevices - Market size and forecast 2024-2029 ($ billion)
        • Data Table on Nanodevices - Market size and forecast 2024-2029 ($ billion)
        • Chart on Nanodevices - Year-over-year growth 2024-2029 (%)
        • Data Table on Nanodevices - Year-over-year growth 2024-2029 (%)
      • 9.5 Nano tools - Market size and forecast 2024-2029
        • Chart on Nano tools - Market size and forecast 2024-2029 ($ billion)
        • Data Table on Nano tools - Market size and forecast 2024-2029 ($ billion)
        • Chart on Nano tools - Year-over-year growth 2024-2029 (%)
        • Data Table on Nano tools - Year-over-year growth 2024-2029 (%)
      • 9.6 Market opportunity by Product
        • Market opportunity by Product ($ billion)
        • Data Table on Market opportunity by Product ($ billion)

      10 Customer Landscape

      • 10.1 Customer landscape overview
        • Analysis of price sensitivity, lifecycle, customer purchase basket, adoption rates, and purchase criteria

      11 Geographic Landscape

      • 11.1 Geographic segmentation
        • Chart on Market share by geography 2024-2029 (%)
        • Data Table on Market share by geography 2024-2029 (%)
      • 11.2 Geographic comparison
        • Chart on Geographic comparison
        • Data Table on Geographic comparison
      • 11.3 North America - Market size and forecast 2024-2029
        • Chart on North America - Market size and forecast 2024-2029 ($ billion)
        • Data Table on North America - Market size and forecast 2024-2029 ($ billion)
        • Chart on North America - Year-over-year growth 2024-2029 (%)
        • Data Table on North America - Year-over-year growth 2024-2029 (%)
      • 11.4 Europe - Market size and forecast 2024-2029
        • Chart on Europe - Market size and forecast 2024-2029 ($ billion)
        • Data Table on Europe - Market size and forecast 2024-2029 ($ billion)
        • Chart on Europe - Year-over-year growth 2024-2029 (%)
        • Data Table on Europe - Year-over-year growth 2024-2029 (%)
      • 11.5 APAC - Market size and forecast 2024-2029
        • Chart on APAC - Market size and forecast 2024-2029 ($ billion)
        • Data Table on APAC - Market size and forecast 2024-2029 ($ billion)
        • Chart on APAC - Year-over-year growth 2024-2029 (%)
        • Data Table on APAC - Year-over-year growth 2024-2029 (%)
      • 11.6 Middle East and Africa - Market size and forecast 2024-2029
        • Chart on Middle East and Africa - Market size and forecast 2024-2029 ($ billion)
        • Data Table on Middle East and Africa - Market size and forecast 2024-2029 ($ billion)
        • Chart on Middle East and Africa - Year-over-year growth 2024-2029 (%)
        • Data Table on Middle East and Africa - Year-over-year growth 2024-2029 (%)
      • 11.7 South America - Market size and forecast 2024-2029
        • Chart on South America - Market size and forecast 2024-2029 ($ billion)
        • Data Table on South America - Market size and forecast 2024-2029 ($ billion)
        • Chart on South America - Year-over-year growth 2024-2029 (%)
        • Data Table on South America - Year-over-year growth 2024-2029 (%)
      • 11.8 US - Market size and forecast 2024-2029
        • Chart on US - Market size and forecast 2024-2029 ($ billion)
        • Data Table on US - Market size and forecast 2024-2029 ($ billion)
        • Chart on US - Year-over-year growth 2024-2029 (%)
        • Data Table on US - Year-over-year growth 2024-2029 (%)
      • 11.9 China - Market size and forecast 2024-2029
        • Chart on China - Market size and forecast 2024-2029 ($ billion)
        • Data Table on China - Market size and forecast 2024-2029 ($ billion)
        • Chart on China - Year-over-year growth 2024-2029 (%)
        • Data Table on China - Year-over-year growth 2024-2029 (%)
      • 11.10 Germany - Market size and forecast 2024-2029
        • Chart on Germany - Market size and forecast 2024-2029 ($ billion)
        • Data Table on Germany - Market size and forecast 2024-2029 ($ billion)
        • Chart on Germany - Year-over-year growth 2024-2029 (%)
        • Data Table on Germany - Year-over-year growth 2024-2029 (%)
      • 11.11 Japan - Market size and forecast 2024-2029
        • Chart on Japan - Market size and forecast 2024-2029 ($ billion)
        • Data Table on Japan - Market size and forecast 2024-2029 ($ billion)
        • Chart on Japan - Year-over-year growth 2024-2029 (%)
        • Data Table on Japan - Year-over-year growth 2024-2029 (%)
      • 11.12 France - Market size and forecast 2024-2029
        • Chart on France - Market size and forecast 2024-2029 ($ billion)
        • Data Table on France - Market size and forecast 2024-2029 ($ billion)
        • Chart on France - Year-over-year growth 2024-2029 (%)
        • Data Table on France - Year-over-year growth 2024-2029 (%)
      • 11.13 UK - Market size and forecast 2024-2029
        • Chart on UK - Market size and forecast 2024-2029 ($ billion)
        • Data Table on UK - Market size and forecast 2024-2029 ($ billion)
        • Chart on UK - Year-over-year growth 2024-2029 (%)
        • Data Table on UK - Year-over-year growth 2024-2029 (%)
      • 11.14 Canada - Market size and forecast 2024-2029
        • Chart on Canada - Market size and forecast 2024-2029 ($ billion)
        • Data Table on Canada - Market size and forecast 2024-2029 ($ billion)
        • Chart on Canada - Year-over-year growth 2024-2029 (%)
        • Data Table on Canada - Year-over-year growth 2024-2029 (%)
      • 11.15 India - Market size and forecast 2024-2029
        • Chart on India - Market size and forecast 2024-2029 ($ billion)
        • Data Table on India - Market size and forecast 2024-2029 ($ billion)
        • Chart on India - Year-over-year growth 2024-2029 (%)
        • Data Table on India - Year-over-year growth 2024-2029 (%)
      • 11.16 Italy - Market size and forecast 2024-2029
        • Chart on Italy - Market size and forecast 2024-2029 ($ billion)
        • Data Table on Italy - Market size and forecast 2024-2029 ($ billion)
        • Chart on Italy - Year-over-year growth 2024-2029 (%)
        • Data Table on Italy - Year-over-year growth 2024-2029 (%)
      • 11.17 South Korea - Market size and forecast 2024-2029
        • Chart on South Korea - Market size and forecast 2024-2029 ($ billion)
        • Data Table on South Korea - Market size and forecast 2024-2029 ($ billion)
        • Chart on South Korea - Year-over-year growth 2024-2029 (%)
        • Data Table on South Korea - Year-over-year growth 2024-2029 (%)
      • 11.18 Market opportunity by geography
        • Market opportunity by geography ($ billion)
        • Data Tables on Market opportunity by geography ($ billion)

      12 Drivers, Challenges, and Opportunity/Restraints

      • 12.1 Market drivers
        • 12.2 Market challenges
          • 12.3 Impact of drivers and challenges
            • Impact of drivers and challenges in 2024 and 2029
          • 12.4 Market opportunities/restraints

            13 Competitive Landscape

            • 13.1 Overview
              • 13.2 Competitive Landscape
                • Overview on criticality of inputs and factors of differentiation
              • 13.3 Landscape disruption
                • Overview on factors of disruption
              • 13.4 Industry risks
                • Impact of key risks on business

              14 Competitive Analysis

              • 14.1 Companies profiled
                • Companies covered
              • 14.2 Company ranking index
                • Company ranking index
              • 14.3 Market positioning of companies
                • Matrix on companies position and classification
              • 3M Co.
                • 3M Co. - Overview
                • 3M Co. - Business segments
                • 3M Co. - Key news
                • 3M Co. - Key offerings
                • 3M Co. - Segment focus
                • SWOT
              • 14.5 Applied Materials Inc.
                • Applied Materials Inc. - Overview
                • Applied Materials Inc. - Business segments
                • Applied Materials Inc. - Key offerings
                • Applied Materials Inc. - Segment focus
                • SWOT
              • 14.6 Arkema
                • Arkema - Overview
                • Arkema - Business segments
                • Arkema - Key news
                • Arkema - Key offerings
                • Arkema - Segment focus
                • SWOT
              • 14.7 BASF SE
                • BASF SE - Overview
                • BASF SE - Business segments
                • BASF SE - Key news
                • BASF SE - Key offerings
                • BASF SE - Segment focus
                • SWOT
              • 14.8 Bruker Corp.
                • Bruker Corp. - Overview
                • Bruker Corp. - Business segments
                • Bruker Corp. - Key news
                • Bruker Corp. - Key offerings
                • Bruker Corp. - Segment focus
                • SWOT
              • 14.9 Covestro AG
                • Covestro AG - Overview
                • Covestro AG - Business segments
                • Covestro AG - Key news
                • Covestro AG - Key offerings
                • Covestro AG - Segment focus
                • SWOT
              • 14.10 DuPont de Nemours Inc.
                • DuPont de Nemours Inc. - Overview
                • DuPont de Nemours Inc. - Business segments
                • DuPont de Nemours Inc. - Key news
                • DuPont de Nemours Inc. - Key offerings
                • DuPont de Nemours Inc. - Segment focus
                • SWOT
              • 14.11 Nano C Inc.
                • Nano C Inc. - Overview
                • Nano C Inc. - Product / Service
                • Nano C Inc. - Key offerings
                • SWOT
              • 14.12 Nano Magic Inc.
                • Nano Magic Inc. - Overview
                • Nano Magic Inc. - Product / Service
                • Nano Magic Inc. - Key offerings
                • SWOT
              • 14.13 PPG Industries Inc.
                • PPG Industries Inc. - Overview
                • PPG Industries Inc. - Business segments
                • PPG Industries Inc. - Key news
                • PPG Industries Inc. - Key offerings
                • PPG Industries Inc. - Segment focus
                • SWOT
              • 14.14 Smiths Group Plc
                • Smiths Group Plc - Overview
                • Smiths Group Plc - Business segments
                • Smiths Group Plc - Key news
                • Smiths Group Plc - Key offerings
                • Smiths Group Plc - Segment focus
                • SWOT
              • 14.15 Synopsys Inc.
                • Synopsys Inc. - Overview
                • Synopsys Inc. - Business segments
                • Synopsys Inc. - Key news
                • Synopsys Inc. - Key offerings
                • Synopsys Inc. - Segment focus
                • SWOT
              • 14.16 Taiwan Semiconductor Manufacturing Co. Ltd.
                • Taiwan Semiconductor Manufacturing Co. Ltd. - Overview
                • Taiwan Semiconductor Manufacturing Co. Ltd. - Product / Service
                • Taiwan Semiconductor Manufacturing Co. Ltd. - Key news
                • Taiwan Semiconductor Manufacturing Co. Ltd. - Key offerings
                • SWOT
              • 14.17 The Dow Chemical Co.
                • The Dow Chemical Co. - Overview
                • The Dow Chemical Co. - Business segments
                • The Dow Chemical Co. - Key news
                • The Dow Chemical Co. - Key offerings
                • The Dow Chemical Co. - Segment focus
                • SWOT
              • 14.18 Thermo Fisher Scientific Inc.
                • Thermo Fisher Scientific Inc. - Overview
                • Thermo Fisher Scientific Inc. - Business segments
                • Thermo Fisher Scientific Inc. - Key news
                • Thermo Fisher Scientific Inc. - Key offerings
                • Thermo Fisher Scientific Inc. - Segment focus
                • SWOT

              15 Appendix

              • 15.1 Scope of the report
                • 15.2 Inclusions and exclusions checklist
                  • Inclusions checklist
                  • Exclusions checklist
                • 15.3 Currency conversion rates for US$
                  • Currency conversion rates for US$
                • 15.4 Research methodology
                  • Research methodology
                • 15.5 Data procurement
                  • Information sources
                • 15.6 Data validation
                  • Data validation
                • 15.7 Validation techniques employed for market sizing
                  • Validation techniques employed for market sizing
                • 15.8 Data synthesis
                  • Data synthesis
                • 15.9 360 degree market analysis
                  • 360 degree market analysis
                • 15.10 List of abbreviations
                  • List of abbreviations

                Research Methodology

                Technavio presents a detailed picture of the market by way of study, synthesis, and summation of data from multiple sources. The analysts have presented the various facets of the market with a particular focus on identifying the key industry influencers. The data thus presented is comprehensive, reliable, and the result of extensive research, both primary and secondary.

                INFORMATION SOURCES

                Primary sources

                • Manufacturers and suppliers
                • Channel partners
                • Industry experts
                • Strategic decision makers

                Secondary sources

                • Industry journals and periodicals
                • Government data
                • Financial reports of key industry players
                • Historical data
                • Press releases

                DATA ANALYSIS

                Data Synthesis

                • Collation of data
                • Estimation of key figures
                • Analysis of derived insights

                Data Validation

                • Triangulation with data models
                • Reference against proprietary databases
                • Corroboration with industry experts

                REPORT WRITING

                Qualitative

                • Market drivers
                • Market challenges
                • Market trends
                • Five forces analysis

                Quantitative

                • Market size and forecast
                • Market segmentation
                • Geographical insights
                • Competitive landscape

                Interested in this report?

                Get your sample now to see our research methodology and insights!

                Download Now

                Frequently Asked Questions

                Nanotechnology Products market growth will increase by $ 211.1 bn during 2025-2029.

                The Nanotechnology Products market is expected to grow at a CAGR of 20.3% during 2025-2029.

                Nanotechnology Products market is segmented by Application( Healthcare, Electronics, Energy and power, Aerospace and defense, Others) Product( Nanomaterial, Nanodevices, Nano tools)

                3M Co., Advanced Nano Products Co. Ltd., Applied Materials Inc., Arkema, BASF SE, Bruker Corp., Covestro AG, DuPont de Nemours Inc., Kleindiek Nanotechnik GmbH, Nano C Inc., Nano Magic Inc., Nanophase Technologies Corp., Nanosys Inc., PPG Industries Inc., Smiths Group Plc, Synopsys Inc., Taiwan Semiconductor Manufacturing Co. Ltd., The Dow Chemical Co., Thermo Fisher Scientific Inc., Zyvex Corp. are a few of the key vendors in the Nanotechnology Products market.

                North America will register the highest growth rate of 39% among the other regions. Therefore, the Nanotechnology Products market in North America is expected to garner significant business opportunities for the vendors during the forecast period.

                US, China, Germany, Japan, France, UK, Canada, India, South Korea, Italy

                • Increasing adoption of novel nanotechnology tools to boost agricultural productivityThe global rise in population is a significant factor that is propelling the need for advanced techniques to improve agricultural productivity. According to the World Bank Groups data is the driving factor this market.
                • the global population increased from 7.34 billion in 2015 to approximately 8 billion in 2024. As the population grows is the driving factor this market.
                • the need for food also increases. This increased demand for food can be met only by raising agricultural production. However is the driving factor this market.
                • existing traditional methods to augment crop production are unable to meet the demands of the growing population. Traditional agricultural techniques cannot overcome climate change-related challenges is the driving factor this market.
                • including droughts and floods that are detrimental to the agriculture industry. Therefore is the driving factor this market.
                • researchers are working on nanotechnology tools to develop new varieties of plants and increase the productivity of plant systems. A few of the benefits obtained through nanotechnology are minimizing agricultural inputs and enabling the enrichment of crops through the absorption of nanoscale nutrients from the soil. These will ultimately enhance food quality and safety. Nano products such as nano fertilizers and nano-pesticides in agriculture aim at reducing the excess use and spread of chemicals is the driving factor this market.
                • minimizing the loss of nutrients in fertilizer applications is the driving factor this market.
                • and increasing yield through pest and nutrient management. Thus is the driving factor this market.
                • nanotechnology has the potential to improve agricultural yield using novel nano tools. These tools can facilitate rapid disease diagnosis in crops and enhance the capacity of plants to absorb nutrients and others. The rapid growth in population globally will encourage the increased adoption of novel nanotechnology tools to boost agricultural productivity. For instance is the driving factor this market.
                • BASF is developing nanoparticle-based fertilizers that can improve the uptake and utilization of nutrients by crops. These fertilizers can deliver nutrients to the plant more efficiently is the driving factor this market.
                • thereby reducing the amount of fertilizer needed and the risk of loss of nutrients into the environment. Thus is the driving factor this market.
                • all the above-mentioned factors will be significant growth factors for the global nanotechnology products market over the forecast period. is the driving factor this market.

                The Nanotechnology Products market vendors should focus on grabbing business opportunities from the Healthcare segment as it accounted for the largest market share in the base year.
                RIA - Research AI Assistant
                Ask RIA