Naphtha Market Analysis, Size, and Forecast 2026-2030: APAC (China, India, and Japan), North America (US, Canada, and Mexico), Europe (Germany, France, and UK), Middle East and Africa (Saudi Arabia, UAE, and South Africa), South America (Brazil and Argentina), and Rest of World (ROW)

Naphtha Market Analysis, Size, and Forecast 2026-2030:
APAC (China, India, and Japan), North America (US, Canada, and Mexico), Europe (Germany, France, and UK), Middle East and Africa (Saudi Arabia, UAE, and South Africa), South America (Brazil and Argentina), and Rest of World (ROW)

Published: Mar 2026 301 Pages SKU: IRTNTR75194

Market Overview at a Glance

$48.45 B
Market Opportunity
3.8%
CAGR 2025 - 2030
34.5%
North America Growth
$146.89 B
Heavy naphtha segment 2024

Naphtha Market Size 2026-2030

The naphtha market size is valued to increase by USD 48.45 billion, at a CAGR of 3.8% from 2025 to 2030. Increase in demand for naphtha in petrochemical industry will drive the naphtha market.

Major Market Trends & Insights

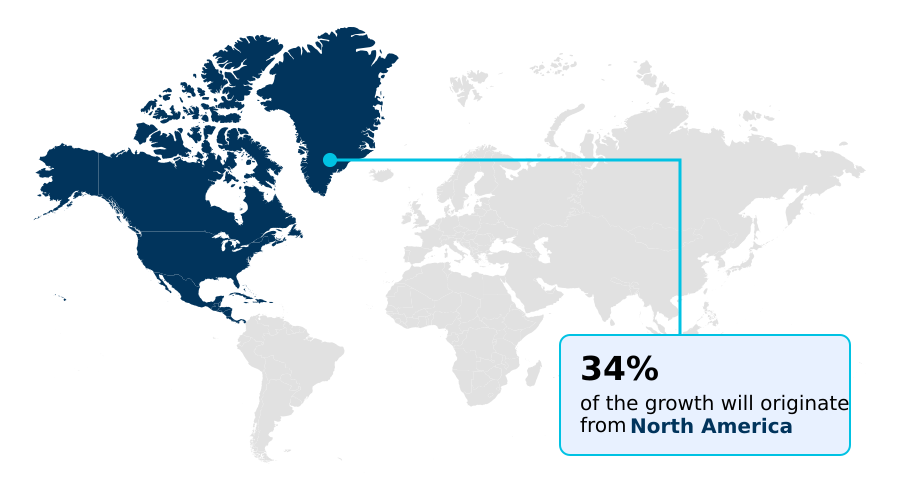
  • North America dominated the market and accounted for a 34.5% growth during the forecast period.
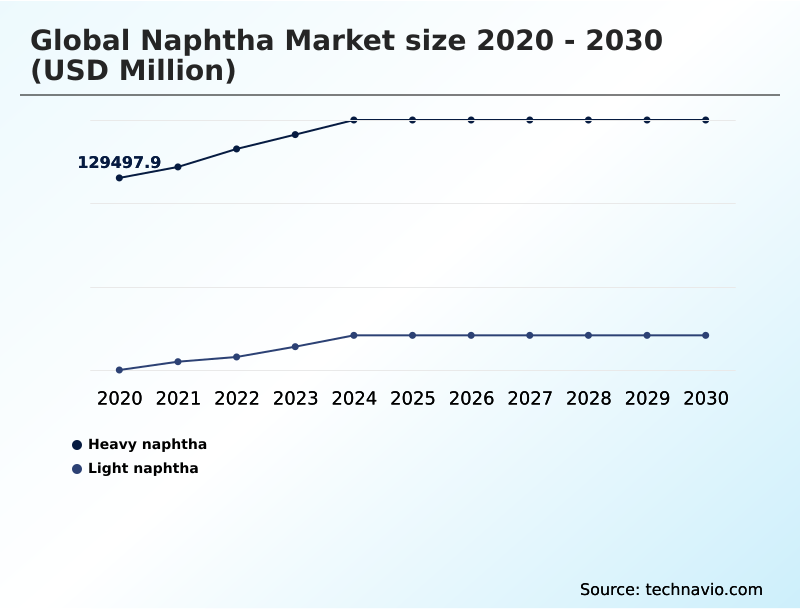
  • By Type - Heavy naphtha segment was valued at USD 146.89 billion in 2024
  • By Application - Chemicals segment accounted for the largest market revenue share in 2024

Market Size & Forecast

  • Market Opportunities: USD 84.54 billion
  • Market Future Opportunities: USD 48.45 billion
  • CAGR from 2025 to 2030 : 3.8%

Market Summary

  • The naphtha market serves as a critical link between upstream refining and downstream chemical manufacturing. Its primary role as a petrochemical feedstock for producing plastics, synthetic resins, and other derivatives underpins industrial activity. A dominant market driver is the sustained demand from the petrochemical sector, which is expanding capacity to meet consumer needs for lightweight materials and advanced polymers.
  • Concurrently, a key trend is the strategic shift within refineries toward crude-to-chemicals configurations, maximizing naphtha yields over transportation fuels. This transition involves significant capital investment in advanced distillation and molecular conversion technologies. However, the industry faces challenges from stringent environmental regulations targeting emissions and the chemical composition of hydrocarbon streams.
  • To navigate this landscape, a refiner might implement a predictive analytics platform. This system analyzes real-time data on feedstock quality and market prices, optimizing blending ratios for steam crackers to ensure consistent output and operational efficiency, thereby mitigating the impact of both feedstock variability and regulatory constraints while improving margins through enhanced process optimization and better feedstock reliability.

What will be the Size of the Naphtha Market during the forecast period?

Get Key Insights on Market Forecast (PDF) Request Free Sample

How is the Naphtha Market Segmented?

The naphtha industry research report provides comprehensive data (region-wise segment analysis), with forecasts and estimates in "USD million" for the period 2026-2030, as well as historical data from 2020-2024 for the following segments.

  • Type
    • Heavy naphtha
    • Light naphtha
  • Application
    • Chemicals
    • Energy or fuel
    • Others
  • End-user
    • Petrochemicals
    • Paints and coatings
    • Agriculture
    • Aerospace
    • Others
  • Geography
    • APAC
      • China
      • India
      • Japan
    • North America
      • US
      • Canada
      • Mexico
    • Europe
      • Germany
      • France
      • UK
    • Middle East and Africa
      • Saudi Arabia
      • UAE
      • South Africa
    • South America
      • Brazil
      • Argentina
    • Rest of World (ROW)

By Type Insights

The heavy naphtha segment is estimated to witness significant growth during the forecast period.

The heavy naphtha segment is integral to the production of high-octane gasoline and key aromatic hydrocarbons. Its primary application is feedstock for catalytic reforming units, where the paraffin-naphthene-aromatic composition is transformed.

Modern refinery process control leverages AI-driven process optimization for this hydrocarbon stream processing, enhancing aromatics yield improvement. Through predictive maintenance systems and real-time process monitoring, operators can fine-tune reactor conditions, which extends the operational window before catalyst regeneration is required.

This digital transformation initiative and focus on refinery process integration allows refiners to maximize the output of high-value components, with some achieving an 8% improvement in aromatics yield while minimizing energy consumption, demonstrating a clear return on technology investment.

Request Free Sample

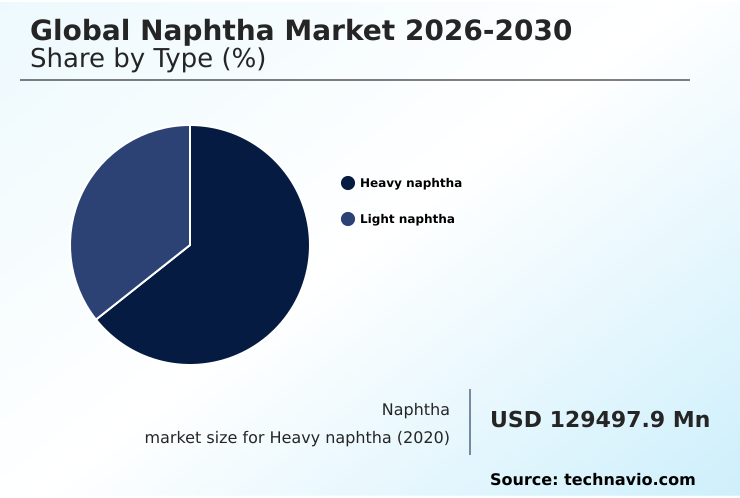
The Heavy naphtha segment was valued at USD 146.89 billion in 2024 and showed a gradual increase during the forecast period.

Request Free Sample

Regional Analysis

North America is estimated to contribute 34.5% to the growth of the global market during the forecast period.Technavio’s analysts have elaborately explained the regional trends and drivers that shape the market during the forecast period.

See How Naphtha Market Demand is Rising in North America Request Free Sample

The geographic landscape of the market is primarily shaped by regional petrochemical demand and refining capabilities. APAC stands as the central demand hub, driven by massive petrochemical capacity expansion in countries like China and India.

This region's reliance on imports makes feedstock flexibility and naphtha blending optimization critical for managing costs and ensuring steam cracker efficiency.

North America is projected to capture 34.5% of the market's incremental growth, fueled by abundant natural gas condensates that provide a cost-advantaged source for light naphtha.

In Europe, the market is characterized by a strong focus on environmental compliance and process optimization to adhere to stringent emission standards.

AI-driven platforms have demonstrated the ability to improve production yields by 3-5% in some APAC refineries, highlighting the role of technology in maintaining competitiveness across diverse regional markets.

Market Dynamics

Our researchers analyzed the data with 2025 as the base year, along with the key drivers, trends, and challenges. A holistic analysis of drivers will help companies refine their marketing strategies to gain a competitive advantage.

  • Strategic decision-making in the market requires a holistic view of the entire value chain. The future of naphtha in energy transition is closely tied to its role in producing essential materials, making the economics of naphtha versus ethane cracking a central consideration for producers.
  • Optimizing steam cracker naphtha feed is critical for profitability, especially when considering the naphtha price volatility business impact. Technologies for high purity naphtha output and hydrotreating processes for naphtha quality are essential for meeting the specifications of the petrochemical industry. The increasing aromatics from heavy naphtha via advanced heavy naphtha catalytic reforming process underpins the production of high-value chemicals.
  • At the same time, managing benzene in naphtha streams and adhering to environmental regulations for naphtha storage are non-negotiable operational mandates. AI in naphtha refinery operations helps manage these complexities, from blending optimization for naphtha feedstock to navigating supply chain challenges in naphtha transport.
  • The impact of shale gas on naphtha supply has reshaped regional dynamics, while emerging bio-based naphtha production pathways and circular economy models for naphtha offer a glimpse into a more sustainable future for light naphtha for ethylene production and its role in gasoline blending.

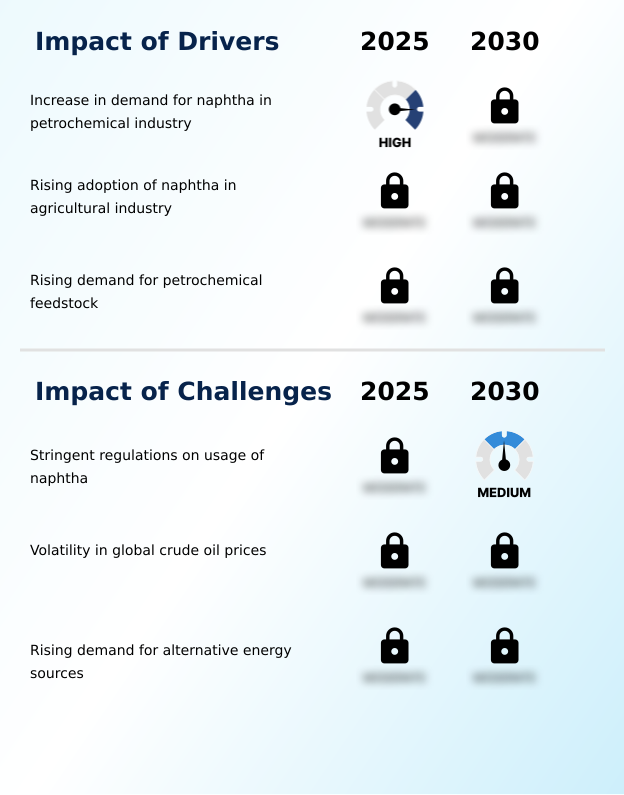
What are the key market drivers leading to the rise in the adoption of Naphtha Industry?

  • The increasing demand for naphtha within the petrochemical industry, where it serves as a fundamental feedstock for producing vital olefins, is a key driver for market growth.

  • Market growth is fundamentally driven by robust demand from the petrochemical industry for light naphtha as a primary petrochemical feedstock for olefin production.
  • The global expansion of petrochemical capacity, particularly for ethylene and propylene, fuels the need for reliable inputs for steam cracking. This demand is amplified by the growing consumption of synthetic resins and advanced polymers in manufacturing sectors.
  • Major integrated refining and chemical projects are being developed to create cost-effective basic chemicals and support synthetic resin manufacturing at scale. As a result, the steam cracking furnace remains a core asset, with petrochemical complexes designed to maximize conversion.
  • The adoption of technologies like waste plastic pyrolysis also contributes by creating alternative feedstock streams, with some plants achieving a 70% conversion rate from plastic waste to liquid hydrocarbons.

What are the market trends shaping the Naphtha Industry?

  • An increase in investment toward enhancing naphtha extraction is a significant market trend. This involves deploying advanced distillation technologies to maximize yields from diverse crude oil qualities.

  • Key trends are reshaping the production landscape, driven by a strategic move toward crude-to-chemicals configurations. This approach prioritizes the output of chemical feedstock through advanced crude oil distillation and molecular conversion technologies. Refiners are making significant investments in refining infrastructure upgrades, integrating sophisticated hydrotreaters and distillation technologies to achieve a high purity output of specialty aromatics and ensure feedstock reliability.
  • The development of sustainable biofuel production is also introducing bio-based naphtha variants and circular renewable naphtha into the supply chain. These innovations in feedstock recovery efficiency enhance operational resilience, with advanced processing units improving feedstock-to-chemical conversion rates by up to 10%, creating a more flexible and profitable operating model.

What challenges does the Naphtha Industry face during its growth?

  • Stringent regulations governing the usage, handling, and chemical composition of naphtha present a key challenge affecting the industry's operational landscape and growth.

  • The market faces significant challenges from an increasingly stringent regulatory environment. The enforcement of industrial emissions standards and rules on volatile organic compounds necessitates substantial investment in vapor recovery units and advanced emission control techniques. Mandates on benzene content and feedstock composition require precise management of hydrocarbon streams, adding complexity to atmospheric distillation processes.
  • Furthermore, the push for decarbonization of cracking processes introduces cost pressures, as compliance can increase operational expenses by up to 15%. Navigating the framework of toxic substances control and ensuring environmental compliance across jurisdictions has become a critical operational hurdle for producers of this flammable hydrocarbon.
  • Consequently, operators are leveraging smart refinery projects and advanced demand forecasting models to optimize production while managing these constraints.

Exclusive Technavio Analysis on Customer Landscape

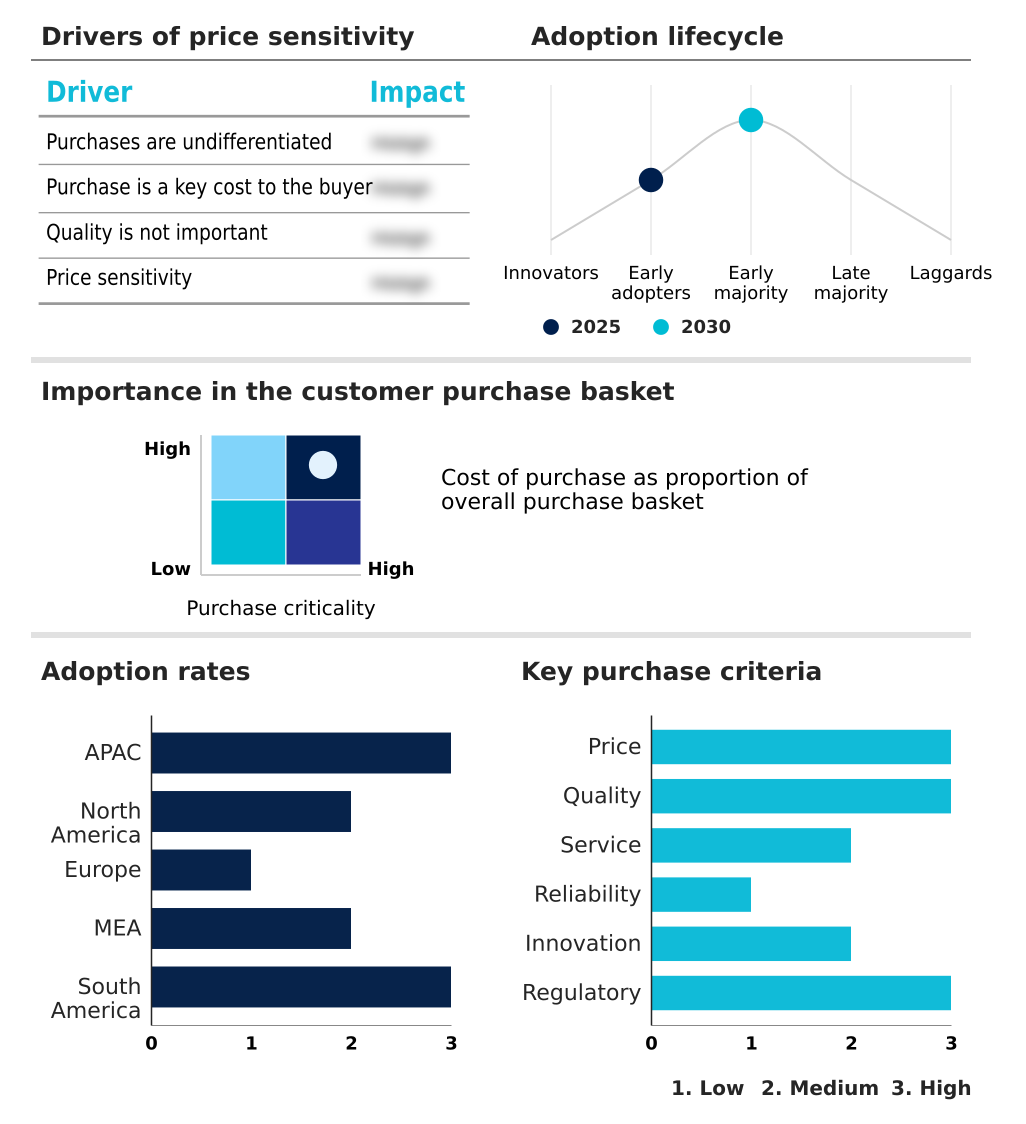
The naphtha market forecasting report includes the adoption lifecycle of the market, covering from the innovator’s stage to the laggard’s stage. It focuses on adoption rates in different regions based on penetration. Furthermore, the naphtha market report also includes key purchase criteria and drivers of price sensitivity to help companies evaluate and develop their market growth analysis strategies.

Customer Landscape of Naphtha Industry

Competitive Landscape

Companies are implementing various strategies, such as strategic alliances, naphtha market forecast, partnerships, mergers and acquisitions, geographical expansion, and product/service launches, to enhance their presence in the industry.

2M Holdings Ltd. - Offers a diversified portfolio of chemical distribution services, including hydrocarbon solvents, sample management, and custom blending solutions for industrial applications.

The industry research and growth report includes detailed analyses of the competitive landscape of the market and information about key companies, including:

  • 2M Holdings Ltd.
  • Alexandria Mineral Oils Co.
  • Bajrang Petrochemicals Ltd.
  • Chevron Corp.
  • China Petrochemical Corp.
  • Exxon Mobil Corp.
  • Formosa Petrochemical Corp.
  • Ganga Rasayanie Pvt. Ltd.
  • Indian Oil Corp. Ltd.
  • LG Chem Ltd.
  • PAO NOVATEK
  • Pyroplast Energy Ltd.
  • Reliance Industries Ltd.
  • Sasol Ltd.
  • Saudi Arabian Oil Co.
  • Shell plc
  • The Mitsubishi Chemical Group
  • TotalEnergies SE
  • UPM Kymmene Corp.

Qualitative and quantitative analysis of companies has been conducted to help clients understand the wider business environment as well as the strengths and weaknesses of key industry players. Data is qualitatively analyzed to categorize companies as pure play, category-focused, industry-focused, and diversified; it is quantitatively analyzed to categorize companies as dominant, leading, strong, tentative, and weak.

Recent Development and News in Naphtha market

  • In January, 2025, the Yulong petrochemical complex commenced full commercial operations in China, a facility designed to process millions of tons of naphtha annually to produce high-value chemicals for the domestic manufacturing sector.
  • In January, 2025, Saudi Aramco announced a multi-billion dollar investment to upgrade its refining infrastructure, focusing on integrating new molecular conversion technologies to increase the recovery rate of light naphtha from heavy crude oil grades.
  • In January, 2025, the European Union's Industrial Emissions Directive entered its enhanced monitoring phase, mandating stricter controls on benzene and other aromatics in facilities processing naphtha, directly impacting refiners in Germany and The Netherlands.
  • In October, 2024, Shell plc announced the successful deployment of an AI-driven process optimization system at its Pernis refinery, aiming to improve the efficiency and output of heavy naphtha distillation and reforming operations.

Dive into Technavio’s robust research methodology, blending expert interviews, extensive data synthesis, and validated models for unparalleled Naphtha Market insights. See full methodology.

Market Scope
Page number 301
Base year 2025
Historic period 2020-2024
Forecast period 2026-2030
Growth momentum & CAGR Accelerate at a CAGR of 3.8%
Market growth 2026-2030 USD 48449.2 million
Market structure Fragmented
YoY growth 2025-2026(%) 3.7%
Key countries China, India, Japan, South Korea, Australia, Indonesia, US, Canada, Mexico, Germany, France, UK, Italy, Spain, The Netherlands, Saudi Arabia, UAE, South Africa, Israel, Turkey, Brazil, Argentina and Chile
Competitive landscape Leading Companies, Market Positioning of Companies, Competitive Strategies, and Industry Risks

Request Free Sample

Research Analyst Overview

  • The market is defined by a strategic pivot where refiners are re-evaluating asset utilization and capital allocation. This shift is driven by the need to maximize value from every barrel of crude oil, favoring the production of chemical feedstock over traditional fuels. Key boardroom decisions now center on funding refining infrastructure upgrades that incorporate advanced molecular conversion and distillation technologies.
  • These systems are essential for processing a wider range of hydrocarbon streams and achieving the high purity output required for specialty aromatics. Adherence to industrial emissions directives and managing benzene content have become critical operational mandates, compelling investment in vapor recovery units and advanced refinery process control.
  • The adoption of AI-driven process optimization enables a more granular management of the flammable hydrocarbon, from crude oil distillation and natural gas condensates to the final petrochemical feedstock. By leveraging these technologies, facilities can improve cracking yields from specific paraffinic grades, extend the time between catalyst regeneration cycles, and ensure feedstock reliability.
  • This approach, focused on enhancing feedstock composition, has enabled some operators to improve aromatics recovery by over 5%, demonstrating a clear path to maintaining competitiveness.

What are the Key Data Covered in this Naphtha Market Research and Growth Report?

  • What is the expected growth of the Naphtha Market between 2026 and 2030?

    • USD 48.45 billion, at a CAGR of 3.8%

  • What segmentation does the market report cover?

    • The report is segmented by Type (Heavy naphtha, and Light naphtha), Application (Chemicals, Energy or fuel, and Others), End-user (Petrochemicals, Paints and coatings, Agriculture, Aerospace, and Others) and Geography (APAC, North America, Europe, Middle East and Africa, South America)

  • Which regions are analyzed in the report?

    • APAC, North America, Europe, Middle East and Africa and South America

  • What are the key growth drivers and market challenges?

    • Increase in demand for naphtha in petrochemical industry, Stringent regulations on usage of naphtha

  • Who are the major players in the Naphtha Market?

    • 2M Holdings Ltd., Alexandria Mineral Oils Co., Bajrang Petrochemicals Ltd., Chevron Corp., China Petrochemical Corp., Exxon Mobil Corp., Formosa Petrochemical Corp., Ganga Rasayanie Pvt. Ltd., Indian Oil Corp. Ltd., LG Chem Ltd., PAO NOVATEK, Pyroplast Energy Ltd., Reliance Industries Ltd., Sasol Ltd., Saudi Arabian Oil Co., Shell plc, The Mitsubishi Chemical Group, TotalEnergies SE and UPM Kymmene Corp.

Market Research Insights

  • Market dynamics are increasingly shaped by a strategic pivot toward high-value chemical production and operational excellence. This shift is driving investment in refining infrastructure upgrades and crude-to-chemicals configurations, with some operators improving feedstock recovery efficiency by over 12%.
  • Advanced demand forecasting models and supply chain logistics platforms are being adopted to navigate price volatility, leading to a 15% reduction in inventory carrying costs. Furthermore, the focus on petrochemical capacity expansion is supported by digital transformation initiatives integrating the industrial internet of things for real-time process monitoring.
  • These smart refinery projects enhance feedstock flexibility and steam cracker efficiency, enabling producers to maintain higher margins in a competitive environment where cost-effective basic chemicals are paramount.

We can help! Our analysts can customize this naphtha market research report to meet your requirements.

Get in touch

1. Executive Summary

1.1 Market overview

Executive Summary - Chart on Market Overview
Executive Summary - Data Table on Market Overview
Executive Summary - Chart on Global Market Characteristics
Executive Summary - Chart on Market by Geography
Executive Summary - Chart on Market Segmentation by Type
Executive Summary - Chart on Market Segmentation by Application
Executive Summary - Chart on Market Segmentation by End-user
Executive Summary - Chart on Incremental Growth
Executive Summary - Data Table on Incremental Growth
Executive Summary - Chart on Company Market Positioning

2. Technavio Analysis

2.1 Analysis of price sensitivity, lifecycle, customer purchase basket, adoption rates, and purchase criteria

2.2 Criticality of inputs and Factors of differentiation

Chart on Overview on criticality of inputs and factors of differentiation

2.3 Factors of disruption

Chart on Overview on factors of disruption

2.4 Impact of drivers and challenges

Chart on Impact of drivers and challenges in 2025 and 2030

3. Market Landscape

3.1 Market ecosystem

Chart on Parent Market
Data Table on - Parent Market

3.2 Market characteristics

Chart on Market characteristics analysis

3.3 Value chain analysis

Chart on Value chain analysis

4. Market Sizing

4.1 Market definition

Data Table on Offerings of companies included in the market definition

4.2 Market segment analysis

Market segments

4.3 Market size 2025

4.4 Market outlook: Forecast for 2025-2030

Chart on Global - Market size and forecast 2025-2030 ($ million)
Data Table on Global - Market size and forecast 2025-2030 ($ million)
Chart on Global Market: Year-over-year growth 2025-2030 (%)
Data Table on Global Market: Year-over-year growth 2025-2030 (%)

5. Historic Market Size

5.1 Global Naphtha Market 2020 - 2024

Historic Market Size - Data Table on Global Naphtha Market 2020 - 2024 ($ million)

5.2 Type segment analysis 2020 - 2024

Historic Market Size - Type Segment 2020 - 2024 ($ million)

5.3 Application segment analysis 2020 - 2024

Historic Market Size - Application Segment 2020 - 2024 ($ million)

5.4 End-user segment analysis 2020 - 2024

Historic Market Size - End-user Segment 2020 - 2024 ($ million)

5.5 Geography segment analysis 2020 - 2024

Historic Market Size - Geography Segment 2020 - 2024 ($ million)

5.6 Country segment analysis 2020 - 2024

Historic Market Size - Country Segment 2020 - 2024 ($ million)

6. Qualitative Analysis

6.1 Impact of AI on Global Naphtha Market

6.2 Impact of Geopolitical Conflicts on Global Naphtha Market

7. Five Forces Analysis

7.1 Five forces summary

Five forces analysis - Comparison between 2025 and 2030

7.2 Bargaining power of buyers

Bargaining power of buyers - Impact of key factors 2025 and 2030

7.3 Bargaining power of suppliers

Bargaining power of suppliers - Impact of key factors in 2025 and 2030

7.4 Threat of new entrants

Threat of new entrants - Impact of key factors in 2025 and 2030

7.5 Threat of substitutes

Threat of substitutes - Impact of key factors in 2025 and 2030

7.6 Threat of rivalry

Threat of rivalry - Impact of key factors in 2025 and 2030

7.7 Market condition

Chart on Market condition - Five forces 2025 and 2030

8. Market Segmentation by Type

8.1 Market segments

Chart on Type - Market share 2025-2030 (%)
Data Table on Type - Market share 2025-2030 (%)

8.2 Comparison by Type

Chart on Comparison by Type
Data Table on Comparison by Type

8.3 Heavy naphtha - Market size and forecast 2025-2030

Chart on Heavy naphtha - Market size and forecast 2025-2030 ($ million)
Data Table on Heavy naphtha - Market size and forecast 2025-2030 ($ million)
Chart on Heavy naphtha - Year-over-year growth 2025-2030 (%)
Data Table on Heavy naphtha - Year-over-year growth 2025-2030 (%)

8.4 Light naphtha - Market size and forecast 2025-2030

Chart on Light naphtha - Market size and forecast 2025-2030 ($ million)
Data Table on Light naphtha - Market size and forecast 2025-2030 ($ million)
Chart on Light naphtha - Year-over-year growth 2025-2030 (%)
Data Table on Light naphtha - Year-over-year growth 2025-2030 (%)

8.5 Market opportunity by Type

Market opportunity by Type ($ million)
Data Table on Market opportunity by Type ($ million)

9. Market Segmentation by Application

9.1 Market segments

Chart on Application - Market share 2025-2030 (%)
Data Table on Application - Market share 2025-2030 (%)

9.2 Comparison by Application

Chart on Comparison by Application
Data Table on Comparison by Application

9.3 Chemicals - Market size and forecast 2025-2030

Chart on Chemicals - Market size and forecast 2025-2030 ($ million)
Data Table on Chemicals - Market size and forecast 2025-2030 ($ million)
Chart on Chemicals - Year-over-year growth 2025-2030 (%)
Data Table on Chemicals - Year-over-year growth 2025-2030 (%)

9.4 Energy or fuel - Market size and forecast 2025-2030

Chart on Energy or fuel - Market size and forecast 2025-2030 ($ million)
Data Table on Energy or fuel - Market size and forecast 2025-2030 ($ million)
Chart on Energy or fuel - Year-over-year growth 2025-2030 (%)
Data Table on Energy or fuel - Year-over-year growth 2025-2030 (%)

9.5 Others - Market size and forecast 2025-2030

Chart on Others - Market size and forecast 2025-2030 ($ million)
Data Table on Others - Market size and forecast 2025-2030 ($ million)
Chart on Others - Year-over-year growth 2025-2030 (%)
Data Table on Others - Year-over-year growth 2025-2030 (%)

9.6 Market opportunity by Application

Market opportunity by Application ($ million)
Data Table on Market opportunity by Application ($ million)

10. Market Segmentation by End-user

10.1 Market segments

Chart on End-user - Market share 2025-2030 (%)
Data Table on End-user - Market share 2025-2030 (%)

10.2 Comparison by End-user

Chart on Comparison by End-user
Data Table on Comparison by End-user

10.3 Petrochemicals - Market size and forecast 2025-2030

Chart on Petrochemicals - Market size and forecast 2025-2030 ($ million)
Data Table on Petrochemicals - Market size and forecast 2025-2030 ($ million)
Chart on Petrochemicals - Year-over-year growth 2025-2030 (%)
Data Table on Petrochemicals - Year-over-year growth 2025-2030 (%)

10.4 Paints and coatings - Market size and forecast 2025-2030

Chart on Paints and coatings - Market size and forecast 2025-2030 ($ million)
Data Table on Paints and coatings - Market size and forecast 2025-2030 ($ million)
Chart on Paints and coatings - Year-over-year growth 2025-2030 (%)
Data Table on Paints and coatings - Year-over-year growth 2025-2030 (%)

10.5 Agriculture - Market size and forecast 2025-2030

Chart on Agriculture - Market size and forecast 2025-2030 ($ million)
Data Table on Agriculture - Market size and forecast 2025-2030 ($ million)
Chart on Agriculture - Year-over-year growth 2025-2030 (%)
Data Table on Agriculture - Year-over-year growth 2025-2030 (%)

10.6 Aerospace - Market size and forecast 2025-2030

Chart on Aerospace - Market size and forecast 2025-2030 ($ million)
Data Table on Aerospace - Market size and forecast 2025-2030 ($ million)
Chart on Aerospace - Year-over-year growth 2025-2030 (%)
Data Table on Aerospace - Year-over-year growth 2025-2030 (%)

10.7 Others - Market size and forecast 2025-2030

Chart on Others - Market size and forecast 2025-2030 ($ million)
Data Table on Others - Market size and forecast 2025-2030 ($ million)
Chart on Others - Year-over-year growth 2025-2030 (%)
Data Table on Others - Year-over-year growth 2025-2030 (%)

10.8 Market opportunity by End-user

Market opportunity by End-user ($ million)
Data Table on Market opportunity by End-user ($ million)

11. Customer Landscape

11.1 Customer landscape overview

Analysis of price sensitivity, lifecycle, customer purchase basket, adoption rates, and purchase criteria

12. Geographic Landscape

12.1 Geographic segmentation

Chart on Market share by geography 2025-2030 (%)
Data Table on Market share by geography 2025-2030 (%)

12.2 Geographic comparison

Chart on Geographic comparison
Data Table on Geographic comparison

12.3 APAC - Market size and forecast 2025-2030

Chart on APAC - Market size and forecast 2025-2030 ($ million)
Data Table on APAC - Market size and forecast 2025-2030 ($ million)
Chart on APAC - Year-over-year growth 2025-2030 (%)
Data Table on APAC - Year-over-year growth 2025-2030 (%)
Chart on Regional Comparison - APAC
Data Table on Regional Comparison - APAC

12.3.1 China - Market size and forecast 2025-2030

Chart on China - Market size and forecast 2025-2030 ($ million)
Data Table on China - Market size and forecast 2025-2030 ($ million)
Chart on China - Year-over-year growth 2025-2030 (%)
Data Table on China - Year-over-year growth 2025-2030 (%)

12.3.2 India - Market size and forecast 2025-2030

Chart on India - Market size and forecast 2025-2030 ($ million)
Data Table on India - Market size and forecast 2025-2030 ($ million)
Chart on India - Year-over-year growth 2025-2030 (%)
Data Table on India - Year-over-year growth 2025-2030 (%)

12.3.3 Japan - Market size and forecast 2025-2030

Chart on Japan - Market size and forecast 2025-2030 ($ million)
Data Table on Japan - Market size and forecast 2025-2030 ($ million)
Chart on Japan - Year-over-year growth 2025-2030 (%)
Data Table on Japan - Year-over-year growth 2025-2030 (%)

12.3.4 South Korea - Market size and forecast 2025-2030

Chart on South Korea - Market size and forecast 2025-2030 ($ million)
Data Table on South Korea - Market size and forecast 2025-2030 ($ million)
Chart on South Korea - Year-over-year growth 2025-2030 (%)
Data Table on South Korea - Year-over-year growth 2025-2030 (%)

12.3.5 Australia - Market size and forecast 2025-2030

Chart on Australia - Market size and forecast 2025-2030 ($ million)
Data Table on Australia - Market size and forecast 2025-2030 ($ million)
Chart on Australia - Year-over-year growth 2025-2030 (%)
Data Table on Australia - Year-over-year growth 2025-2030 (%)

12.3.6 Indonesia - Market size and forecast 2025-2030

Chart on Indonesia - Market size and forecast 2025-2030 ($ million)
Data Table on Indonesia - Market size and forecast 2025-2030 ($ million)
Chart on Indonesia - Year-over-year growth 2025-2030 (%)
Data Table on Indonesia - Year-over-year growth 2025-2030 (%)

12.4 North America - Market size and forecast 2025-2030

Chart on North America - Market size and forecast 2025-2030 ($ million)
Data Table on North America - Market size and forecast 2025-2030 ($ million)
Chart on North America - Year-over-year growth 2025-2030 (%)
Data Table on North America - Year-over-year growth 2025-2030 (%)
Chart on Regional Comparison - North America
Data Table on Regional Comparison - North America

12.4.1 US - Market size and forecast 2025-2030

Chart on US - Market size and forecast 2025-2030 ($ million)
Data Table on US - Market size and forecast 2025-2030 ($ million)
Chart on US - Year-over-year growth 2025-2030 (%)
Data Table on US - Year-over-year growth 2025-2030 (%)

12.4.2 Canada - Market size and forecast 2025-2030

Chart on Canada - Market size and forecast 2025-2030 ($ million)
Data Table on Canada - Market size and forecast 2025-2030 ($ million)
Chart on Canada - Year-over-year growth 2025-2030 (%)
Data Table on Canada - Year-over-year growth 2025-2030 (%)

12.4.3 Mexico - Market size and forecast 2025-2030

Chart on Mexico - Market size and forecast 2025-2030 ($ million)
Data Table on Mexico - Market size and forecast 2025-2030 ($ million)
Chart on Mexico - Year-over-year growth 2025-2030 (%)
Data Table on Mexico - Year-over-year growth 2025-2030 (%)

12.5 Europe - Market size and forecast 2025-2030

Chart on Europe - Market size and forecast 2025-2030 ($ million)
Data Table on Europe - Market size and forecast 2025-2030 ($ million)
Chart on Europe - Year-over-year growth 2025-2030 (%)
Data Table on Europe - Year-over-year growth 2025-2030 (%)
Chart on Regional Comparison - Europe
Data Table on Regional Comparison - Europe

12.5.1 Germany - Market size and forecast 2025-2030

Chart on Germany - Market size and forecast 2025-2030 ($ million)
Data Table on Germany - Market size and forecast 2025-2030 ($ million)
Chart on Germany - Year-over-year growth 2025-2030 (%)
Data Table on Germany - Year-over-year growth 2025-2030 (%)

12.5.2 France - Market size and forecast 2025-2030

Chart on France - Market size and forecast 2025-2030 ($ million)
Data Table on France - Market size and forecast 2025-2030 ($ million)
Chart on France - Year-over-year growth 2025-2030 (%)
Data Table on France - Year-over-year growth 2025-2030 (%)

12.5.3 UK - Market size and forecast 2025-2030

Chart on UK - Market size and forecast 2025-2030 ($ million)
Data Table on UK - Market size and forecast 2025-2030 ($ million)
Chart on UK - Year-over-year growth 2025-2030 (%)
Data Table on UK - Year-over-year growth 2025-2030 (%)

12.5.4 Italy - Market size and forecast 2025-2030

Chart on Italy - Market size and forecast 2025-2030 ($ million)
Data Table on Italy - Market size and forecast 2025-2030 ($ million)
Chart on Italy - Year-over-year growth 2025-2030 (%)
Data Table on Italy - Year-over-year growth 2025-2030 (%)

12.5.5 Spain - Market size and forecast 2025-2030

Chart on Spain - Market size and forecast 2025-2030 ($ million)
Data Table on Spain - Market size and forecast 2025-2030 ($ million)
Chart on Spain - Year-over-year growth 2025-2030 (%)
Data Table on Spain - Year-over-year growth 2025-2030 (%)

12.5.6 The Netherlands - Market size and forecast 2025-2030

Chart on The Netherlands - Market size and forecast 2025-2030 ($ million)
Data Table on The Netherlands - Market size and forecast 2025-2030 ($ million)
Chart on The Netherlands - Year-over-year growth 2025-2030 (%)
Data Table on The Netherlands - Year-over-year growth 2025-2030 (%)

12.6 Middle East and Africa - Market size and forecast 2025-2030

Chart on Middle East and Africa - Market size and forecast 2025-2030 ($ million)
Data Table on Middle East and Africa - Market size and forecast 2025-2030 ($ million)
Chart on Middle East and Africa - Year-over-year growth 2025-2030 (%)
Data Table on Middle East and Africa - Year-over-year growth 2025-2030 (%)
Chart on Regional Comparison - Middle East and Africa
Data Table on Regional Comparison - Middle East and Africa

12.6.1 Saudi Arabia - Market size and forecast 2025-2030

Chart on Saudi Arabia - Market size and forecast 2025-2030 ($ million)
Data Table on Saudi Arabia - Market size and forecast 2025-2030 ($ million)
Chart on Saudi Arabia - Year-over-year growth 2025-2030 (%)
Data Table on Saudi Arabia - Year-over-year growth 2025-2030 (%)

12.6.2 UAE - Market size and forecast 2025-2030

Chart on UAE - Market size and forecast 2025-2030 ($ million)
Data Table on UAE - Market size and forecast 2025-2030 ($ million)
Chart on UAE - Year-over-year growth 2025-2030 (%)
Data Table on UAE - Year-over-year growth 2025-2030 (%)

12.6.3 South Africa - Market size and forecast 2025-2030

Chart on South Africa - Market size and forecast 2025-2030 ($ million)
Data Table on South Africa - Market size and forecast 2025-2030 ($ million)
Chart on South Africa - Year-over-year growth 2025-2030 (%)
Data Table on South Africa - Year-over-year growth 2025-2030 (%)

12.6.4 Israel - Market size and forecast 2025-2030

Chart on Israel - Market size and forecast 2025-2030 ($ million)
Data Table on Israel - Market size and forecast 2025-2030 ($ million)
Chart on Israel - Year-over-year growth 2025-2030 (%)
Data Table on Israel - Year-over-year growth 2025-2030 (%)

12.6.5 Turkey - Market size and forecast 2025-2030

Chart on Turkey - Market size and forecast 2025-2030 ($ million)
Data Table on Turkey - Market size and forecast 2025-2030 ($ million)
Chart on Turkey - Year-over-year growth 2025-2030 (%)
Data Table on Turkey - Year-over-year growth 2025-2030 (%)

12.7 South America - Market size and forecast 2025-2030

Chart on South America - Market size and forecast 2025-2030 ($ million)
Data Table on South America - Market size and forecast 2025-2030 ($ million)
Chart on South America - Year-over-year growth 2025-2030 (%)
Data Table on South America - Year-over-year growth 2025-2030 (%)
Chart on Regional Comparison - South America
Data Table on Regional Comparison - South America

12.7.1 Brazil - Market size and forecast 2025-2030

Chart on Brazil - Market size and forecast 2025-2030 ($ million)
Data Table on Brazil - Market size and forecast 2025-2030 ($ million)
Chart on Brazil - Year-over-year growth 2025-2030 (%)
Data Table on Brazil - Year-over-year growth 2025-2030 (%)

12.7.2 Argentina - Market size and forecast 2025-2030

Chart on Argentina - Market size and forecast 2025-2030 ($ million)
Data Table on Argentina - Market size and forecast 2025-2030 ($ million)
Chart on Argentina - Year-over-year growth 2025-2030 (%)
Data Table on Argentina - Year-over-year growth 2025-2030 (%)

12.7.3 Chile - Market size and forecast 2025-2030

Chart on Chile - Market size and forecast 2025-2030 ($ million)
Data Table on Chile - Market size and forecast 2025-2030 ($ million)
Chart on Chile - Year-over-year growth 2025-2030 (%)
Data Table on Chile - Year-over-year growth 2025-2030 (%)

12.8 Market opportunity by geography

Market opportunity by geography ($ million)
Data Tables on Market opportunity by geography ($ million)

13. Drivers, Challenges, and Opportunity

13.1 Market drivers

Increase in demand for naphtha in petrochemical industry
Rising adoption of naphtha in agricultural industry
Rising demand for petrochemical feedstock

13.2 Market challenges

Stringent regulations on usage of naphtha
Volatility in global crude oil prices
Rising demand for alternative energy sources

13.3 Impact of drivers and challenges

Impact of drivers and challenges in 2025 and 2030

13.4 Market opportunities

Increase in investment in extraction of naphtha
Rising exploration of unconventional petroleum resources
Adoption of blockchain in oil and gas refining industry

14. Competitive Landscape

14.1 Overview

14.2

Overview on criticality of inputs and factors of differentiation

14.3 Landscape disruption

Overview on factors of disruption

14.4 Industry risks

Impact of key risks on business

15. Competitive Analysis

15.1 Companies profiled

Companies covered

15.2 Company ranking index

15.3 Market positioning of companies

Matrix on companies position and classification

15.4 2M Holdings Ltd.

2M Holdings Ltd. - Overview
2M Holdings Ltd. - Product / Service
2M Holdings Ltd. - Key offerings
SWOT

15.5 Alexandria Mineral Oils Co.

Alexandria Mineral Oils Co. - Overview
Alexandria Mineral Oils Co. - Product / Service
Alexandria Mineral Oils Co. - Key offerings
SWOT

15.6 Chevron Corp.

Chevron Corp. - Overview
Chevron Corp. - Business segments
Chevron Corp. - Key news
Chevron Corp. - Key offerings
Chevron Corp. - Segment focus
SWOT

15.7 Exxon Mobil Corp.

Exxon Mobil Corp. - Overview
Exxon Mobil Corp. - Business segments
Exxon Mobil Corp. - Key news
Exxon Mobil Corp. - Key offerings
Exxon Mobil Corp. - Segment focus
SWOT

15.8 Formosa Petrochemical Corp.

Formosa Petrochemical Corp. - Overview
Formosa Petrochemical Corp. - Product / Service
Formosa Petrochemical Corp. - Key offerings
SWOT

15.9 Ganga Rasayanie Pvt. Ltd.

Ganga Rasayanie Pvt. Ltd. - Overview
Ganga Rasayanie Pvt. Ltd. - Product / Service
Ganga Rasayanie Pvt. Ltd. - Key offerings
SWOT

15.10 Indian Oil Corp. Ltd.

Indian Oil Corp. Ltd. - Overview
Indian Oil Corp. Ltd. - Business segments
Indian Oil Corp. Ltd. - Key news
Indian Oil Corp. Ltd. - Key offerings
Indian Oil Corp. Ltd. - Segment focus
SWOT

15.11 PAO NOVATEK

PAO NOVATEK - Overview
PAO NOVATEK - Business segments
PAO NOVATEK - Key offerings
PAO NOVATEK - Segment focus
SWOT

15.12 Pyroplast Energy Ltd.

Pyroplast Energy Ltd. - Overview
Pyroplast Energy Ltd. - Product / Service
Pyroplast Energy Ltd. - Key offerings
SWOT

15.13 Reliance Industries Ltd.

Reliance Industries Ltd. - Overview
Reliance Industries Ltd. - Business segments
Reliance Industries Ltd. - Key news
Reliance Industries Ltd. - Key offerings
Reliance Industries Ltd. - Segment focus
SWOT

15.14 Sasol Ltd.

Sasol Ltd. - Overview
Sasol Ltd. - Business segments
Sasol Ltd. - Key news
Sasol Ltd. - Key offerings
Sasol Ltd. - Segment focus
SWOT

15.15 Saudi Arabian Oil Co.

Saudi Arabian Oil Co. - Overview
Saudi Arabian Oil Co. - Business segments
Saudi Arabian Oil Co. - Key offerings
Saudi Arabian Oil Co. - Segment focus
SWOT

15.16 Shell plc

Shell plc - Overview
Shell plc - Business segments
Shell plc - Key news
Shell plc - Key offerings
Shell plc - Segment focus
SWOT

15.17 TotalEnergies SE

TotalEnergies SE - Overview
TotalEnergies SE - Business segments
TotalEnergies SE - Key news
TotalEnergies SE - Key offerings
TotalEnergies SE - Segment focus
SWOT

15.18 UPM Kymmene Corp.

UPM Kymmene Corp. - Overview
UPM Kymmene Corp. - Business segments
UPM Kymmene Corp. - Key offerings
UPM Kymmene Corp. - Segment focus
SWOT

16. Appendix

16.1 Scope of the report

Market definition
Objectives
Notes and caveats

16.2 Inclusions and exclusions checklist

Inclusions checklist
Exclusions checklist

16.3 Currency conversion rates for US$

16.4 Research methodology

16.5 Data procurement

Information sources

16.6 Data validation

16.7 Validation techniques employed for market sizing

16.8 Data synthesis

16.9 360 degree market analysis

16.10 List of abbreviations

Research Methodology

Technavio presents a detailed picture of the market by way of study, synthesis, and summation of data from multiple sources. The analysts have presented the various facets of the market with a particular focus on identifying the key industry influencers. The data thus presented is comprehensive, reliable, and the result of extensive research, both primary and secondary.

INFORMATION SOURCES

Primary sources

  • Manufacturers and suppliers
  • Channel partners
  • Industry experts
  • Strategic decision makers

Secondary sources

  • Industry journals and periodicals
  • Government data
  • Financial reports of key industry players
  • Historical data
  • Press releases

DATA ANALYSIS

Data Synthesis

  • Collation of data
  • Estimation of key figures
  • Analysis of derived insights

Data Validation

  • Triangulation with data models
  • Reference against proprietary databases
  • Corroboration with industry experts

REPORT WRITING

Qualitative

  • Market drivers
  • Market challenges
  • Market trends
  • Five forces analysis

Quantitative

  • Market size and forecast
  • Market segmentation
  • Geographical insights
  • Competitive landscape

Interested in this report?

Get your sample now to see our research methodology and insights!

Download Now

Frequently Asked Questions

Naphtha market growth will increase by USD 48449.2 million during 2026-2030.

The Naphtha market is expected to grow at a CAGR of 3.8% during 2026-2030.

Naphtha market is segmented by Type (Heavy naphtha, Light naphtha) Application (Chemicals, Energy or fuel, Others) End-user (Petrochemicals, Paints and coatings, Agriculture, Aerospace, Others)

2M Holdings Ltd., Alexandria Mineral Oils Co., Bajrang Petrochemicals Ltd., Chevron Corp., China Petrochemical Corp., Exxon Mobil Corp., Formosa Petrochemical Corp., Ganga Rasayanie Pvt. Ltd., Indian Oil Corp. Ltd., LG Chem Ltd., PAO NOVATEK, Pyroplast Energy Ltd., Reliance Industries Ltd., Sasol Ltd., Saudi Arabian Oil Co., Shell plc, The Mitsubishi Chemical Group, TotalEnergies SE, UPM Kymmene Corp. are a few of the key vendors in the Naphtha market.

North America will register the highest growth rate of 34.5% among the other regions. Therefore, the Naphtha market in North America is expected to garner significant business opportunities for the vendors during the forecast period.

China, India, Japan, South Korea, Australia, Indonesia, US, Canada, Mexico, Germany, France, UK, Italy, Spain, The Netherlands, Saudi Arabia, UAE, South Africa, Israel, Turkey, Brazil, Argentina, Chile

  • Increase in demand for naphtha in petrochemical industry is the driving factor this market.

The Naphtha market vendors should focus on grabbing business opportunities from the Type segment as it accounted for the largest market share in the base year.
RIA - Research AI Assistant
Ask RIA