Petroleum Liquid Feedstock Market Analysis North America, Europe, APAC, South America, Middle East and Africa - US, China, India, Germany, UK - Size and Forecast 2024-2028

Petroleum Liquid Feedstock Market Analysis North America, Europe, APAC, South America, Middle East and Africa - US, China, India, Germany, UK - Size and Forecast 2024-2028

Published: Oct 2023 181 Pages SKU: IRTNTR73539

Market Overview at a Glance

$77.22 B
Market Opportunity
4.5%
CAGR
3.5
YoY growth 2023-2024(%)

Petroleum Liquid Feedstock Market Size 2024-2028 

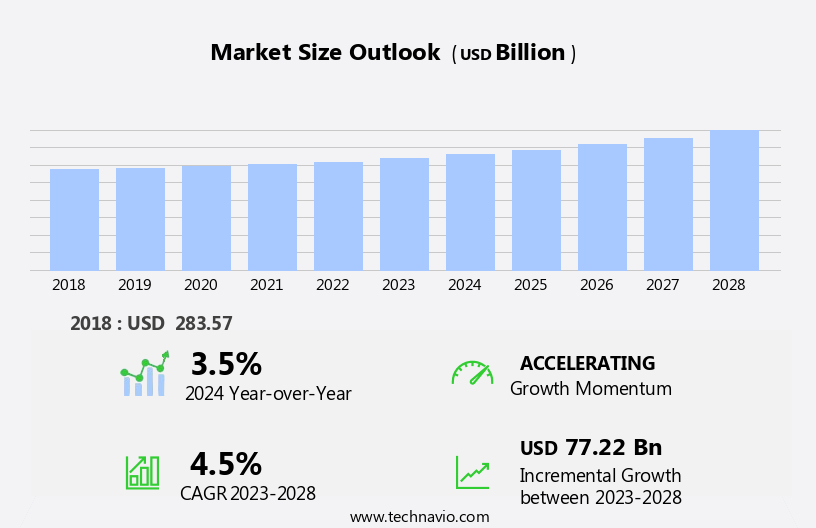
The petroleum liquid feedstock market size is forecast to increase by USD 77.22 billion at a CAGR of 4.5% between 2023 and 2028. The market is experiencing significant growth, driven by the rapid expansion of the transportation sector. This sector's increasing demand for fuel is leading to a wave in the consumption of petroleum liquid feedstocks. Another trend influencing the market is the adoption of blockchain technology in the oil and gas refining industry. Blockchain's transparency and security features are expected to streamline operations, reduce costs, and enhance efficiency in the refining process. Hydrocarbons, such as naphthalene, xylene, benzene, toluene, and heavy naphtha, are essential hydrocarbon feedstocks used in the production of industrial solvents, fuels, and other oil-based commodities. However, the market's growth is not without challenges. The volatility in global crude oil prices continues to pose a significant threat to market stability, making it essential for market players to adopt strategies that mitigate price risks and ensure long-term profitability.

Petroleum Liquid Feedstock Market Size

 Request Free Sample

The petrochemical industry relies heavily on petroleum liquid feedstocks as the primary raw material for producing a wide range of chemicals, polymers, and other petrochemical products. The automotive fleet and the energy sector are significant consumers of these products, with motor vehicles utilizing petrochemicals for fuel and in the production of plastics and textiles. Petrochemical plants and refineries are the primary sources of these feedstocks, which include oil naphtha, coal naphtha, and wood naphtha.

The petrochemical industry's demand for these feedstocks is expected to grow due to increasing demand from the automotive and energy sectors. Crude material, such as unrefined petroleum, is the primary source of these feedstocks. Oil organizations play a crucial role in the production and distribution of these feedstocks to meet the growing demand from various industries. With the rise of electric vehicles, the demand for traditional fuels may decrease, but the demand for petrochemical products derived from these feedstocks is expected to remain strong due to their wide range of applications.

Market Segmentation

The market research report provides comprehensive data (region-wise segment analysis), with forecasts and estimates in "USD Billion" for the period 2024-2028, as well as historical data from 2018 - 2022 for the following segments.

  • Type
    • Naphtha
    • Gasoil
  • Application
    • Industrial solvents
    • Cleaning fluids
    • Adulterant to petrol
    • Gasoline
    • Others
  • Geography
    • North America
      • US
    • Europe
      • Germany
      • UK
    • APAC
      • China
      • India
    • South America
    • Middle East and Africa

By Type Insights

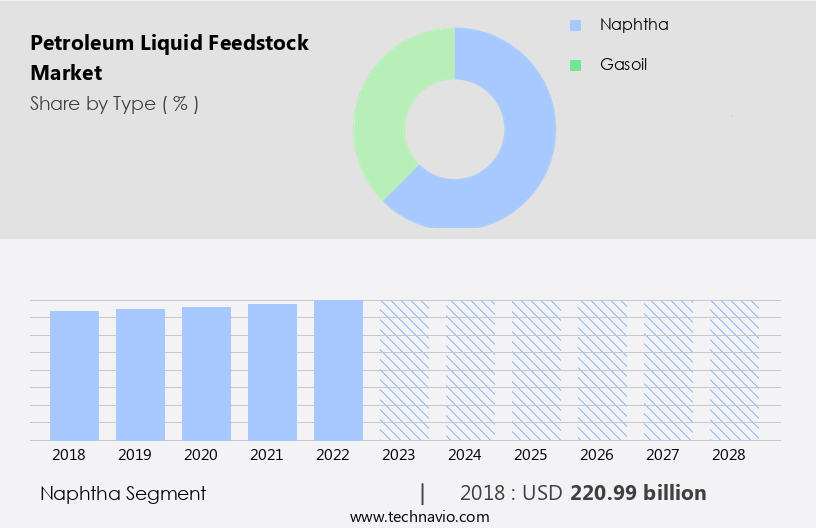
The naphtha segment is estimated to witness significant growth during the forecast period. The petrochemical industry relies heavily on petroleum liquid feedstock derived from crude oil for the production of various chemicals, polymers, and petrochemical products. In the refining process, crude oil undergoes primary distillation, resulting in the production of naphtha. This fractional distillation separates hydrocarbons based on their boiling points, yielding light and heavy naphtha. Light naphtha is primarily used as a feedstock for the synthesis of ethylene, which is further processed to produce synthetic rubber and other essential polymers. Conversely, heavy naphtha serves as a feedstock for the production of high-octane gasoline and aromatics, such as benzene, xylene, and toluene, essential for the automotive fleet and energy sector.

Moreover, naphtha is also used as marine fuel, bunkers, and motor vehicle fuel. With the increasing focus on cleaner energy sources and climate change mitigation, the petrochemical industry is exploring alternative feedstocks, such as biofuels, renewable feedstocks, biomass, waste oils, and even carbon fiber. Simultaneously, the exploration of unconventional crude oil deposits, including shale gas and offshore drilling, continues to expand refinery capacity. Data analytics plays a crucial role in optimizing refinery operations and enhancing the overall efficiency of the petrochemical sector. The chemical sector also utilizes naphtha, coal naphtha, and other hydrocarbons as feedstocks for steam crackers to produce essential chemicals, such as octane, propylene, and butadiene.

The integration of LNG terminals and gas imports further expands the availability of feedstocks, ensuring a steady supply to meet the growing demand for petrochemical products in various industries, including textiles, plastics, and the energy sector.

Petroleum Liquid Feedstock Market Size

Get a glance at the market share of various segments Request Free Sample

The Naphtha segment accounted for USD 220.99 billion in 2018 and showed a gradual increase during the forecast period.

Regional Insights

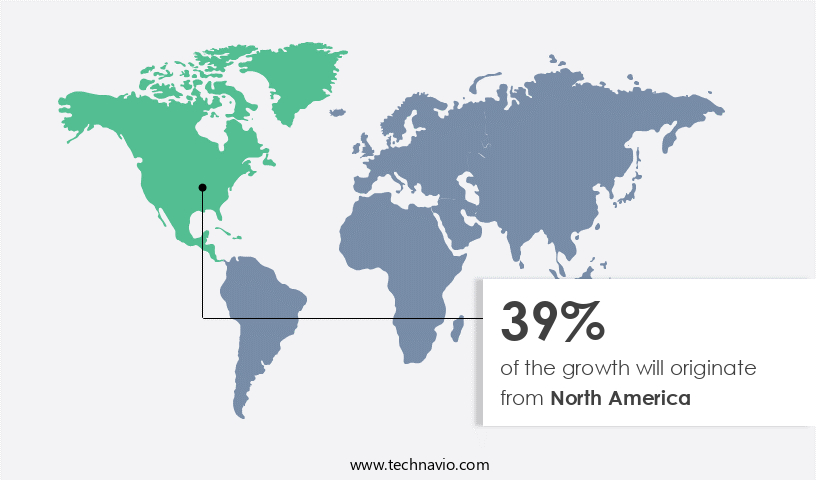
North America is estimated to contribute 39% to the growth of the global market during the forecast period. Technavio's analysts have elaborately explained the regional trends and drivers that shape the market during the forecast period.

Petroleum Liquid Feedstock Market Share by Geography

For more insights on the market share of various regions Request Free Sample

The market in North America is driven by the abundant availability of crude material from countries such as the US, Canada, and Mexico. This crude oil serves as the crude material for the production of essential feedstocks like naphtha and gas oil in refineries. The shale revolution in the US has resulted in an ample supply of raw materials, leading to the expansion of the refining sector in the region. In Canada, the integration of oil organizations ensures a consistent supply of feedstock from oil sands. The transportation sector, particularly automobiles, dominates the demand for fuels like gasoline and diesel in North America.

In 2023, the consumption of these fuels has waved, with the automotive industry continuing to be a significant consumer. Additionally, the chemical industries rely on feedstocks like pentane, paraffin, naphthenes, and aromatics such as xylene, benzene, and toluene for the production of industrial solvents, cleaning fluids, and other essential products. The transition towards electric vehicles is expected to impact the demand for traditional fuels, but the growth of heavy industries and the continued reliance on spark-ignited internal combustion engines in various applications will ensure the ongoing demand for petroleum liquid feedstocks in North America. The construction of new greenfield refineries is also expected to boost the market growth in the region.

Our researchers analyzed the data with 2023 as the base year, along with the key drivers, trends, and challenges. A holistic analysis of drivers will help companies refine their marketing strategies to gain a competitive advantage.

Petroleum Liquid Feedstock Market Driver

The rapid growth of transportation sector is the key driver of the market. The Petrochemical industry plays a significant role in the economic development of various sectors, including the automotive fleet and the energy sector. The increasing demand for petrochemical products, such as polymers, naphthalene, and synthetic rubber, has led to a wave in refinement capacity and the production of chemicals and polymers. The automotive industry, in particular, relies heavily on petrochemicals for the manufacturing of motor vehicles and engine vehicles. Naphtha, derived from crude oil or coal, is a primary feedstock used in the production of petrochemicals. The market has seen significant growth due to the increasing demand for petrochemicals in various industries, including textiles, plastics, and the chemical sector.

The energy sector also utilizes petroleum liquid feedstocks as marine fuel and bunkers. The exploration and production of crude oil deposits, offshore drilling, shale gas, and biofuels and renewable feedstocks, such as biomass, waste oils, and carbon fiber, are crucial to meeting the growing demand for petrochemicals. The use of data analytics and the shift towards cleaner energy sources, such as LNG terminals and gas imports, are also driving changes in the petrochemical industry. The petrochemical industry's growth is evident in the increasing refinery capacity and the production of hydrocarbons, such as ethylene and octane, used in the manufacturing of petrochemical products.

The demand for these products is expected to continue growing, driven by the increasing production of automobiles and commercial vehicles, as well as the demand for steam crackers and other petrochemical plants.

Petroleum Liquid Feedstock Market Trends

The adoption of blockchain in the oil and gas refining industry is the upcoming trend in the market. The Petrochemical industry relies heavily on petroleum refineries to produce essential feedstocks such as naphtha, which are further processed into chemicals, polymers, and other petrochemical products. The automotive fleet and energy sector are significant consumers of these petrochemicals, with motor vehicles and engine vehicles utilizing synthetic rubber, ethylene, octane, and steam crackers for fuel production. However, the refining process faces numerous challenges, including the complexity of logistics, particularly in regions with limited refinery capacity. Moreover, the energy sector's transition towards cleaner energy sources, such as biofuels and renewable feedstocks derived from biomass, waste oils, and carbon fiber, poses a threat to traditional petroleum refineries.

The exploration and production of unconventional resources, such as shale gas, offshore drilling, and crude oil deposits, require data analytics to optimize refinery operations and improve efficiency. Climate change concerns and the need for carbon reduction have led to the development of LNG terminals, gas imports, and the chemical sector's shift towards hydrocarbons and oil naphtha alternatives. The refining industry must address these challenges to maintain competitiveness and meet the evolving demands of various industries.

Petroleum Liquid Feedstock Market Challenge

The volatility in global crude oil prices is a key challenge affecting market growth. The market plays a pivotal role in the petrochemical industry, supplying essential raw materials for the production of various petrochemical products, including polymers, naphthalene, and chemicals. These feedstocks, primarily derived from naphtha and crude oil, are integral to the manufacturing of textiles, plastics, synthetic rubber, and steam crackers used to produce ethylene and octane. The automotive fleet and energy sector are significant consumers of these petrochemical products, with motor vehicles and engine vehicles relying on gasoline and diesel, while bunkers and marine fuel require heavy naphtha. Crude oil prices significantly influence the market, as fluctuations impact the profitability of refineries and petrochemical plants.

Lower crude oil prices can lead to the cancellation or postponement of oil and gas exploration and production projects. Conversely, the rise in shale gas exploration and offshore drilling of crude oil deposits has increased global supply, reducing the need for crude oil imports in countries like the US. The chemical sector also relies on petroleum liquid feedstocks, with steam crackers converting naphtha into ethylene, a primary building block for various polymers. The increasing focus on cleaner energy sources and climate change mitigation has led to the exploration of renewable feedstocks, such as biomass, waste oils, and biofuels, as alternatives to traditional hydrocarbons.

Data analytics plays a crucial role in optimizing refinery capacity and managing the supply chain in this dynamic market. LNG terminals and gas imports are becoming increasingly important in the petrochemical industry, providing alternative sources of feedstock for petrochemical plants. The integration of carbon fiber and other advanced materials into various industries is expected to further expand the application scope of petroleum liquid feedstocks. Overall, the market is a critical component of the global energy and chemical sectors, with its dynamics influenced by various factors, including crude oil prices, exploration trends, and the shift towards cleaner energy sources.

Exclusive Customer Landscape

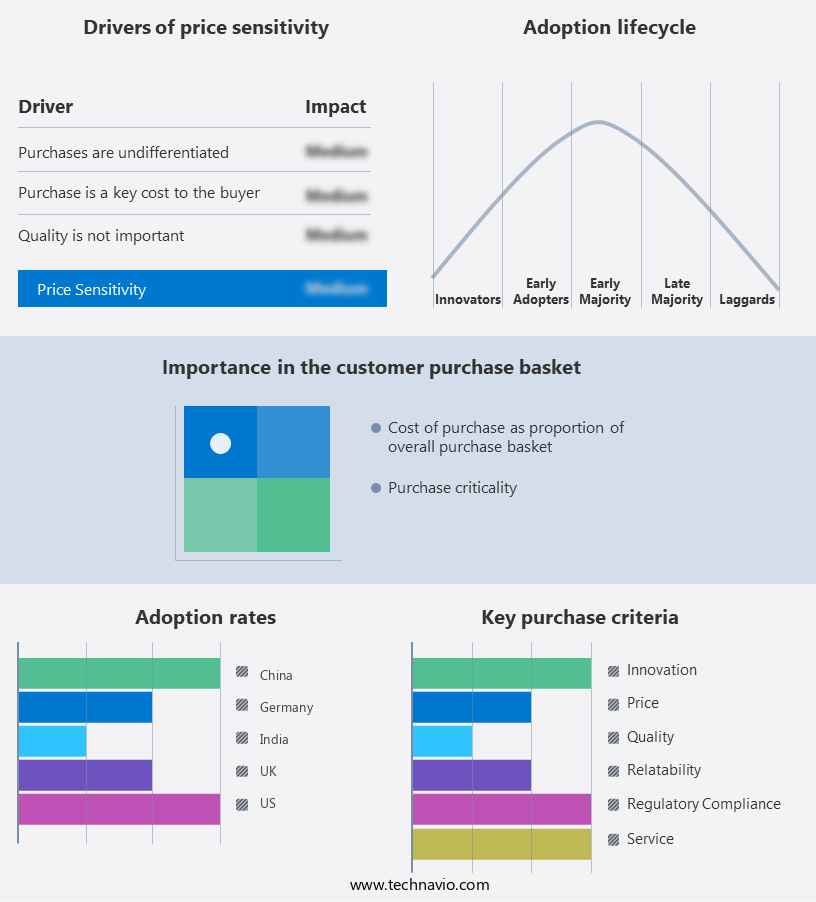
The market forecasting report includes the adoption lifecycle of the market, covering from the innovator's stage to the laggard's stage. It focuses on adoption rates in different regions based on penetration. Furthermore, the report also includes key purchase criteria and drivers of price sensitivity to help companies evaluate and develop their market growth analysis strategies.

Petroleum Liquid Feedstock Market Share by Geography

 Customer Landscape

Key Companies & Market Insights

Companies are implementing various strategies, such as strategic alliances, partnerships, mergers and acquisitions, geographical expansion, and product/service launches, to enhance their presence in the market.

The market research and growth report includes detailed analyses of the competitive landscape of the market and information about key companies, including:

  • BP Plc
  • CEF Group
  • Chevron Corp.
  • China National Petroleum Corp.
  • Eni SpA
  • Equinor ASA
  • Exxon Mobil Corp.
  • Gazprom Nedra LLC
  • Hindustan Petroleum Corp. Ltd.
  • Idemitsu Kosan Co. Ltd.
  • Koch Industries Inc.
  • Kuwait Petroleum Corp.
  • Nayara Energy Ltd.
  • Reliance Industries Ltd.
  • Rosneft Deutschland GmbH
  • Saudi Arabian Oil Co.
  • Shell plc
  • TotalEnergies SE
  • YPF SA

Qualitative and quantitative analysis of companies has been conducted to help clients understand the wider business environment as well as the strengths and weaknesses of key market players. Data is qualitatively analyzed to categorize companies as pure play, category-focused, industry-focused, and diversified; it is quantitatively analyzed to categorize companies as dominant, leading, strong, tentative, and weak.

Research Analyst Overview

The petrochemical industry relies heavily on petroleum liquid feedstocks, particularly naphtha, for the production of various chemicals, polymers, and petrochemical products. The automotive fleet and energy sector are significant consumers of these products, with motor vehicles and engine vehicles utilizing synthetic rubber, ethylene, octane, and other petrochemicals. Refineries play a crucial role in the production of naphtha through the refinement of crude oil, hydrocarbons, and oil naphtha. The exploration and production sector, including offshore drilling and shale gas, contribute to the availability of crude oil deposits. However, the increasing focus on cleaner energy sources, climate change mitigation, and the adoption of renewable feedstocks, such as biomass, biofuels, waste oils, and LNG terminals, are posing challenges to the petrochemical industry.

Further, the chemical sector also utilizes naphtha in the production of steam crackers, which are essential for the manufacture of ethylene and other essential chemicals. The market is expected to witness significant growth due to the increasing demand for polymers, textiles, plastics, and other petrochemical products. Data analytics is also being employed to optimize refinery capacity and improve the overall efficiency of the petrochemical industry.

Market Scope

Report Coverage

Details

Page number

181

Base year

2023

Historic period

2018-2022

Forecast period

2024-2028

Growth momentum & CAGR

Accelerate at a CAGR of 4.5%

Market growth 2024-2028

USD 77.22 billion

Market structure

Fragmented

YoY growth 2023-2024(%)

3.5

Regional analysis

North America, Europe, APAC, South America, and Middle East and Africa

Performing market contribution

North America at 39%

Key countries

US, China, India, Germany, and UK

Competitive landscape

Leading Companies, Market Positioning of Companies, Competitive Strategies, and Industry Risks

Key companies profiled

Bharat Petroleum Corp. Ltd., BP Plc, CEF Group, Chevron Corp., China National Petroleum Corp., Eni SpA, Equinor ASA, Exxon Mobil Corp., Gazprom Nedra LLC, Hindustan Petroleum Corp. Ltd., Idemitsu Kosan Co. Ltd., Koch Industries Inc., Kuwait Petroleum Corp., Nayara Energy Ltd., Reliance Industries Ltd., Rosneft Deutschland GmbH, Saudi Arabian Oil Co., Shell plc, TotalEnergies SE, and YPF SA

Market dynamics

Parent market analysis, market growth inducers and obstacles, market forecast, fast-growing and slow-growing segment analysis, COVID-19 impact and recovery analysis and future consumer dynamics, market condition analysis for the forecast period

Customization purview

If our market report has not included the data that you are looking for, you can reach out to our analysts and get segments customized.

Request Free Sample

What are the Key Data Covered in this Market Research and Growth Report?

  • CAGR of the market during the forecast period
  • Detailed information on factors that will drive the market growth and forecasting between 2024 and 2028
  • Precise estimation of the size of the market  and its contribution of the market in focus to the parent market
  • Accurate predictions about upcoming market growth and trends and changes in consumer behaviour
  • Growth of the market across North America, Europe, APAC, South America, and Middle East and Africa
  • Thorough analysis of the market's competitive landscape and detailed information about companies
  • Comprehensive analysis of factors that will challenge the growth of market companies

We can help! Our analysts can customize this market research report to meet your requirements. Get in touch

1 Executive Summary

  • 1.1 Market overview
    • Exhibit 01: Executive Summary – Chart on Market Overview
    • Exhibit 02: Executive Summary – Data Table on Market Overview
    • Exhibit 03: Executive Summary – Chart on Global Market Characteristics
    • Exhibit 04: Executive Summary – Chart on Market by Geography
    • Exhibit 05: Executive Summary – Chart on Market Segmentation by Type
    • Exhibit 06: Executive Summary – Chart on Market Segmentation by Application
    • Exhibit 07: Executive Summary – Chart on Incremental Growth
    • Exhibit 08: Executive Summary – Data Table on Incremental Growth
    • Exhibit 09: Executive Summary – Chart on Vendor Market Positioning

2 Market Landscape

  • 2.1 Market ecosystem
    • Exhibit 10: Parent market
    • Exhibit 11: Market Characteristics

3 Market Sizing

  • 3.1 Market definition
    • Exhibit 12: Offerings of vendors included in the market definition
  • 3.2 Market segment analysis
    • Exhibit 13: Market segments
  • 3.3 Market size 2023
    • 3.4 Market outlook: Forecast for 2023-2028
      • Exhibit 14: Chart on Global - Market size and forecast 2023-2028 ($ billion)
      • Exhibit 15: Data Table on Global - Market size and forecast 2023-2028 ($ billion)
      • Exhibit 16: Chart on Global Market: Year-over-year growth 2023-2028 (%)
      • Exhibit 17: Data Table on Global Market: Year-over-year growth 2023-2028 (%)

    4 Historic Market Size

    • 4.1 Global petroleum liquid feedstock market 2018 - 2022
      • Exhibit 18: Historic Market Size – Data Table on global petroleum liquid feedstock market 2018 - 2022 ($ billion)
    • 4.2 Type Segment Analysis 2018 - 2022
      • Exhibit 19: Historic Market Size – Type Segment 2018 - 2022 ($ billion)
    • 4.3 Application Segment Analysis 2018 - 2022
      • Exhibit 20: Historic Market Size – Application Segment 2018 - 2022 ($ billion)
    • 4.4 Geography Segment Analysis 2018 - 2022
      • Exhibit 21: Historic Market Size – Geography Segment 2018 - 2022 ($ billion)
    • 4.5 Country Segment Analysis 2018 - 2022
      • Exhibit 22: Historic Market Size – Country Segment 2018 - 2022 ($ billion)

    5 Five Forces Analysis

    • 5.1 Five forces summary
      • Exhibit 23: Five forces analysis - Comparison between 2023 and 2028
    • 5.2 Bargaining power of buyers
      • Exhibit 24: Chart on Bargaining power of buyers – Impact of key factors 2023 and 2028
    • 5.3 Bargaining power of suppliers
      • Exhibit 25: Bargaining power of suppliers – Impact of key factors in 2023 and 2028
    • 5.4 Threat of new entrants
      • Exhibit 26: Threat of new entrants – Impact of key factors in 2023 and 2028
    • 5.5 Threat of substitutes
      • Exhibit 27: Threat of substitutes – Impact of key factors in 2023 and 2028
    • 5.6 Threat of rivalry
      • Exhibit 28: Threat of rivalry – Impact of key factors in 2023 and 2028
    • 5.7 Market condition
      • Exhibit 29: Chart on Market condition - Five forces 2023 and 2028

    6 Market Segmentation by Type

    • 6.1 Market segments
      • Exhibit 30: Chart on Type - Market share 2023-2028 (%)
      • Exhibit 31: Data Table on Type - Market share 2023-2028 (%)
    • 6.2 Comparison by Type
      • Exhibit 32: Chart on Comparison by Type
      • Exhibit 33: Data Table on Comparison by Type
    • 6.3 Naphtha - Market size and forecast 2023-2028
      • Exhibit 34: Chart on Naphtha - Market size and forecast 2023-2028 ($ billion)
      • Exhibit 35: Data Table on Naphtha - Market size and forecast 2023-2028 ($ billion)
      • Exhibit 36: Chart on Naphtha - Year-over-year growth 2023-2028 (%)
      • Exhibit 37: Data Table on Naphtha - Year-over-year growth 2023-2028 (%)
    • 6.4 Gasoil - Market size and forecast 2023-2028
      • Exhibit 38: Chart on Gasoil - Market size and forecast 2023-2028 ($ billion)
      • Exhibit 39: Data Table on Gasoil - Market size and forecast 2023-2028 ($ billion)
      • Exhibit 40: Chart on Gasoil - Year-over-year growth 2023-2028 (%)
      • Exhibit 41: Data Table on Gasoil - Year-over-year growth 2023-2028 (%)
    • 6.5 Market opportunity by Type
      • Exhibit 42: Market opportunity by Type ($ billion)
      • Exhibit 43: Data Table on Market opportunity by Type ($ billion)

    7 Market Segmentation by Application

    • 7.1 Market segments
      • Exhibit 44: Chart on Application - Market share 2023-2028 (%)
      • Exhibit 45: Data Table on Application - Market share 2023-2028 (%)
    • 7.2 Comparison by Application
      • Exhibit 46: Chart on Comparison by Application
      • Exhibit 47: Data Table on Comparison by Application
    • 7.3 Industrial solvents - Market size and forecast 2023-2028
      • Exhibit 48: Chart on Industrial solvents - Market size and forecast 2023-2028 ($ billion)
      • Exhibit 49: Data Table on Industrial solvents - Market size and forecast 2023-2028 ($ billion)
      • Exhibit 50: Chart on Industrial solvents - Year-over-year growth 2023-2028 (%)
      • Exhibit 51: Data Table on Industrial solvents - Year-over-year growth 2023-2028 (%)
    • 7.4 Cleaning fluids - Market size and forecast 2023-2028
      • Exhibit 52: Chart on Cleaning fluids - Market size and forecast 2023-2028 ($ billion)
      • Exhibit 53: Data Table on Cleaning fluids - Market size and forecast 2023-2028 ($ billion)
      • Exhibit 54: Chart on Cleaning fluids - Year-over-year growth 2023-2028 (%)
      • Exhibit 55: Data Table on Cleaning fluids - Year-over-year growth 2023-2028 (%)
    • 7.5 Adulterant to petrol - Market size and forecast 2023-2028
      • Exhibit 56: Chart on Adulterant to petrol - Market size and forecast 2023-2028 ($ billion)
      • Exhibit 57: Data Table on Adulterant to petrol - Market size and forecast 2023-2028 ($ billion)
      • Exhibit 58: Chart on Adulterant to petrol - Year-over-year growth 2023-2028 (%)
      • Exhibit 59: Data Table on Adulterant to petrol - Year-over-year growth 2023-2028 (%)
    • 7.6 Gasoline - Market size and forecast 2023-2028
      • Exhibit 60: Chart on Gasoline - Market size and forecast 2023-2028 ($ billion)
      • Exhibit 61: Data Table on Gasoline - Market size and forecast 2023-2028 ($ billion)
      • Exhibit 62: Chart on Gasoline - Year-over-year growth 2023-2028 (%)
      • Exhibit 63: Data Table on Gasoline - Year-over-year growth 2023-2028 (%)
    • 7.7 Others - Market size and forecast 2023-2028
      • Exhibit 64: Chart on Others - Market size and forecast 2023-2028 ($ billion)
      • Exhibit 65: Data Table on Others - Market size and forecast 2023-2028 ($ billion)
      • Exhibit 66: Chart on Others - Year-over-year growth 2023-2028 (%)
      • Exhibit 67: Data Table on Others - Year-over-year growth 2023-2028 (%)
    • 7.8 Market opportunity by Application
      • Exhibit 68: Market opportunity by Application ($ billion)
      • Exhibit 69: Data Table on Market opportunity by Application ($ billion)

    8 Customer Landscape

    • 8.1 Customer landscape overview
      • Exhibit 70: Analysis of price sensitivity, lifecycle, customer purchase basket, adoption rates, and purchase criteria

    9 Geographic Landscape

    • 9.1 Geographic segmentation
      • Exhibit 71: Chart on Market share by geography 2023-2028 (%)
      • Exhibit 72: Data Table on Market share by geography 2023-2028 (%)
    • 9.2 Geographic comparison
      • Exhibit 73: Chart on Geographic comparison
      • Exhibit 74: Data Table on Geographic comparison
    • 9.3 North America - Market size and forecast 2023-2028
      • Exhibit 75: Chart on North America - Market size and forecast 2023-2028 ($ billion)
      • Exhibit 76: Data Table on North America - Market size and forecast 2023-2028 ($ billion)
      • Exhibit 77: Chart on North America - Year-over-year growth 2023-2028 (%)
      • Exhibit 78: Data Table on North America - Year-over-year growth 2023-2028 (%)
    • 9.4 Europe - Market size and forecast 2023-2028
      • Exhibit 79: Chart on Europe - Market size and forecast 2023-2028 ($ billion)
      • Exhibit 80: Data Table on Europe - Market size and forecast 2023-2028 ($ billion)
      • Exhibit 81: Chart on Europe - Year-over-year growth 2023-2028 (%)
      • Exhibit 82: Data Table on Europe - Year-over-year growth 2023-2028 (%)
    • 9.5 APAC - Market size and forecast 2023-2028
      • Exhibit 83: Chart on APAC - Market size and forecast 2023-2028 ($ billion)
      • Exhibit 84: Data Table on APAC - Market size and forecast 2023-2028 ($ billion)
      • Exhibit 85: Chart on APAC - Year-over-year growth 2023-2028 (%)
      • Exhibit 86: Data Table on APAC - Year-over-year growth 2023-2028 (%)
    • 9.6 South America - Market size and forecast 2023-2028
      • Exhibit 87: Chart on South America - Market size and forecast 2023-2028 ($ billion)
      • Exhibit 88: Data Table on South America - Market size and forecast 2023-2028 ($ billion)
      • Exhibit 89: Chart on South America - Year-over-year growth 2023-2028 (%)
      • Exhibit 90: Data Table on South America - Year-over-year growth 2023-2028 (%)
    • 9.7 Middle East and Africa - Market size and forecast 2023-2028
      • Exhibit 91: Chart on Middle East and Africa - Market size and forecast 2023-2028 ($ billion)
      • Exhibit 92: Data Table on Middle East and Africa - Market size and forecast 2023-2028 ($ billion)
      • Exhibit 93: Chart on Middle East and Africa - Year-over-year growth 2023-2028 (%)
      • Exhibit 94: Data Table on Middle East and Africa - Year-over-year growth 2023-2028 (%)
    • 9.8 US - Market size and forecast 2023-2028
      • Exhibit 95: Chart on US - Market size and forecast 2023-2028 ($ billion)
      • Exhibit 96: Data Table on US - Market size and forecast 2023-2028 ($ billion)
      • Exhibit 97: Chart on US - Year-over-year growth 2023-2028 (%)
      • Exhibit 98: Data Table on US - Year-over-year growth 2023-2028 (%)
    • 9.9 Germany - Market size and forecast 2023-2028
      • Exhibit 99: Chart on Germany - Market size and forecast 2023-2028 ($ billion)
      • Exhibit 100: Data Table on Germany - Market size and forecast 2023-2028 ($ billion)
      • Exhibit 101: Chart on Germany - Year-over-year growth 2023-2028 (%)
      • Exhibit 102: Data Table on Germany - Year-over-year growth 2023-2028 (%)
    • 9.10 China - Market size and forecast 2023-2028
      • Exhibit 103: Chart on China - Market size and forecast 2023-2028 ($ billion)
      • Exhibit 104: Data Table on China - Market size and forecast 2023-2028 ($ billion)
      • Exhibit 105: Chart on China - Year-over-year growth 2023-2028 (%)
      • Exhibit 106: Data Table on China - Year-over-year growth 2023-2028 (%)
    • 9.11 UK - Market size and forecast 2023-2028
      • Exhibit 107: Chart on UK - Market size and forecast 2023-2028 ($ billion)
      • Exhibit 108: Data Table on UK - Market size and forecast 2023-2028 ($ billion)
      • Exhibit 109: Chart on UK - Year-over-year growth 2023-2028 (%)
      • Exhibit 110: Data Table on UK - Year-over-year growth 2023-2028 (%)
    • 9.12 India - Market size and forecast 2023-2028
      • Exhibit 111: Chart on India - Market size and forecast 2023-2028 ($ billion)
      • Exhibit 112: Data Table on India - Market size and forecast 2023-2028 ($ billion)
      • Exhibit 113: Chart on India - Year-over-year growth 2023-2028 (%)
      • Exhibit 114: Data Table on India - Year-over-year growth 2023-2028 (%)
    • 9.13 Market opportunity by geography
      • Exhibit 115: Market opportunity by geography ($ billion)
      • Exhibit 116: Data Tables on Market opportunity by geography ($ billion)

    10 Drivers, Challenges, and Trends

    • 10.1 Market drivers
      • 10.2 Market challenges
        • 10.3 Impact of drivers and challenges
          • Exhibit 117: Impact of drivers and challenges in 2023 and 2028
        • 10.4 Market trends

          11 Vendor Landscape

          • 11.1 Overview
            • 11.2 Vendor landscape
              • Exhibit 118: Overview on Criticality of inputs and Factors of differentiation
            • 11.3 Landscape disruption
              • Exhibit 119: Overview on factors of disruption
            • 11.4 Industry risks
              • Exhibit 120: Impact of key risks on business

            12 Vendor Analysis

            • 12.1 Vendors covered
              • Exhibit 121: Vendors covered
            • 12.2 Market positioning of vendors
              • Exhibit 122: Matrix on vendor position and classification
            • 12.3 Bharat Petroleum Corp. Ltd.
              • Exhibit 123: Bharat Petroleum Corp. Ltd. - Overview
              • Exhibit 124: Bharat Petroleum Corp. Ltd. - Product / Service
              • Exhibit 125: Bharat Petroleum Corp. Ltd. - Key offerings
            • 12.4 BP Plc
              • Exhibit 126: BP Plc - Overview
              • Exhibit 127: BP Plc - Business segments
              • Exhibit 128: BP Plc - Key news
              • Exhibit 129: BP Plc - Key offerings
              • Exhibit 130: BP Plc - Segment focus
            • 12.5 Chevron Corp.
              • Exhibit 131: Chevron Corp. - Overview
              • Exhibit 132: Chevron Corp. - Business segments
              • Exhibit 133: Chevron Corp. - Key news
              • Exhibit 134: Chevron Corp. - Key offerings
              • Exhibit 135: Chevron Corp. - Segment focus
            • 12.6 China National Petroleum Corp.
              • Exhibit 136: China National Petroleum Corp. - Overview
              • Exhibit 137: China National Petroleum Corp. - Product / Service
              • Exhibit 138: China National Petroleum Corp. - Key offerings
            • 12.7 Equinor ASA
              • Exhibit 139: Equinor ASA - Overview
              • Exhibit 140: Equinor ASA - Business segments
              • Exhibit 141: Equinor ASA - Key offerings
              • Exhibit 142: Equinor ASA - Segment focus
            • 12.8 Exxon Mobil Corp.
              • Exhibit 143: Exxon Mobil Corp. - Overview
              • Exhibit 144: Exxon Mobil Corp. - Business segments
              • Exhibit 145: Exxon Mobil Corp. - Key offerings
              • Exhibit 146: Exxon Mobil Corp. - Segment focus
            • 12.9 Hindustan Petroleum Corp. Ltd.
              • Exhibit 147: Hindustan Petroleum Corp. Ltd. - Overview
              • Exhibit 148: Hindustan Petroleum Corp. Ltd. - Business segments
              • Exhibit 149: Hindustan Petroleum Corp. Ltd. - Key offerings
              • Exhibit 150: Hindustan Petroleum Corp. Ltd. - Segment focus
            • 12.10 Idemitsu Kosan Co. Ltd.
              • Exhibit 151: Idemitsu Kosan Co. Ltd. - Overview
              • Exhibit 152: Idemitsu Kosan Co. Ltd. - Business segments
              • Exhibit 153: Idemitsu Kosan Co. Ltd. - Key offerings
              • Exhibit 154: Idemitsu Kosan Co. Ltd. - Segment focus
            • 12.11 Koch Industries Inc.
              • Exhibit 155: Koch Industries Inc. - Overview
              • Exhibit 156: Koch Industries Inc. - Product / Service
              • Exhibit 157: Koch Industries Inc. - Key news
              • Exhibit 158: Koch Industries Inc. - Key offerings
            • 12.12 Kuwait Petroleum Corp.
              • Exhibit 159: Kuwait Petroleum Corp. - Overview
              • Exhibit 160: Kuwait Petroleum Corp. - Product / Service
              • Exhibit 161: Kuwait Petroleum Corp. - Key offerings
            • 12.13 Nayara Energy Ltd.
              • Exhibit 162: Nayara Energy Ltd. - Overview
              • Exhibit 163: Nayara Energy Ltd. - Product / Service
              • Exhibit 164: Nayara Energy Ltd. - Key offerings
            • 12.14 Reliance Industries Ltd.
              • Exhibit 165: Reliance Industries Ltd. - Overview
              • Exhibit 166: Reliance Industries Ltd. - Business segments
              • Exhibit 167: Reliance Industries Ltd. - Key news
              • Exhibit 168: Reliance Industries Ltd. - Key offerings
              • Exhibit 169: Reliance Industries Ltd. - Segment focus
            • 12.15 Shell plc
              • Exhibit 170: Shell plc - Overview
              • Exhibit 171: Shell plc - Business segments
              • Exhibit 172: Shell plc - Key offerings
              • Exhibit 173: Shell plc - Segment focus
            • 12.16 TotalEnergies SE
              • Exhibit 174: TotalEnergies SE - Overview
              • Exhibit 175: TotalEnergies SE - Business segments
              • Exhibit 176: TotalEnergies SE - Key news
              • Exhibit 177: TotalEnergies SE - Key offerings
              • Exhibit 178: TotalEnergies SE - Segment focus
            • 12.17 YPF SA
              • Exhibit 179: YPF SA - Overview
              • Exhibit 180: YPF SA - Business segments
              • Exhibit 181: YPF SA - Key offerings
              • Exhibit 182: YPF SA - Segment focus

            13 Appendix

            • 13.1 Scope of the report
              • 13.2 Inclusions and exclusions checklist
                • Exhibit 183: Inclusions checklist
                • Exhibit 184: Exclusions checklist
              • 13.3 Currency conversion rates for US$
                • Exhibit 185: Currency conversion rates for US$
              • 13.4 Research methodology
                • Exhibit 186: Research methodology
                • Exhibit 187: Validation techniques employed for market sizing
                • Exhibit 188: Information sources
              • 13.5 List of abbreviations
                • Exhibit 189: List of abbreviations

              Research Methodology

              Technavio presents a detailed picture of the market by way of study, synthesis, and summation of data from multiple sources. The analysts have presented the various facets of the market with a particular focus on identifying the key industry influencers. The data thus presented is comprehensive, reliable, and the result of extensive research, both primary and secondary.

              INFORMATION SOURCES

              Primary sources

              • Manufacturers and suppliers
              • Channel partners
              • Industry experts
              • Strategic decision makers

              Secondary sources

              • Industry journals and periodicals
              • Government data
              • Financial reports of key industry players
              • Historical data
              • Press releases

              DATA ANALYSIS

              Data Synthesis

              • Collation of data
              • Estimation of key figures
              • Analysis of derived insights

              Data Validation

              • Triangulation with data models
              • Reference against proprietary databases
              • Corroboration with industry experts

              REPORT WRITING

              Qualitative

              • Market drivers
              • Market challenges
              • Market trends
              • Five forces analysis

              Quantitative

              • Market size and forecast
              • Market segmentation
              • Geographical insights
              • Competitive landscape

              Interested in this report?

              Get your sample now to see our research methodology and insights!

              Download Now

              Frequently Asked Questions

              Petroleum Liquid Feedstock market growth will increase by $ 77.22 bn during 2024-2028.

              The Petroleum Liquid Feedstock market is expected to grow at a CAGR of 4.5% during 2024-2028.

              Petroleum Liquid Feedstock market is segmented by Type( Naphtha, Gasoil) Application( Industrial solvents, Cleaning fluids, Adulterant to petrol, Gasoline, Others)

              Bharat Petroleum Corp. Ltd., BP Plc, CEF Group, Chevron Corp., China National Petroleum Corp., Eni SpA, Equinor ASA, Exxon Mobil Corp., Gazprom Nedra LLC, Hindustan Petroleum Corp. Ltd., Idemitsu Kosan Co. Ltd., Koch Industries Inc., Kuwait Petroleum Corp., Nayara Energy Ltd., Reliance Industries Ltd., Rosneft Deutschland GmbH, Saudi Arabian Oil Co., Shell plc, TotalEnergies SE, YPF SA are a few of the key vendors in the Petroleum Liquid Feedstock market.

              North America will register the highest growth rate of 39% among the other regions. Therefore, the Petroleum Liquid Feedstock market in North America is expected to garner significant business opportunities for the vendors during the forecast period.

              US, China, India, Germany, UK

              • Rapid growth of transportation sectorTransportation plays an important role in the economic growth of a country by connecting people as well as enabling the trade of goods and services. In developing countries is the driving factor this market.
              • population growth and urbanization have driven infrastructure development in the transportation sector and consequently is the driving factor this market.
              • the demand for automobiles. Automobile production depends on demand from people. Global passenger car vehicle production in 2022 increased by more than 30% from that in 2018 is the driving factor this market.
              • indicating the growth in the global demand for passenger cars. Commercial vehicles are used for the transportation of goods and services. Global commercial vehicle production in 2022 increased by more than 30% from that in 2018 is the driving factor this market.
              • indicating strong growth in the demand for commercial vehicles. In 2022 is the driving factor this market.
              • North America is the driving factor this market.
              • Europe is the driving factor this market.
              • and South Asia collectively accounted for more than 40% of global commercial vehicle production. In the EU is the driving factor this market.
              • passenger car production in 2022 grew by more than 18% over that in 2018. The EU also witnessed substantial growth in commercial vehicle production in 2023. Automobile manufacturing companies are entering new geographic regions by launching attractive new vehicle models. In addition is the driving factor this market.
              • other automotive companies like Tesla Inc. is the driving factor this market.
              • Citroen UK Ltd. is the driving factor this market.
              • and Great Wall Motor Co. Ltd. are planning to enter the Indian automobile market by launching their respective car models in the coming years. Thus is the driving factor this market.
              • the growth in the automobile sector will spur the need for transportation fuel. Therefore is the driving factor this market.
              • the growth of the transportation sector will drive the demand for transportation fuels such as gasoline. Transportation fuels such as gasoline can be obtained by using gasoil as feedstock in the refineries. Therefore is the driving factor this market.
              • the need for transportation fuels will spur the production of petroleum liquid feedstock. This is the driving factor this market.
              • in turn is the driving factor this market.
              • will propel the global petroleum liquid feedstock market during the forecast period. is the driving factor this market.

              The Petroleum Liquid Feedstock market vendors should focus on grabbing business opportunities from the Naphtha segment as it accounted for the largest market share in the base year.