
Liquefied Petroleum Gas (LPG) Market Size 2025-2029
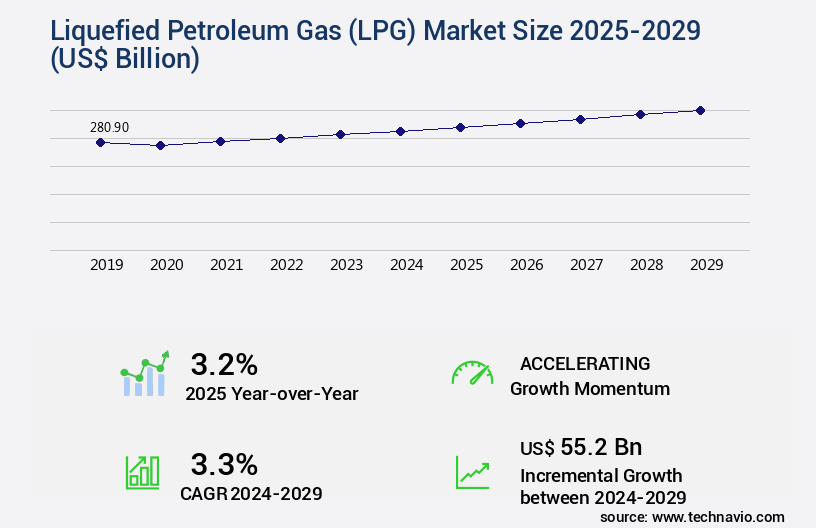
The liquefied petroleum gas (LPG) market size is valued to increase by USD 55.2 billion, at a CAGR of 3.3% from 2024 to 2029. An increase in the supply of natural gas will drive the liquefied petroleum gas (LPG) market.
Major Market Trends & Insights
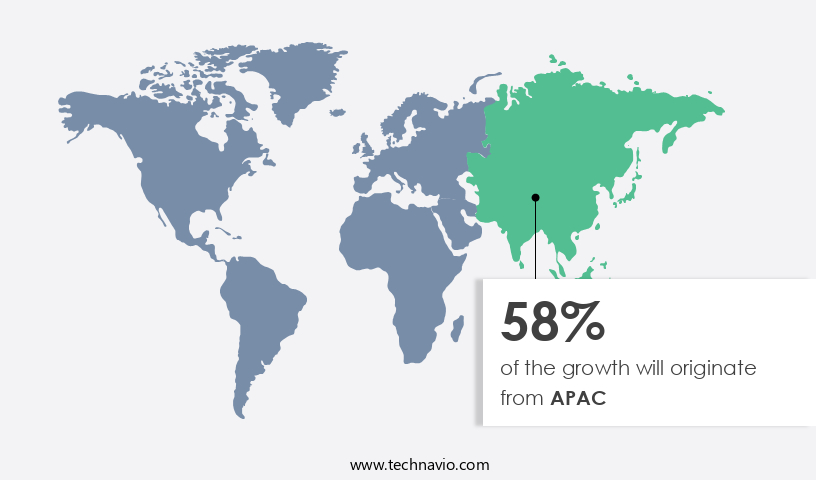
- APAC dominated the market and accounted for a 58% growth during the forecast period.
- By End-user - Residential segment was valued at USD 106.40 billion in 2023
- By Source - Natural gas liquid segment accounted for the largest market revenue share in 2023
Market Size & Forecast
- Market Opportunities: USD 29.69 billion
- Market Future Opportunities: USD 55.20 billion
- CAGR from 2024 to 2029: 3.3%
Market Summary
- The market is a dynamic and ever-evolving sector, driven by the continuous rise in supply of natural gas and the increasing adoption of core technologies such as virtual pipeline technology (VPT). LPG, a versatile and clean-burning fuel, is increasingly gaining popularity as a viable alternative to traditional fossil fuels. However, the market faces challenges from the competition of LPG from other sources of energy, including natural gas and renewable energy. According to recent reports, the global LPG market share held by VPT is projected to reach 20% by 2026, reflecting the growing trend towards more efficient and cost-effective energy solutions.
- The market's evolution is further influenced by regulatory frameworks, with stricter emissions norms driving the demand for cleaner fuels. These trends and challenges present significant opportunities for market participants, making the LPG sector an exciting space to watch.
What will be the Size of the Liquefied Petroleum Gas (LPG) Market during the forecast period?
Get Key Insights on Market Forecast (PDF) Request Free Sample
How is the Liquefied Petroleum Gas (LPG) Market Segmented ?
The liquefied petroleum gas (LPG) industry research report provides comprehensive data (region-wise segment analysis), with forecasts and estimates in "USD billion" for the period 2025-2029, as well as historical data from 2019-2023 for the following segments.
- End-user
- Residential
- Petrochemical
- Industrial and commercial
- Transport
- Others
- Source
- Natural gas liquid
- Crude oil
- Distribution Channel
- Cylinder Distribution
- Bulk
- On-site storage
- Geography
- North America
- US
- Canada
- Europe
- Germany
- UK
- APAC
- Australia
- China
- India
- Japan
- South Korea
- South America
- Brazil
- Rest of World (ROW)
- North America
By End-user Insights
The residential segment is estimated to witness significant growth during the forecast period.
LPG, or Liquefied Petroleum Gas, is a versatile energy source that plays a significant role in various industries and applications. Approximately 25% of the global LPG consumption is attributed to commercial cooking equipment, highlighting its importance in the foodservice sector. Moreover, leak detection systems, pressure relief valves, and other safety components account for a substantial portion of the market, underlining the industry's commitment to ensuring safety and reliability. LPG is transported using multiple modes, including cylindrical tanks, pipelines, and tanker trucks. Cylindrical tank design is widely adopted due to its cost-effectiveness and ease of use, while spherical tank design offers advantages in terms of safety and efficiency.
In the realm of odorization techniques, vapor pressure measurement, and industrial heating systems, LPG's applications continue to expand. Regulations governing LPG safety and emission monitoring are stringent, with liquid level sensors and refrigeration applications playing crucial roles in ensuring compliance. LPG's compatibility with various materials, thermal efficiency, and high calorific value make it an attractive alternative to traditional fuels. Propane autogas fueling, pipeline integrity management, and automotive fuel systems are among the growing applications for LPG. Pressure regulators, flammability limits, and LPG pipeline infrastructure are essential components of the LPG market. Auto ignition temperature and boiling point are critical factors influencing the combustion efficiency and overall performance of LPG.
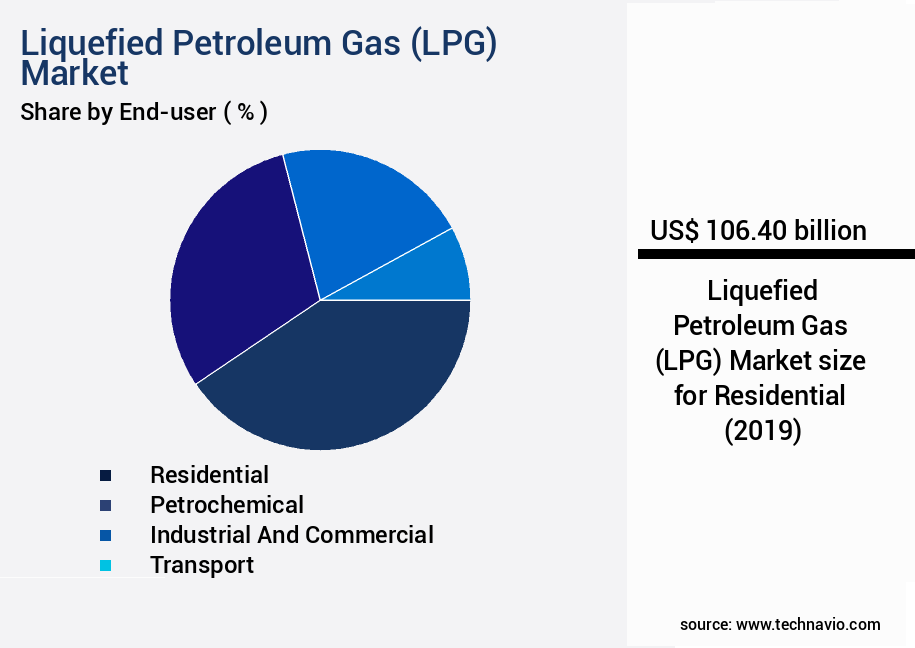
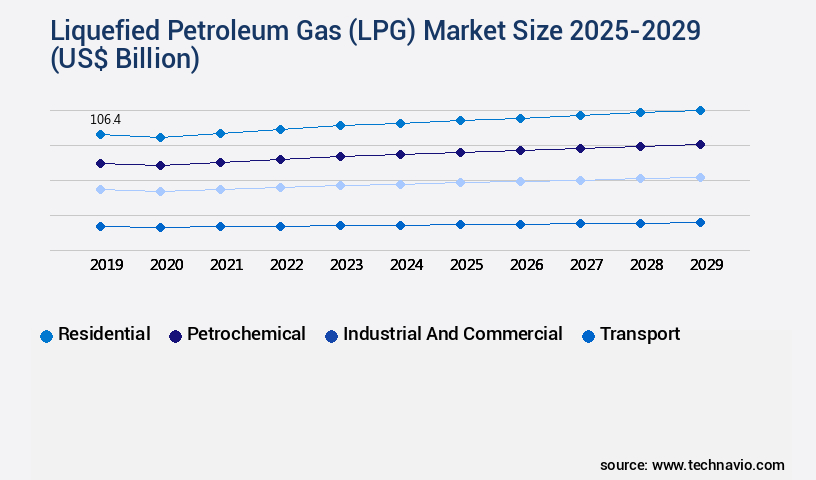
The Residential segment was valued at USD 106.40 billion in 2019 and showed a gradual increase during the forecast period.
Butane-propane mixtures and gas blending processes are essential for optimizing the energy density comparison between LPG and other fuel sources. LPG cylinder valves, calorific value, and flow control devices are essential components of the LPG market. Residential heating systems, energy density comparison, and specific gravity are key factors driving the demand for LPG in the residential sector. The LPG storage tank market is expected to grow by 15% in the next five years, while the LPG dispensing pumps market is projected to expand by 12%. These trends underscore the ongoing evolution and growth of the LPG market.
Regional Analysis
APAC is estimated to contribute 58% to the growth of the global market during the forecast period. Technavio's analysts have elaborately explained the regional trends and drivers that shape the market during the forecast period.
See How Liquefied Petroleum Gas (LPG) Market Demand is Rising in APAC Request Free Sample
In the dynamic APAC market, Liquefied Petroleum Gas (LPG) is experiencing significant demand due to urbanization and industrialization. Widely adopted for cooking, heating, power generation, and industrial processes, LPG's versatility fuels regional growth. Population expansion and increasing disposable income levels in APAC countries contribute to escalating consumption for domestic uses. The transition from traditional fuels like biomass and coal to LPG for cleaner alternatives is further boosting demand.
Governments in the region, such as India, implement subsidies and incentives to encourage LPG adoption, creating a favorable market environment.
Market Dynamics
Our researchers analyzed the data with 2024 as the base year, along with the key drivers, trends, and challenges. A holistic analysis of drivers will help companies refine their marketing strategies to gain a competitive advantage.
The market encompasses a diverse range of applications, from industrial processes and automotive fuel to residential and commercial heating solutions. This market's growth is driven by various factors, including the increasing demand for cleaner energy sources and the ongoing development of advanced technologies in LPG storage, transportation, and utilization. LPG's unique properties, such as its butane-propane mixture and accurate vapor pressure measurement techniques, make it an attractive alternative to traditional fossil fuels. In the automotive sector, propane autogas vehicle conversion continues to gain traction due to its environmental benefits and cost-effectiveness. Meanwhile, in the industrial sector, LPG's high energy density and efficiency make it an essential component in various applications, including refrigeration systems and industrial heating systems.
Safety is a critical aspect of the LPG market, with stringent regulations and compliance measures in place to ensure the safe handling, transportation, and storage of LPG. LPG storage tank design codes, such as ASME and EN standards, dictate the design and construction of LPG tanks to ensure their integrity. Pressure relief valve sizing calculations and effective odorization techniques are also essential to prevent potential accidents and ensure public safety. Advanced leak detection systems and optimized gas blending processes further enhance the efficiency and safety of LPG applications. For instance, the adoption of advanced leak detection systems has led to a significant reduction in the number of incidents, while optimized gas blending processes ensure the accurate composition of LPG mixtures for various applications.
In terms of transportation modes, efficient LPG transportation methods, such as pipelines and cylindrical/spherical tanks, play a crucial role in the market's growth. The industrial application segment accounts for a significantly larger share of the LPG market due to its extensive use in various industries. However, the residential and commercial sectors are also growing rapidly, with LPG being used for cooking equipment and heating systems. In conclusion, the LPG market is a dynamic and evolving industry, driven by advancements in technology, increasing demand for cleaner energy sources, and stringent safety regulations. The market's growth is reflected in the significant investments being made in research and development, as well as the increasing adoption of LPG in various applications.
The liquefied petroleum gas (LPG) market plays a critical role in global energy supply, offering a cleaner alternative to conventional fossil fuels. As the market expands, ensuring the safety and efficiency of LPG systems has become increasingly important. One of the key areas of focus is LPG cylinder valve safety features, which are designed to prevent accidental release, ensure proper sealing, and provide pressure relief during abnormal operating conditions. These features are essential for both domestic and industrial applications where reliability is paramount. Understanding the butane propane mixture properties is fundamental to optimizing performance across different climates and use cases. The ratio affects vapor pressure, combustion characteristics, and energy output, influencing decisions in both distribution and end-use sectors.
To maintain infrastructure reliability, regular LPG pipeline integrity assessment is critical. Techniques such as pressure testing, ultrasonic inspections, and corrosion monitoring help identify potential failures before they pose a risk to public safety or system operation. Regulatory compliance is a cornerstone of the industry. Adhering to lpg safety regulations and compliance standards ensures that all stages—from storage and transportation to usage—meet national and international safety benchmarks. These regulations also govern aspects such as equipment standards, personnel training, and emergency protocols.
A vital component of consumer safety is the implementation of effective odorization techniques for LPG. Since LPG is naturally odorless, adding odorants like ethyl mercaptan enables leak detection by smell, serving as an early warning mechanism in residential and commercial environments. Technological advancements are enhancing detection capabilities with the deployment of advanced leak detection systems for LPG. These systems use sensors, wireless alerts, and real-time monitoring to identify leaks quickly and accurately, minimizing risk and downtime.
On the production side, optimized gas blending processes for LPG ensure consistent quality and performance. Precision in blending helps maintain the desired butane-propane ratios, reduce processing losses, and meet specific market or seasonal requirements. As the LPG market continues to grow in importance as a transitional energy source, innovation in safety, processing, and monitoring technologies will be crucial in supporting sustainable and secure energy delivery worldwide.
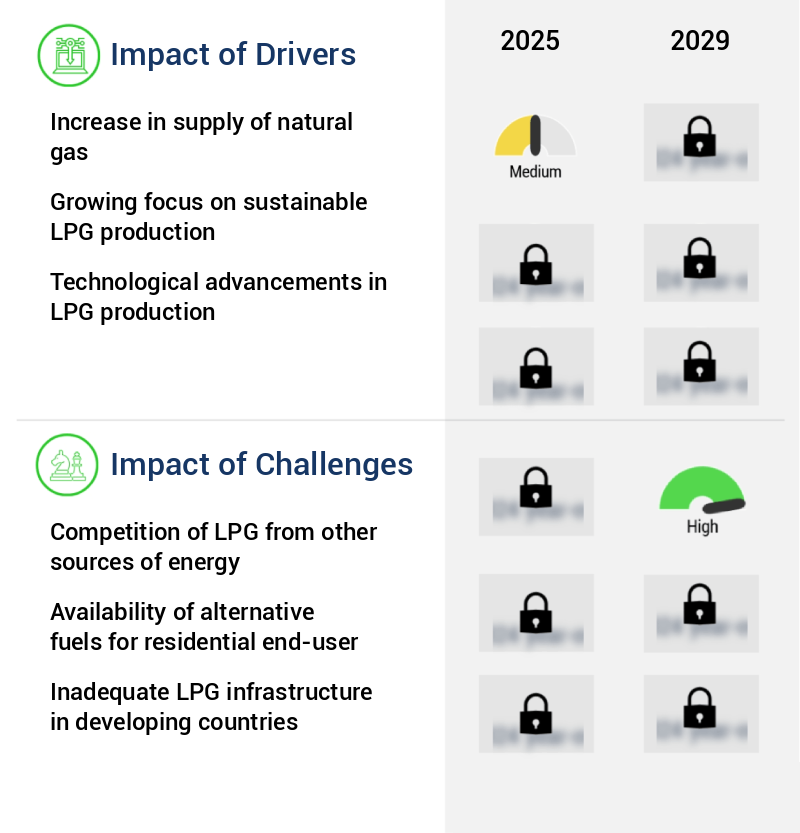
What are the key market drivers leading to the rise in the adoption of Liquefied Petroleum Gas (LPG) Industry?
- The primary factor driving the natural gas market is the increase in its supply.
- Natural gas, derived from unconventional resources like coalbed methane, shale gas, and tight gas, has emerged as the fastest-growing fossil fuel in the global oil and gas industry. The International Energy Agency (IEA) forecasts a substantial increase in natural gas consumption, from 3,630 billion cubic meters (bcm) in 2016 to 4,239 bcm by 2024. This expansion is primarily driven by the successful extraction of shale oil and gas in countries such as the US, which accounted for 40% of the global natural gas output growth from 2017 to 2024.
- The unconventional gas sector's continuous growth and evolution have significantly impacted the energy landscape, offering new opportunities across various sectors. The IEA's projections underscore the dynamic nature of this market and its expanding role in the global energy mix.
What are the market trends shaping the Liquefied Petroleum Gas (LPG) Industry?
- The rise of virtual pipeline technology (VPT) represents a significant market trend in the technological landscape. This emerging technology is poised to make a substantial impact.
- Vapor-Pressure Transportation (VPT) plays a crucial role in expanding the market reach of Liquefied Petroleum Gas (LPG) suppliers. By enabling the transportation of LPG to remote and off-grid areas, VPT allows for the servicing of previously underserved or inaccessible sectors in rural, industrial, and residential areas. In regions with limited access to clean and affordable energy, VPT offers a reliable and flexible solution. This is particularly significant in developing countries like Bangladesh, Nepal, and Indonesia, where VPT helps improve energy access, reduce reliance on traditional biomass fuels, and enhance living standards.
- VPT's flexibility extends to transportation modes, with LPG being transported via trucks, railcars, ships, or a combination of these methods. This adaptability ensures efficient and effective delivery to a broad customer base.
What challenges does the Liquefied Petroleum Gas (LPG) Industry face during its growth?
- The growth of the LPG industry is significantly influenced by the intense competition from other energy sources, posing a major challenge that must be addressed by industry professionals.
- The renewable energy market's expansion, driven by government initiatives and subsidies, has significantly impacted various sectors' energy consumption patterns. For example, the European Union aims for a 35% share of renewable energy sources in power generation by 2030, limiting the use of natural gas in residential, industrial, and commercial sectors. Consequently, the adoption of liquefied petroleum gas (LPG) may be restrained. Simultaneously, the automotive sector has witnessed a surge in electric vehicles (EVs) due to extensive marketing efforts by manufacturers and increasing consumer awareness.
- This shift towards renewable energy and electric vehicles poses an evolving landscape for energy markets, with wind and solar power gaining traction in power generation and EVs disrupting traditional fuel consumption trends.
Exclusive Technavio Analysis on Customer Landscape
The liquefied petroleum gas (LPG) market forecasting report includes the adoption lifecycle of the market, covering from the innovator's stage to the laggard's stage. It focuses on adoption rates in different regions based on penetration. Furthermore, the liquefied petroleum gas (LPG) market report also includes key purchase criteria and drivers of price sensitivity to help companies evaluate and develop their market growth analysis strategies.
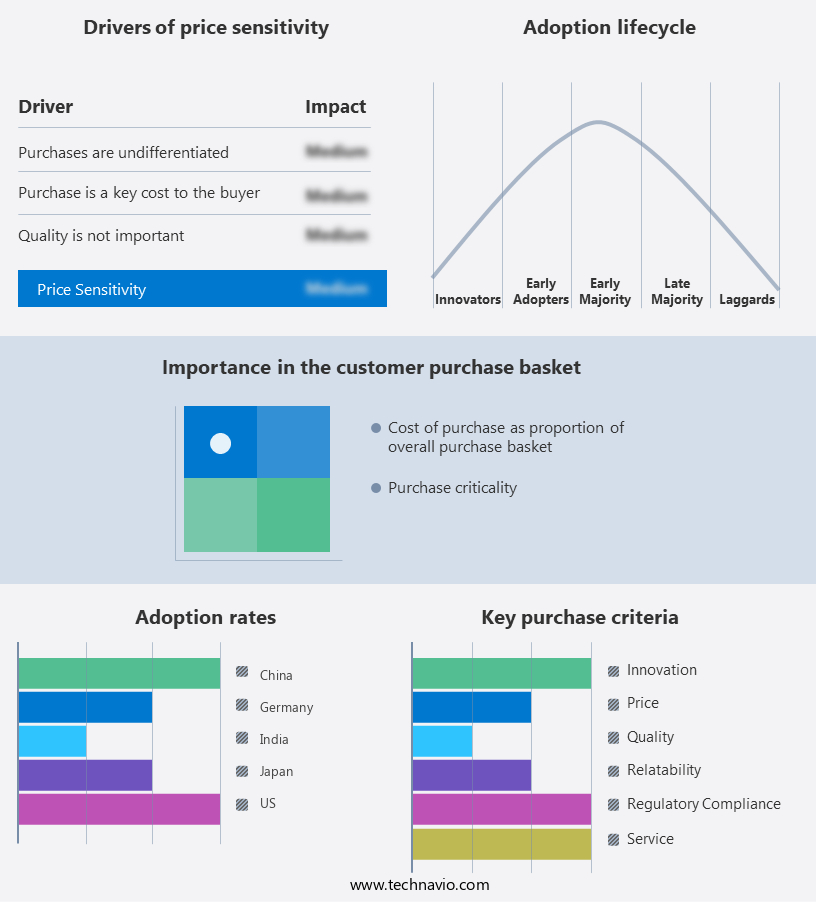
Customer Landscape of Liquefied Petroleum Gas (LPG) Industry
Competitive Landscape
Companies are implementing various strategies, such as strategic alliances, liquefied petroleum gas (LPG) market forecast, partnerships, mergers and acquisitions, geographical expansion, and product/service launches, to enhance their presence in the industry.
Abu Dhabi National Oil Co. - The company specializes in providing Liquified Petroleum Gas (LPG) to various industries such as hospitality, food and beverage, and the residential sector, via pipelines.
The industry research and growth report includes detailed analyses of the competitive landscape of the market and information about key companies, including:
- Abu Dhabi National Oil Co.
- Air Liquide SA
- Bharat Petroleum Corp. Ltd.
- Chevron Corp.
- Exxon Mobil Corp.
- Hindustan Petroleum Corp. Ltd.
- Indian Oil Corp. Ltd.
- Kuwait Petroleum Corp.
- Linde Plc
- OQ SAOC
- QatarEnergy
- Reliance Industries Ltd.
- Sahara Group Ltd.
- Saudi Arabian Oil Co.
- Shell plc
- SHV Holdings N.V.
- TotalEnergies SE
- UGI Corp.
- Vitol Netherlands Cooperatief UA
Qualitative and quantitative analysis of companies has been conducted to help clients understand the wider business environment as well as the strengths and weaknesses of key industry players. Data is qualitatively analyzed to categorize companies as pure play, category-focused, industry-focused, and diversified; it is quantitatively analyzed to categorize companies as dominant, leading, strong, tentative, and weak.
Recent Development and News in Liquefied Petroleum Gas (LPG) Market
- In January 2024, Shell and Qatar Petroleum announced a strategic partnership to expand their LPG trading joint venture, LPG International B.V. (LPGI). This collaboration aimed to strengthen their market position and enhance their LPG supply capabilities, as stated in Shell's official press release.
- In March 2024, the Indian government announced the National Gas Policy, which included initiatives to increase LPG usage and infrastructure development. This policy change was expected to boost the demand for LPG in India, as reported by the Press Information Bureau, Ministry of Petroleum and Natural Gas.
- In May 2024, BP completed the acquisition of Chargemaster, the UK's leading electric vehicle charging network. Although primarily focused on electric vehicle charging, BP's acquisition of Chargemaster signaled their intent to expand their energy offerings beyond traditional fuels, including LPG, as stated in BP's press release.
- In February 2025, Linde plc and Praxair, Inc. completed their merger to form Linde plc, creating the world's largest industrial gases company. This merger brought together two major players in the LPG market, potentially leading to increased competition and innovation, as reported in Linde's official press release.
Dive into Technavio's robust research methodology, blending expert interviews, extensive data synthesis, and validated models for unparalleled Liquefied Petroleum Gas (LPG) Market insights. See full methodology.
|
Market Scope |
|
|
Report Coverage |
Details |
|
Page number |
227 |
|
Base year |
2024 |
|
Historic period |
2019-2023 |
|
Forecast period |
2025-2029 |
|
Growth momentum & CAGR |
Accelerate at a CAGR of 3.3% |
|
Market growth 2025-2029 |
USD 55.2 billion |
|
Market structure |
Fragmented |
|
YoY growth 2024-2025(%) |
3.2 |
|
Key countries |
China, US, India, Japan, Germany, South Korea, Australia, UK, Canada, and Brazil |
|
Competitive landscape |
Leading Companies, Market Positioning of Companies, Competitive Strategies, and Industry Risks |
Research Analyst Overview
- In the dynamic and evolving market, commercial cooking equipment and industrial heating systems continue to drive demand. Leak detection systems and pressure relief valves are essential components ensuring LPG transportation safety, with cylindrical tank designs and odorization techniques enhancing user experience and safety. Vapor pressure measurement plays a crucial role in LPG handling, while emission monitoring and liquid level sensors contribute to environmental sustainability. LPG's versatility extends to refrigeration applications, industrial processes, and even as an alternative fuel in propane autogas fueling and automotive fuel systems. Material compatibility and thermal efficiency are significant factors in LPG's adoption across various industries.
- LPG safety regulations govern the market, with pipeline integrity management and pressure regulators ensuring safe transportation and usage. Flammability limits and auto ignition temperature are essential safety considerations. LPG pipelines and infrastructure support the energy density comparison between LPG and other fuels, making LPG a viable alternative. Spherical tank design and butane-propane mixtures offer advantages in terms of energy efficiency and storage capacity. Gas blending processes optimize LPG's combustion efficiency, and LPG cylinder valves ensure seamless dispensing through LPG dispensing pumps. Residential heating systems benefit from LPG's energy density and specific gravity, making it an attractive alternative to traditional heating sources.
- The market's continuous evolution is reflected in the ongoing development of advanced technologies, such as energy-efficient LPG storage tanks and innovative flow control devices.
What are the Key Data Covered in this Liquefied Petroleum Gas (LPG) Market Research and Growth Report?
-
What is the expected growth of the Liquefied Petroleum Gas (LPG) Market between 2025 and 2029?
-
USD 55.2 billion, at a CAGR of 3.3%
-
-
What segmentation does the market report cover?
-
The report is segmented by End-user (Residential, Petrochemical, Industrial and commercial, Transport, and Others), Source (Natural gas liquid and Crude oil), Distribution Channel (Cylinder Distribution, Bulk, and On-site storage), and Geography (APAC, North America, Europe, South America, and Middle East and Africa)
-
-
Which regions are analyzed in the report?
-
APAC, North America, Europe, South America, and Middle East and Africa
-
-
What are the key growth drivers and market challenges?
-
Increase in supply of natural gas, Competition of LPG from other sources of energy
-
-
Who are the major players in the Liquefied Petroleum Gas (LPG) Market?
-
Abu Dhabi National Oil Co., Air Liquide SA, Bharat Petroleum Corp. Ltd., Chevron Corp., Exxon Mobil Corp., Hindustan Petroleum Corp. Ltd., Indian Oil Corp. Ltd., Kuwait Petroleum Corp., Linde Plc, OQ SAOC, QatarEnergy, Reliance Industries Ltd., Sahara Group Ltd., Saudi Arabian Oil Co., Shell plc, SHV Holdings N.V., TotalEnergies SE, UGI Corp., and Vitol Netherlands Cooperatief UA
-
Market Research Insights
- The LPG market encompasses a complex web of supply chains, handling procedures, and regulatory compliance. With growing emphasis on emission reduction strategies, LPG's role as a clean-burning alternative to traditional fossil fuels continues to expand. In 2021, LPG consumption rate reached an all-time high of 310 million metric tons, representing a 3% annual increase. This growth is driven by domestic usage in various sectors, including industrial processes and residential heating. In contrast, LPG infrastructure investment has seen a slower pace, with a 1% annual growth rate in 2021. Bulk LPG storage and distribution networks require significant capital expenditures for construction and maintenance.
- However, advancements in technology, such as leak detection sensors and energy conservation methods, are improving efficiency and reducing operational costs. These investments are essential to meet the increasing demand for LPG and ensure regulatory compliance. Additionally, the implementation of safety training programs and propane refrigeration systems further enhances the market's appeal. Despite price volatility, the LPG market remains a dynamic and evolving landscape, with ongoing investment in innovation and sustainability.
We can help! Our analysts can customize this liquefied petroleum gas (LPG) market research report to meet your requirements.
 RIA -
RIA - 
