Natural Antioxidants Market Analysis APAC, North America, Europe, Middle East and Africa, South America - China, US, Japan, Germany, UK, Canada - Size and Forecast 2024-2028

Natural Antioxidants Market Analysis APAC, North America, Europe, Middle East and Africa, South America - China, US, Japan, Germany, UK, Canada - Size and Forecast 2024-2028

Published: Aug 2024 175 Pages SKU: IRTNTR73778

Market Overview at a Glance

$669.6 Mn
Market Opportunity
7.07%
CAGR
6.45
YoY growth 2023-2024(%)

Natural Antioxidants Market Size 2024-2028 

The natural antioxidants market size is forecast to increase by USD 669.6 million at a CAGR of 7.07% between 2023 and 2028.

  • The market is experiencing significant growth due to increasing demand from the cosmetics business and the nutraceutical industry. Pine, Acerola seed, green tea, and other plant-derived antioxidants are gaining popularity in both dry and liquid forms. Tocopherols, derived from natural sources, are also in high demand. The market is witnessing significant growth due to the increasing demand for Cosmetics and organic skincare products with natural ingredients. However, the high cost of natural antioxidants is a challenge for market growth. Synthetic antioxidants derived from petroleum products continue to be used due to their lower cost. The market is expected to continue its growth due to Urbanization and demands for vitamins, Carotenoids, and other antioxidants' health benefits. The trend toward a healthier diet and growing population further fuels the demand for natural antioxidants. To stay competitive, companies must focus on innovation and cost reduction while maintaining product quality.

What will be the Size of the Market During the Forecast Period?

Natural Antioxidants Market Size

 Request Free Sample

  • The market is witnessing significant growth due to the increasing consumer preference for healthier food and beverage options and the rising demand for clean-label products. Antioxidants are essential compounds that inhibit the oxidation and decomposition process in various products, including processed food and dietary supplements. These compounds are naturally found in various sources such as trees, plants, nuts, roots, seeds, and leaves. The market is driven by the nutraceutical industry, which includes dietary supplements and functional foods. Consumers are increasingly turning to these products to maintain their health and wellness, and natural antioxidants are a popular choice due to their numerous health benefits.
  • Online retail channels have also played a significant role in the growth of the market. The convenience and accessibility offered by e-commerce platforms have made it easier for consumers to purchase natural antioxidant-rich products from the comfort of their homes. The demand for natural antioxidants is not limited to the nutraceutical industry. They are also widely used in the cosmetics and skincare industry due to their anti-aging properties. The increasing products demand is derived from trees/plants, such as bioactive compounds found in barks, is driven by growing health and wellness awareness, as consumers seek natural solutions to support their well-being and combat the oxidation/decomposition process in the body. Natural antioxidants help protect the skin from damage caused by free radicals, making them a popular ingredient in various skincare products. The natural sources of antioxidants include various trees, plants, nuts, roots, seeds, and leaves.

How is this market segmented and which is the largest segment?

The market research report provides comprehensive data (region-wise segment analysis), with forecasts and estimates in "USD million" for the period 2024-2028, as well as historical data from 2018-2022 for the following segments.

  • Application
    • Food and beverages
    • Pharmaceuticals
    • Personal care
    • Animal feeds
  • Type
    • Vitamin C-based
    • Vitamin E-based
    • Polyphenols-based
    • Carotenoids-based
  • Geography
    • APAC
      • China
      • Japan
    • North America
      • Canada
      • US
    • Europe
      • Germany
      • UK
    • Middle East and Africa
    • South America

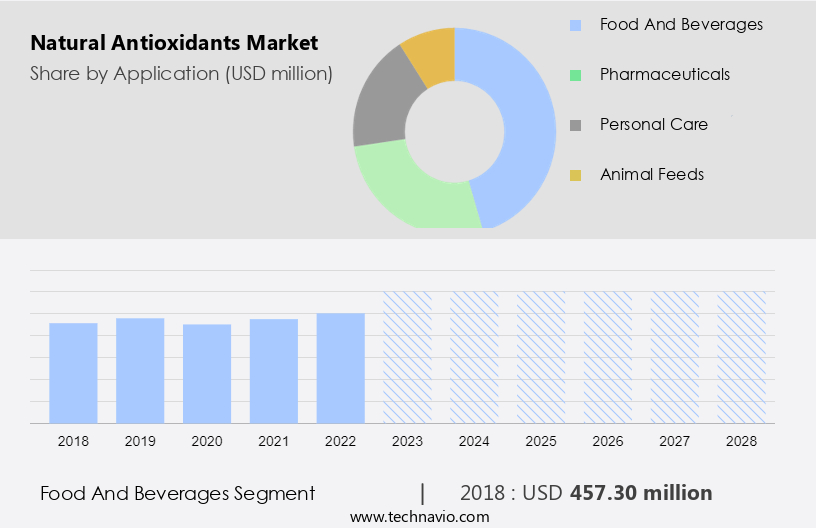
By Application Insights

  • The food and beverages segment is estimated to witness significant growth during the forecast period.

Natural antioxidants play a significant role in the food and beverages industry, acting as both essential nutrients and product enhancers. The oxidation of food can lead to spoilage and undesirable flavors, reducing freshness and ultimately impacting health benefits. Antioxidants, such as rosemary extracts, tocopherols, and ascorbic acid, are increasingly utilized to prevent oxidation and extend the shelf life of various food and beverage products. These natural antioxidants are particularly popular in the beverage sector, where they contribute to improved shelf life and flavor stability. The regulatory requirements for organic certifications and consumer demand for healthier processed and convenience foods further fuel the adoption of natural antioxidants in the industry.

Natural Antioxidants Market Size

Get a glance at the market report of share of various segments Request Free Sample

The food and beverages segment was valued at USD 457.30 million in 2018 and showed a gradual increase during the forecast period.
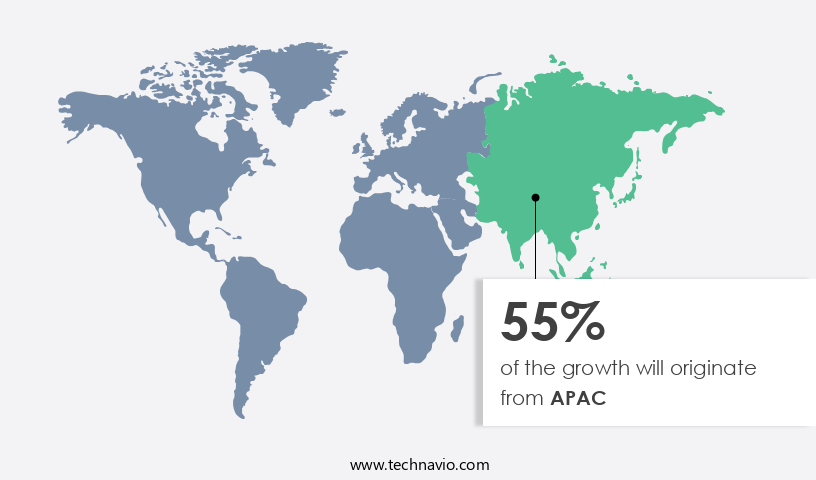
Regional Analysis

  • APAC is estimated to contribute 55% to the growth of the global market during the forecast period.

Technavio's analysts have elaborately explained the regional trends and drivers that shape the market during the forecast period.

Natural Antioxidants Market Share by Geography

For more insights on the market share of various regions Request Free Sample

The natural antioxidant sector is witnessing significant growth in various industries, including body lotions, creams, shampoos, and conditioners. According to recent market research, APAC is the leading region in the market, accounting for the largest share in 2023. This growth can be attributed to the increasing population and rising disposable income, leading to an increase in demand for personal care products. Furthermore, the elderly population in the region is growing, leading to a higher demand for antioxidant-rich skincare products, particularly those for skin whitening and anti-aging. In the health sector, natural antioxidants are gaining popularity in the prevention and treatment of chronic disorders such as heart problems and diabetes.

Furthermore, processed edibles, fortified foods, and beverages are increasingly being infused with natural antioxidants to enhance their nutritional value and extend their shelf life. Unilever Plc's Dermalogica brand offers various antioxidant-rich products, such as intensive moisture balance face moisturizers, which are abundant in vitamins and other antioxidants. Growing consumer awareness about personal hygiene and wellness is driving demand for natural antioxidant-infused personal care products. The market is expected to register the fastest growth rate during the forecast period.

Market Dynamics

Our researchers analyzed the data with 2023 as the base year, along with the key drivers, trends, and challenges. A holistic analysis of drivers will help companies refine their marketing strategies to gain a competitive advantage.

What are the key market drivers leading to the rise in the adoption of the Natural Antioxidants Market?

The rising demand of natural antioxidants from the personal care industry is the key driver of the market.

  • Antioxidants are essential compounds that neutralize free radicals, which can cause oxidative stress and damage to cells. Free radicals are unstable atoms that can harm the skin's structure and genetic material, leading to inflammation, hyperpigmentation, acne, and wrinkles. External factors such as sunlight, pollution, environmental toxins, tobacco, and stress contribute to the formation of free radicals. One natural antioxidant is Rosemary Extract, derived from the Rosemary plant. It is available in both liquid and dry forms and is used as additive in various industries, including food and beverages, dairy and frozen desserts, personal care, animal feed, pharmaceuticals, and more.
  • Rosemary Extract functions as an antioxidant by scavenging free radicals and preventing cell damage. It also stimulates collagen production, which is essential for maintaining youthful-looking skin. In the food industry, it is used as a natural preservative and flavor enhancer. In personal care products, it is used for its antioxidant and anti-inflammatory properties. Antioxidants like Rosemary Extract are crucial in preventing and repairing the signs of aging caused by free radicals. They help protect the skin from environmental stressors and maintain its natural radiance and elasticity.

What are the market trends shaping the Natural Antioxidants Market?

Growing demand for nutraceutical antioxidants is the upcoming trend in the market.

  • Antioxidants are essential components of various nutraceutical products, derived from natural sources such as phytochemicals. These compounds, including alkaloids, terpenoids, and polyphenols, are found in a broad range of food products and dietary supplements. Antioxidants play a crucial role in the prevention of degenerative and chronic diseases due to their ability to neutralize free radicals in the body. Vitamins C and E, as well as newer ingredients like lutein and lycopene, are popular antioxidant ingredients in nutraceuticals.
  • The therapeutic potential of antioxidants is significant due to their multiple mechanisms of action. Regulatory bodies overseeing the nutraceutical industry ensure the safety and efficacy of these compounds. Consumers increasingly prefer natural antioxidants over synthetic alternatives due to health concerns and the desire for more holistic approaches to wellness. 

What challenges does Natural Antioxidants Market face during its growth?

High product cost is a key challenge affecting market growth.

  • Natural antioxidants, derived from plants such as pine and acerola seed, green tea, and others, are essential components in the cosmetics business. These antioxidants help protect the skin from damage caused by free radicals. Tocopherols, a type of natural antioxidant, are commonly used in the industry. However, the cost of producing tocopherol has risen due to the limited supply of vegetable oil, a key raw material. Vegetable oil is also in high demand for use in other industries and cooking purposes, leading to an increase in its price. As a result, the cost of natural antioxidants in their dry and liquid forms can be significant.
  • While synthetic antioxidants derived from petroleum products offer a lower cost alternative, there is growing consumer demand for natural options. To meet this demand, research and development efforts are ongoing to find new sources and production methods for natural antioxidants. This trend is expected to continue as the global population grows and the demand for cosmetics with natural ingredients increases. 

Exclusive Customer Landscape

The market forecasting report includes the adoption lifecycle of the market, covering from the innovator's stage to the laggard's stage. It focuses on adoption rates in different regions based on penetration. Furthermore, the market report also includes key purchase criteria and drivers of price sensitivity to help companies evaluate and develop their market growth analysis strategies.

Natural Antioxidants Market Share by Geography

 Customer Landscape

Key Companies & Market Insights

Companies are implementing various strategies, such as strategic alliances, market forecast , partnerships, mergers and acquisitions, geographical expansion, and product/service launches, to enhance their presence in the market. The market research and growth report includes detailed analyses of the competitive landscape of the market and information about key companies, including:

  • A and B Ingredients Inc.
  • Adisseo Co.
  • Air Liquide SA
  • Archer Daniels Midland Co.
  • Ashland Inc.
  • BASF SE
  • BIOTECNOLOGIAS APLICADAS SL
  • Cargill Inc.
  • DuPont de Nemours Inc.
  • Eastman Chemical Co.
  • IMCD NV
  • Indena S.p.A.
  • Kalsec Inc.
  • Kemin Industries Inc.
  • Koninklijke DSM NV
  • Prinova Group LLC
  • Ricela Health Foods Ltd.
  • Synthite Industries Pvt. Ltd.
  • Trigon Antioxidants Pvt. Ltd.

Qualitative and quantitative analysis of companies has been conducted to help clients understand the wider business environment as well as the strengths and weaknesses of key market players. Data is qualitatively analyzed to categorize companies as pure play, category-focused, industry-focused, and diversified; it is quantitatively analyzed to categorize companies as dominant, leading, strong, tentative, and weak.

Research Analyst Overview

The natural antioxidant market is witnessing significant growth due to the increasing demand for clean label products in various industries, including cosmetics and nutraceuticals. Natural antioxidants derived from fruits, vegetables, herbs, spices, trees, and nuts are gaining popularity as they offer health benefits and help prevent the oxidation process in food and beverages. These antioxidants, such as phenolics, carotenoids, polyphenols, Vitamin C, and vitamin E, are effective in neutralizing free radicals, which contribute to chronic diseases like cancer, heart disease, and diabetes. The demand for natural antioxidants is driven by the rising awareness of health and wellness, urbanization, and the increasing prevalence of chronic disorders.

Furthermore, the food and beverages industry is a significant consumer of natural antioxidants, with processed foods and convenience foods being major application areas. However, the cosmetics business also uses natural antioxidants in various personal care products, including moisturizers, body lotions, creams, shampoos, and conditioners. Regulatory bodies and organic certifications play a crucial role in the growth of the natural antioxidant market. The market is witnessing an increase in the production and use of natural antioxidants from various sources, such as rosemary extract, butylated hydroxyanisole, and tocopherols. Despite the availability of synthetic antioxidants like petroleum-derived additives, the demand for natural antioxidants is growing due to their health benefits and consumer preference for clean label products. The market is expected to continue its growth trajectory in the coming years, driven by the increasing demand for natural antioxidants in various industries and applications.

Market Scope

Report Coverage

Details

Page number

175

Base year

2023

Historic period

2018-2022

Forecast period

2024-2028

Growth momentum & CAGR

Accelerate at a CAGR of 7.07%

Market Growth 2024-2028

USD 669.6 million

Market structure

Fragmented

YoY growth 2023-2024(%)

6.45

Key countries

China, US, Japan, Germany, UK, and Canada

Competitive landscape

Leading Companies, Market Positioning of Companies, Competitive Strategies, and Industry Risks

Request Free Sample

What are the Key Data Covered in this Market Research and Growth Report?

  • CAGR of the market during the forecast period
  • Detailed information on factors that will drive the market growth and forecasting between 2024 and 2028
  • Precise estimation of the size of the market  and its contribution of the market in focus to the parent market
  • Accurate predictions about upcoming market growth and trends and changes in consumer behaviour
  • Growth of the market across APAC, North America, Europe, Middle East and Africa, and South America
  • Thorough analysis of the market's competitive landscape and detailed information about companies
  • Comprehensive analysis of factors that will challenge the growth of market companies

We can help! Our analysts can customize this market research report to meet your requirements. Get in touch

1 Executive Summary

  • 1.1 Market overview
    • Executive Summary - Chart on Market Overview
    • Executive Summary - Data Table on Market Overview
    • Executive Summary - Chart on Global Market Characteristics
    • Executive Summary - Chart on Market by Geography
    • Executive Summary - Chart on Market Segmentation by Application
    • Executive Summary - Chart on Market Segmentation by Type
    • Executive Summary - Chart on Incremental Growth
    • Executive Summary - Data Table on Incremental Growth
    • Executive Summary - Chart on Company Market Positioning

2 Market Landscape

  • 2.1 Market ecosystem
    • Parent Market
    • Data Table on - Parent Market
  • 2.2 Market characteristics
    • Market characteristics analysis
  • 2.3 Value chain analysis
    • Value Chain Analysis

3 Market Sizing

  • 3.1 Market definition
    • Offerings of companies included in the market definition
  • 3.2 Market segment analysis
    • Market segments
  • 3.3 Market size 2023
    • 3.4 Market outlook: Forecast for 2023-2028
      • Chart on Global - Market size and forecast 2023-2028 ($ million)
      • Data Table on Global - Market size and forecast 2023-2028 ($ million)
      • Chart on Global Market: Year-over-year growth 2023-2028 (%)
      • Data Table on Global Market: Year-over-year growth 2023-2028 (%)

    4 Historic Market Size

    • 4.1 Global Natural Antioxidants Market 2018 - 2022
      • Historic Market Size - Data Table on Global Natural Antioxidants Market 2018 - 2022 ($ million)
    • 4.2 Application segment analysis 2018 - 2022
      • Historic Market Size - Application Segment 2018 - 2022 ($ million)
    • 4.3 Type segment analysis 2018 - 2022
      • Historic Market Size - Type Segment 2018 - 2022 ($ million)
    • 4.4 Geography segment analysis 2018 - 2022
      • Historic Market Size - Geography Segment 2018 - 2022 ($ million)
    • 4.5 Country segment analysis 2018 - 2022
      • Historic Market Size - Country Segment 2018 - 2022 ($ million)

    5 Five Forces Analysis

    • 5.1 Five forces summary
      • Five forces analysis - Comparison between 2023 and 2028
    • 5.2 Bargaining power of buyers
      • Bargaining power of buyers - Impact of key factors 2023 and 2028
    • 5.3 Bargaining power of suppliers
      • Bargaining power of suppliers - Impact of key factors in 2023 and 2028
    • 5.4 Threat of new entrants
      • Threat of new entrants - Impact of key factors in 2023 and 2028
    • 5.5 Threat of substitutes
      • Threat of substitutes - Impact of key factors in 2023 and 2028
    • 5.6 Threat of rivalry
      • Threat of rivalry - Impact of key factors in 2023 and 2028
    • 5.7 Market condition
      • Chart on Market condition - Five forces 2023 and 2028

    6 Market Segmentation by Application

    • 6.1 Market segments
      • Chart on Application - Market share 2023-2028 (%)
      • Data Table on Application - Market share 2023-2028 (%)
    • 6.2 Comparison by Application
      • Chart on Comparison by Application
      • Data Table on Comparison by Application
    • 6.3 Food and beverages - Market size and forecast 2023-2028
      • Chart on Food and beverages - Market size and forecast 2023-2028 ($ million)
      • Data Table on Food and beverages - Market size and forecast 2023-2028 ($ million)
      • Chart on Food and beverages - Year-over-year growth 2023-2028 (%)
      • Data Table on Food and beverages - Year-over-year growth 2023-2028 (%)
    • 6.4 Pharmaceuticals - Market size and forecast 2023-2028
      • Chart on Pharmaceuticals - Market size and forecast 2023-2028 ($ million)
      • Data Table on Pharmaceuticals - Market size and forecast 2023-2028 ($ million)
      • Chart on Pharmaceuticals - Year-over-year growth 2023-2028 (%)
      • Data Table on Pharmaceuticals - Year-over-year growth 2023-2028 (%)
    • 6.5 Personal care - Market size and forecast 2023-2028
      • Chart on Personal care - Market size and forecast 2023-2028 ($ million)
      • Data Table on Personal care - Market size and forecast 2023-2028 ($ million)
      • Chart on Personal care - Year-over-year growth 2023-2028 (%)
      • Data Table on Personal care - Year-over-year growth 2023-2028 (%)
    • 6.6 Animal feeds - Market size and forecast 2023-2028
      • Chart on Animal feeds - Market size and forecast 2023-2028 ($ million)
      • Data Table on Animal feeds - Market size and forecast 2023-2028 ($ million)
      • Chart on Animal feeds - Year-over-year growth 2023-2028 (%)
      • Data Table on Animal feeds - Year-over-year growth 2023-2028 (%)
    • 6.7 Market opportunity by Application
      • Market opportunity by Application ($ million)
      • Data Table on Market opportunity by Application ($ million)

    7 Market Segmentation by Type

    • 7.1 Market segments
      • Chart on Type - Market share 2023-2028 (%)
      • Data Table on Type - Market share 2023-2028 (%)
    • 7.2 Comparison by Type
      • Chart on Comparison by Type
      • Data Table on Comparison by Type
    • 7.3 Vitamin C-based - Market size and forecast 2023-2028
      • Chart on Vitamin C-based - Market size and forecast 2023-2028 ($ million)
      • Data Table on Vitamin C-based - Market size and forecast 2023-2028 ($ million)
      • Chart on Vitamin C-based - Year-over-year growth 2023-2028 (%)
      • Data Table on Vitamin C-based - Year-over-year growth 2023-2028 (%)
    • 7.4 Vitamin E-based - Market size and forecast 2023-2028
      • Chart on Vitamin E-based - Market size and forecast 2023-2028 ($ million)
      • Data Table on Vitamin E-based - Market size and forecast 2023-2028 ($ million)
      • Chart on Vitamin E-based - Year-over-year growth 2023-2028 (%)
      • Data Table on Vitamin E-based - Year-over-year growth 2023-2028 (%)
    • 7.5 Polyphenols-based - Market size and forecast 2023-2028
      • Chart on Polyphenols-based - Market size and forecast 2023-2028 ($ million)
      • Data Table on Polyphenols-based - Market size and forecast 2023-2028 ($ million)
      • Chart on Polyphenols-based - Year-over-year growth 2023-2028 (%)
      • Data Table on Polyphenols-based - Year-over-year growth 2023-2028 (%)
    • 7.6 Carotenoids-based - Market size and forecast 2023-2028
      • Chart on Carotenoids-based - Market size and forecast 2023-2028 ($ million)
      • Data Table on Carotenoids-based - Market size and forecast 2023-2028 ($ million)
      • Chart on Carotenoids-based - Year-over-year growth 2023-2028 (%)
      • Data Table on Carotenoids-based - Year-over-year growth 2023-2028 (%)
    • 7.7 Market opportunity by Type
      • Market opportunity by Type ($ million)
      • Data Table on Market opportunity by Type ($ million)

    8 Customer Landscape

    • 8.1 Customer landscape overview
      • Analysis of price sensitivity, lifecycle, customer purchase basket, adoption rates, and purchase criteria

    9 Geographic Landscape

    • 9.1 Geographic segmentation
      • Chart on Market share by geography 2023-2028 (%)
      • Data Table on Market share by geography 2023-2028 (%)
    • 9.2 Geographic comparison
      • Chart on Geographic comparison
      • Data Table on Geographic comparison
    • 9.3 APAC - Market size and forecast 2023-2028
      • Chart on APAC - Market size and forecast 2023-2028 ($ million)
      • Data Table on APAC - Market size and forecast 2023-2028 ($ million)
      • Chart on APAC - Year-over-year growth 2023-2028 (%)
      • Data Table on APAC - Year-over-year growth 2023-2028 (%)
    • 9.4 North America - Market size and forecast 2023-2028
      • Chart on North America - Market size and forecast 2023-2028 ($ million)
      • Data Table on North America - Market size and forecast 2023-2028 ($ million)
      • Chart on North America - Year-over-year growth 2023-2028 (%)
      • Data Table on North America - Year-over-year growth 2023-2028 (%)
    • 9.5 Europe - Market size and forecast 2023-2028
      • Chart on Europe - Market size and forecast 2023-2028 ($ million)
      • Data Table on Europe - Market size and forecast 2023-2028 ($ million)
      • Chart on Europe - Year-over-year growth 2023-2028 (%)
      • Data Table on Europe - Year-over-year growth 2023-2028 (%)
    • 9.6 Middle East and Africa - Market size and forecast 2023-2028
      • Chart on Middle East and Africa - Market size and forecast 2023-2028 ($ million)
      • Data Table on Middle East and Africa - Market size and forecast 2023-2028 ($ million)
      • Chart on Middle East and Africa - Year-over-year growth 2023-2028 (%)
      • Data Table on Middle East and Africa - Year-over-year growth 2023-2028 (%)
    • 9.7 South America - Market size and forecast 2023-2028
      • Chart on South America - Market size and forecast 2023-2028 ($ million)
      • Data Table on South America - Market size and forecast 2023-2028 ($ million)
      • Chart on South America - Year-over-year growth 2023-2028 (%)
      • Data Table on South America - Year-over-year growth 2023-2028 (%)
    • 9.8 China - Market size and forecast 2023-2028
      • Chart on China - Market size and forecast 2023-2028 ($ million)
      • Data Table on China - Market size and forecast 2023-2028 ($ million)
      • Chart on China - Year-over-year growth 2023-2028 (%)
      • Data Table on China - Year-over-year growth 2023-2028 (%)
    • 9.9 US - Market size and forecast 2023-2028
      • Chart on US - Market size and forecast 2023-2028 ($ million)
      • Data Table on US - Market size and forecast 2023-2028 ($ million)
      • Chart on US - Year-over-year growth 2023-2028 (%)
      • Data Table on US - Year-over-year growth 2023-2028 (%)
    • 9.10 Japan - Market size and forecast 2023-2028
      • Chart on Japan - Market size and forecast 2023-2028 ($ million)
      • Data Table on Japan - Market size and forecast 2023-2028 ($ million)
      • Chart on Japan - Year-over-year growth 2023-2028 (%)
      • Data Table on Japan - Year-over-year growth 2023-2028 (%)
    • 9.11 Germany - Market size and forecast 2023-2028
      • Chart on Germany - Market size and forecast 2023-2028 ($ million)
      • Data Table on Germany - Market size and forecast 2023-2028 ($ million)
      • Chart on Germany - Year-over-year growth 2023-2028 (%)
      • Data Table on Germany - Year-over-year growth 2023-2028 (%)
    • 9.12 UK - Market size and forecast 2023-2028
      • Chart on UK - Market size and forecast 2023-2028 ($ million)
      • Data Table on UK - Market size and forecast 2023-2028 ($ million)
      • Chart on UK - Year-over-year growth 2023-2028 (%)
      • Data Table on UK - Year-over-year growth 2023-2028 (%)
    • 9.13 Canada - Market size and forecast 2023-2028
      • Chart on Canada - Market size and forecast 2023-2028 ($ million)
      • Data Table on Canada - Market size and forecast 2023-2028 ($ million)
      • Chart on Canada - Year-over-year growth 2023-2028 (%)
      • Data Table on Canada - Year-over-year growth 2023-2028 (%)
    • 9.14 Market opportunity by geography
      • Market opportunity by geography ($ million)
      • Data Tables on Market opportunity by geography ($ million)

    10 Drivers, Challenges, and Opportunity/Restraints

    • 10.1 Market drivers
      • 10.2 Market challenges
        • 10.3 Impact of drivers and challenges
          • Impact of drivers and challenges in 2023 and 2028
        • 10.4 Market opportunities/restraints

          11 Competitive Landscape

          • 11.1 Overview
            • 11.2 Competitive Landscape
              • Overview on criticality of inputs and factors of differentiation
            • 11.3 Landscape disruption
              • Overview on factors of disruption
            • 11.4 Industry risks
              • Impact of key risks on business

            12 Competitive Analysis

            • 12.1 Companies profiled
              • Companies covered
            • 12.2 Market positioning of companies
              • Matrix on companies position and classification
            • 12.3 Adisseo Co.
              • Adisseo Co. - Overview
              • Adisseo Co. - Product / Service
              • Adisseo Co. - Key news
              • Adisseo Co. - Key offerings
            • 12.4 Archer Daniels Midland Co.
              • Archer Daniels Midland Co. - Overview
              • Archer Daniels Midland Co. - Business segments
              • Archer Daniels Midland Co. - Key news
              • Archer Daniels Midland Co. - Key offerings
              • Archer Daniels Midland Co. - Segment focus
            • 12.5 BASF SE
              • BASF SE - Overview
              • BASF SE - Business segments
              • BASF SE - Key news
              • BASF SE - Key offerings
              • BASF SE - Segment focus
            • 12.6 BIOTECNOLOGIAS APLICADAS SL
              • BIOTECNOLOGIAS APLICADAS SL - Overview
              • BIOTECNOLOGIAS APLICADAS SL - Product / Service
              • BIOTECNOLOGIAS APLICADAS SL - Key offerings
            • 12.7 Cargill Inc.
              • Cargill Inc. - Overview
              • Cargill Inc. - Product / Service
              • Cargill Inc. - Key news
              • Cargill Inc. - Key offerings
            • 12.8 DuPont de Nemours Inc.
              • DuPont de Nemours Inc. - Overview
              • DuPont de Nemours Inc. - Business segments
              • DuPont de Nemours Inc. - Key news
              • DuPont de Nemours Inc. - Key offerings
              • DuPont de Nemours Inc. - Segment focus
            • 12.9 Kalsec Inc.
              • Kalsec Inc. - Overview
              • Kalsec Inc. - Product / Service
              • Kalsec Inc. - Key offerings
            • 12.10 Koninklijke DSM NV
              • Koninklijke DSM NV - Overview
              • Koninklijke DSM NV - Business segments
              • Koninklijke DSM NV - Key news
              • Koninklijke DSM NV - Key offerings
              • Koninklijke DSM NV - Segment focus
            • 12.11 Prinova Group LLC
              • Prinova Group LLC - Overview
              • Prinova Group LLC - Product / Service
              • Prinova Group LLC - Key offerings
            • 12.12 Synthite Industries Pvt. Ltd.
              • Synthite Industries Pvt. Ltd. - Overview
              • Synthite Industries Pvt. Ltd. - Product / Service
              • Synthite Industries Pvt. Ltd. - Key offerings

            13 Appendix

            • 13.1 Scope of the report
              • 13.2 Inclusions and exclusions checklist
                • Inclusions checklist
                • Exclusions checklist
              • 13.3 Currency conversion rates for US$
                • Currency conversion rates for US$
              • 13.4 Research methodology
                • Research methodology
              • 13.5 Data procurement
                • Information sources
              • 13.6 Data validation
                • Data validation
              • 13.7 Validation techniques employed for market sizing
                • Validation techniques employed for market sizing
              • 13.8 Data synthesis
                • Data synthesis
              • 13.9 360 degree market analysis
                • 360 degree market analysis
              • 13.10 List of abbreviations
                • List of abbreviations

              Research Methodology

              Technavio presents a detailed picture of the market by way of study, synthesis, and summation of data from multiple sources. The analysts have presented the various facets of the market with a particular focus on identifying the key industry influencers. The data thus presented is comprehensive, reliable, and the result of extensive research, both primary and secondary.

              INFORMATION SOURCES

              Primary sources

              • Manufacturers and suppliers
              • Channel partners
              • Industry experts
              • Strategic decision makers

              Secondary sources

              • Industry journals and periodicals
              • Government data
              • Financial reports of key industry players
              • Historical data
              • Press releases

              DATA ANALYSIS

              Data Synthesis

              • Collation of data
              • Estimation of key figures
              • Analysis of derived insights

              Data Validation

              • Triangulation with data models
              • Reference against proprietary databases
              • Corroboration with industry experts

              REPORT WRITING

              Qualitative

              • Market drivers
              • Market challenges
              • Market trends
              • Five forces analysis

              Quantitative

              • Market size and forecast
              • Market segmentation
              • Geographical insights
              • Competitive landscape

              Interested in this report?

              Get your sample now to see our research methodology and insights!

              Download Now

              Frequently Asked Questions

              Natural Antioxidants market growth will increase by $ 669.6 mn during 2024-2028 .

              The Natural Antioxidants market is expected to grow at a CAGR of 7.07% during 2024-2028 .

              Natural Antioxidants market is segmented by Application( Food and beverages, Pharmaceuticals, Personal care, Animal feeds) Type( Vitamin C-based, Vitamin E-based, Polyphenols-based, Carotenoids-based)

              A and B Ingredients Inc., Adisseo Co., Air Liquide SA, Archer Daniels Midland Co., Ashland Inc., BASF SE, BIOTECNOLOGIAS APLICADAS SL, Cargill Inc., DuPont de Nemours Inc., Eastman Chemical Co., IMCD NV, Indena S.p.A., Kalsec Inc., Kemin Industries Inc., Koninklijke DSM NV, Prinova Group LLC, Ricela Health Foods Ltd., Synthite Industries Pvt. Ltd., Trigon Antioxidants Pvt. Ltd. are a few of the key vendors in the Natural Antioxidants market.

              APAC will register the highest growth rate of 55% among the other regions. Therefore, the Natural Antioxidants market in APAC is expected to garner significant business opportunities for the vendors during the forecast period.

              China, US, Japan, Germany, UK, Canada

              • Rising demand of natural antioxidants from personal care industryNatural antioxidants work by reversing or preventing free radicals from causing oxidative stress. Free radical damage damages the structure and genetic material is the driving factor this market.
              • which leads to inflammation that disrupts the skin regularly scheduled self-repair systems. Eventually is the driving factor this market.
              • this can lead to hyperpigmentation is the driving factor this market.
              • acne is the driving factor this market.
              • and cell damage that results in wrinkles. Sunlight is the driving factor this market.
              • pollution is the driving factor this market.
              • environmental toxins is the driving factor this market.
              • tobacco is the driving factor this market.
              • and stress also contribute to free radicals. Therefore is the driving factor this market.
              • antioxidants work by scavenging atoms to lose free radicals or electrons so that they cannot cause cell damage. Antioxidants help correct signs of aging is the driving factor this market.
              • repair skin is the driving factor this market.
              • and brighten skin tone. Some antioxidants is the driving factor this market.
              • like vitamin C is the driving factor this market.
              • can also stimulate collagen production is the driving factor this market.
              • which is vital for youthful skin. Some of the natural antioxidants used in personal care products are vitamin c is the driving factor this market.
              • niacinamide is the driving factor this market.
              • resveratrol is the driving factor this market.
              • vitamin e is the driving factor this market.
              • retinol (Vitamin A) is the driving factor this market.
              • Coenzyme Q10 is the driving factor this market.
              • and polyphenols.The growth in the global aging population (above 65 years) is increasing the demand for anti-aging professional skincare products. The signs of anti-aging include wrinkles is the driving factor this market.
              • dark spots is the driving factor this market.
              • dark circles is the driving factor this market.
              • hyperpigmentation is the driving factor this market.
              • and uneven skin tones. To address this growing demand is the driving factor this market.
              • manufacturers of anti-aging products have started developing specific solutions and multifunctional and natural products by using ingredients such as natural antioxidants. Also is the driving factor this market.
              • the demand for natural and organic skincare products is increasing due to increased health consciousness among consumers of skincare products across the globe is the driving factor this market.
              • which is driving the adoption of natural antioxidants during the forecast period.Moreover is the driving factor this market.
              •  an increase in social media campaigns and celebrity endorsements for skincare products is the driving factor this market.
              • especially natural skincare products is the driving factor this market.
              • has increased awareness about anti-aging ingredients. The continuous release of promotional videos and advertisements by celebrities on social media platforms is the driving factor this market.
              • such as YouTube is the driving factor this market.
              • Instagram is the driving factor this market.
              • and Facebook is the driving factor this market.
              • influence the buying behavior of consumers is the driving factor this market.
              • especially Millennials. Social media influencers also create awareness about key ingredients in skincare products is the driving factor this market.
              • which are highly effective. This increases the adoption of skincare products that contain natural antioxidants like Vitamin C is the driving factor this market.
              • Niacinamide is the driving factor this market.
              • Vitamin E is the driving factor this market.
              • Retinol (Vitamin A) is the driving factor this market.
              • and others. Consumers are also concerned about various skin issues like aging is the driving factor this market.
              • wrinkles is the driving factor this market.
              • acne is the driving factor this market.
              • and others is the driving factor this market.
              • which is expected to drive the adoption of skincare products that contain natural antioxidants which in turn will boost the growth of the global natural antioxidants market during the forecast period.  is the driving factor this market.

              The Natural Antioxidants market vendors should focus on grabbing business opportunities from the Food and beverages segment as it accounted for the largest market share in the base year.